Note: This website was automatically translated, so some terms or nuances may not be completely accurate.
10 Years Since the Great East Japan Earthquake: Video Research Ltd. Investigates Changes in Media Environment and Consumer Values
Ten years since the Great East Japan Earthquake. Video Research Ltd. announced findings on changes in the media environment and consumer values, their impact on lifestyles, and the role of media in fostering consumer "trust" and "reassurance." It concluded that during emergencies, "television" demonstrated reliability while "the internet" showcased high immediacy. Over the decade, the media environment has become both "broadly" accessible and "deeply" personalized to closely accompany individuals.
<Key Points from This Presentation>
◎Ten years ago at the time of the disaster, television was the "trustworthy source of information." SNS proved useful for confirming safety.
◎ Since 2011, smartphone ownership has rapidly increased. Greater freedom in selecting and gathering information has led to "fragmentation" in consumers' values.
◎ Within the information society, awareness has shifted toward valuing substance; an efficient, low-effort mindset focused on what "never fails" for the individual is becoming widespread.
◎ The pandemic revealed "TV's reliability" and "the internet's role"; media drives consumers' peace of mind and comfort.
【1. Media Environment】
■During the disaster 10 years ago, TV was the "trusted information source"; SNS proved useful for confirming safety
<Household Viewership Ratings & LINE User Trends>
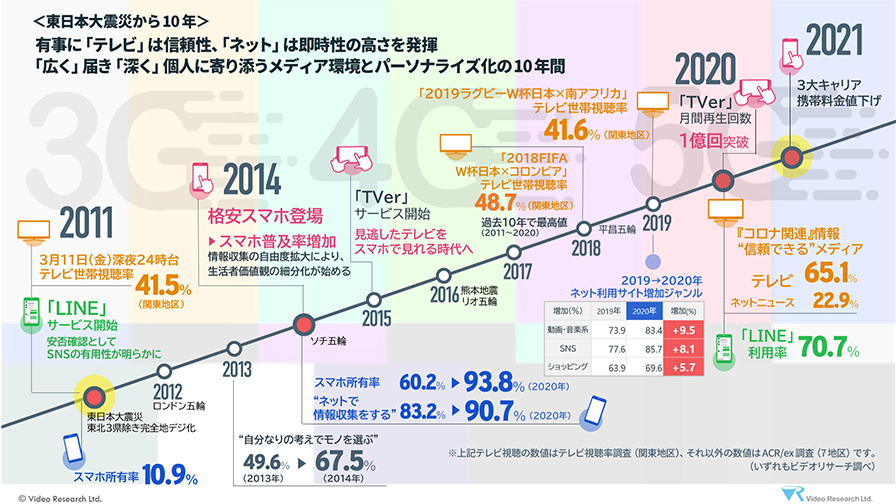
・At 14:46 on March 11, 2011, when the Great East Japan Earthquake struck, terrestrial TV stations simultaneously broadcast earthquake alerts. The total household viewing rate (HUT) reached 38.8% during the 15:00 hour (an 8-point increase compared to the previous weekday average). Furthermore, viewership more than doubled compared to normal times after midnight. This highlights the high level of attention paid to TV news reports, as people sought information regardless of the hour, and the shift in viewing times reflects the situation of stranded commuters returning home late at night. (Chart 1)
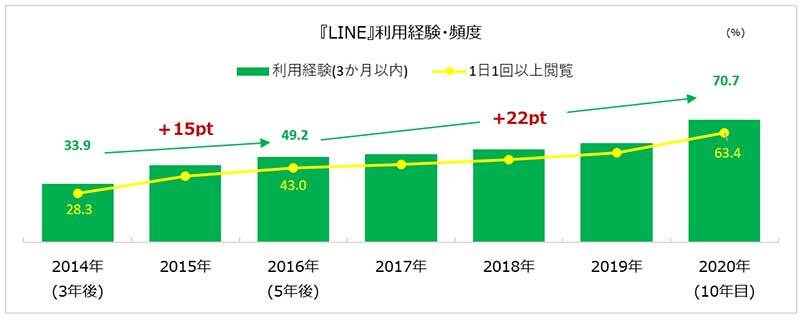
・After the disaster, SNS gained attention as a tool for confirming safety, with people sending and receiving information via Twitter and Facebook. The earthquake led to the launch of "LINE" in June 2011. Three years after its launch, usage reached 34%; five years later, 49%; and by 2020, approximately 70% of consumers were using it for daily communication. (Figure 2)

■Rapid increase in smartphone ownership since 2011; greater freedom in selecting and gathering information leads to "fragmentation" of consumer values
<Smartphone Ownership Rate, Internet Awareness, Shopping Awareness>
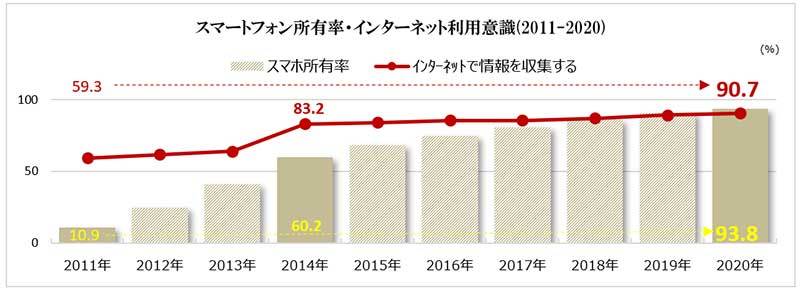
・Since 2011, internet infrastructure rapidly improved. By 2014, when budget smartphones emerged, "smartphone ownership" reached 60%. "Gathering information online" exceeded 80%, creating an environment where one in two people could instantly access necessary information—a highly immediate environment. (Figure 3)
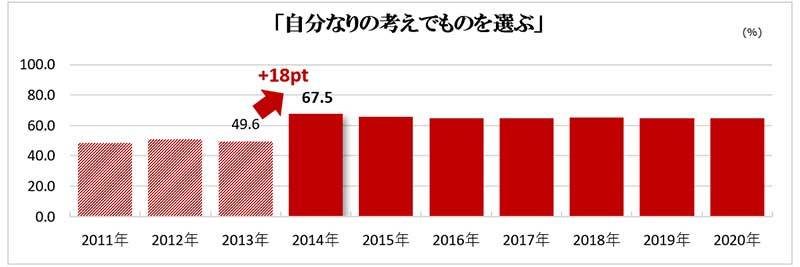
・This also influenced shopping attitudes. The mindset of "choosing items based on my own judgment" increased by 18 percentage points, from 50% in 2013 to 68% in 2014, indicating a trend toward fragmented values. (Chart 4)
【2. Values】
■In the information society, awareness is shifting toward valuing substance; efficient, low-consumption preferences that are "a sure bet" for oneself are becoming widespread.
<Changes in Attitudes Toward Products / Gender Differences>
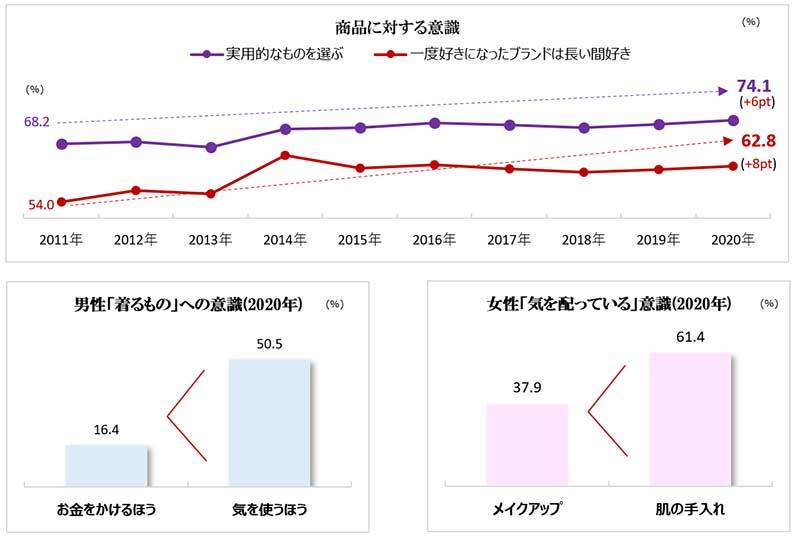
・Regarding product attitudes, the mindset of "choosing practical items" increased by 6 percentage points in 2020 (74%) compared to 2011. Similarly, the sentiment "Once I like a brand, I stay loyal for a long time" also rose by 8 percentage points in 2020 (63%) compared to 2011, indicating a gradual permeation of efficient, reliable consumption awareness. (Figure 5)
・Examining values by gender in the latest data reveals men are "careful about what they wear (51%)" but less inclined to "spend money on it (17%)". Meanwhile, women prioritize "skincare (61%)" over "makeup (38%)". This suggests a shift towards valuing naturalness and cherishing possessions over spending heavily on adornment. (Figure 5)
[3. The Current Role of Media]
■The Pandemic Revealed "Trust in Television" and "The Role of the Internet"; Media Leads in Providing Security and Comfort to Consumers
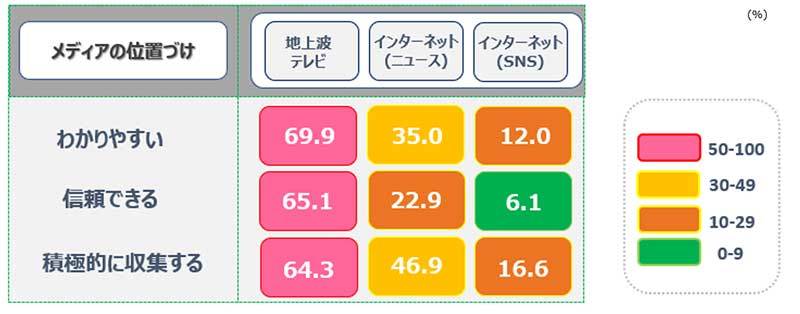
<Media Positioning in "COVID-19 Information" · TV/Internet Usage · Internet Usage Categories>
・Regarding the "COVID-19 pandemic," which caused social disruption, "TV (65%)" stood out with exceptionally high "trustworthiness." Meanwhile, in terms of the intention to "actively seek out information," not only "TV (64%)" but also "Internet News (47%)" reached around 50%, showing that both TV and the Internet are familiar media. (Figure 6)
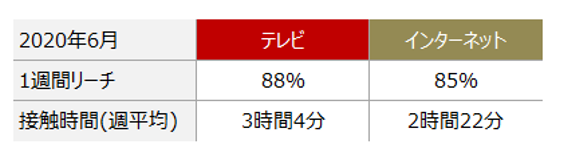
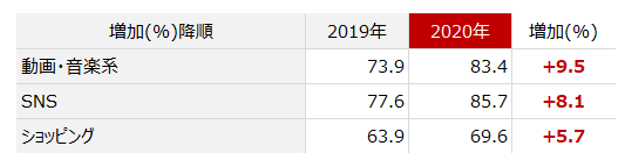
・Regarding internet usage in 2020, weekly reach exceeded 80%. Among categories showing increased usage, media enhancing personal satisfaction—such as "Video/Music (83%)", "SNS (86%)", and "Shopping (70%)"—showed a strong upward trend. (Figures 7 & 8)
■Video Research Ltd. Release Page
<10 Years Since the Great East Japan Earthquake> In Emergencies, "TV" Demonstrates Reliability, "Internet" Immediacy: A Decade of Media Environments Reaching "Broadly" and "Deeply" Personalizing to Individuals
https://www.videor.co.jp/press/2021/210309.html
Was this article helpful?
Share this article