Note: This website was automatically translated, so some terms or nuances may not be completely accurate.
What was the market size for smartphone advertising in 2014? D2C Inc. and CCI present their own estimates.
D2C Inc. announced its estimated results for the full-year (January-December) 2014 smartphone advertising market size on its operated platform, D2C Smile. This survey was conducted jointly with Cyber Communications Inc. (CCI) for data collection and estimation.
*"Please understand and acknowledge that these estimates are not precise and should be viewed for reference purposes only." (D2C Inc. Smile)
The smartphone advertising market size for 2014 (January-December) was estimated at 345 billion yen, accounting for 42% of the internet advertising market.
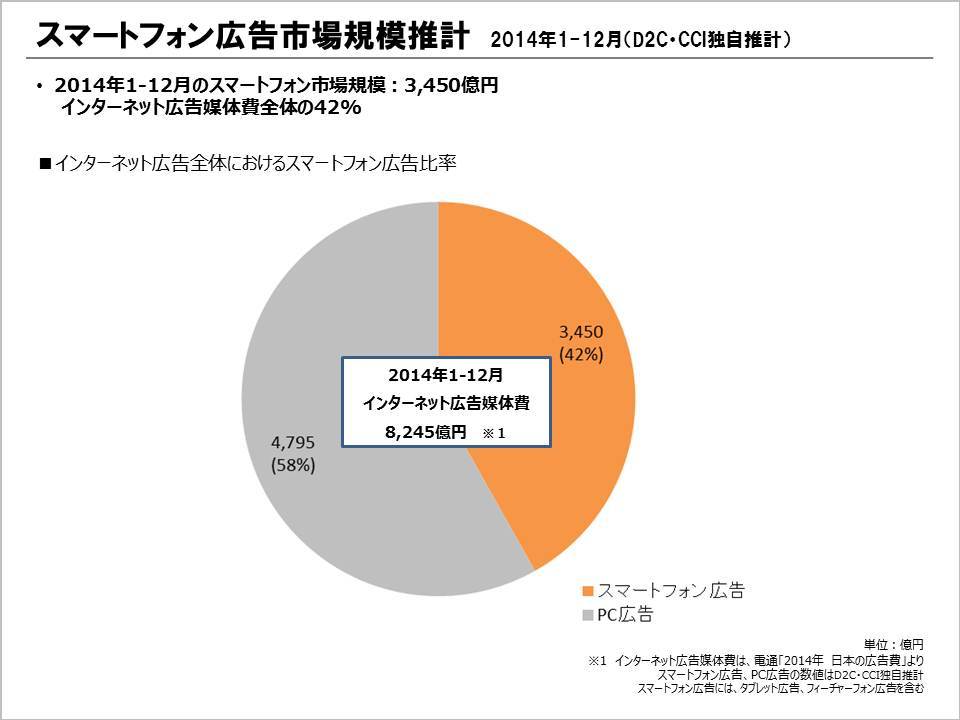
The smartphone advertising market size for January-December 2014 was estimated at ¥345 billion.
According to Dentsu Inc.'s "2014 Japan Advertising Expenditures" released in February, of the 1.0519 trillion yen in internet advertising expenditure (media costs + production costs), internet advertising media costs were 824.5 billion yen.
Although not strictly comparable due to differences in survey methods, breaking down these internet advertising media costs by device suggests smartphone advertising likely accounted for approximately 42%.
The smartphone advertising market grew significantly, up 166% year-on-year.
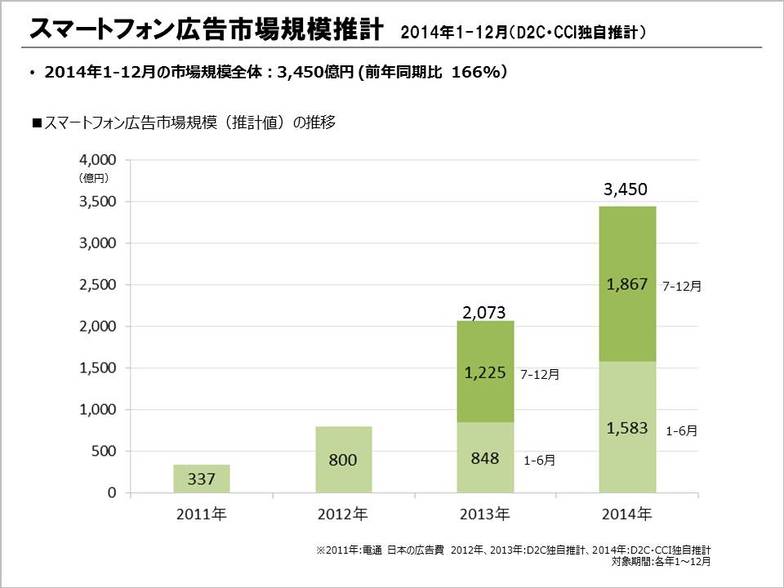
The overall growth rate of the smartphone advertising market is estimated to be 166% year-on-year.
The "2014 Japan Advertising Expenditures" report estimates internet advertising media costs grew 114.5% year-on-year, suggesting the smartphone advertising market's growth significantly contributed to the overall internet advertising market's expansion.
Looking at half-yearly figures, the market reached ¥158.3 billion in January-June 2014 and ¥186.7 billion in July-December 2014, showing further accumulation in the latter half.
The growth rate per half-year period shows a trend of slowing as the market expands: July-December 2013 (144% compared to the first half), January-June 2014 (129%), and July-December 2014 (118%). However, it is still considered to be expanding.
Composition: 10% block-sold ads, 72% programmatic ads, 18% performance-based ads
The estimated composition of smartphone advertising by type is as follows. This survey broadly categorizes advertising into three types: "Fixed-Price Advertising," "Performance-Based Advertising," and "Affiliate Advertising." Performance-Based Advertising is further subdivided into "Ad Networks," "Search-Triggered Advertising," and "Performance-Based Social Advertising." Affiliate Advertising includes affiliate marketing, real-world affiliate marketing, and reward-based advertising.

The overall composition was as follows: Display Advertising (10%, ¥35 billion), Programmatic Advertising (72%, ¥246.8 billion), and Performance-Based Advertising (18%, ¥63.2 billion).
Within programmatic advertising, the breakdown was search-linked advertising (35%, ¥119.4 billion), ad networks (29%, ¥101.5 billion), and programmatic social (8%, ¥25.9 billion).
The smartphone advertising market continues to be dominated by search-linked ads, ad networks, and performance-based ads, but programmatic social is expected to grow in prominence.
Programmatic social advertising is growing rapidly. Non-programmatic advertising is also showing steady growth.
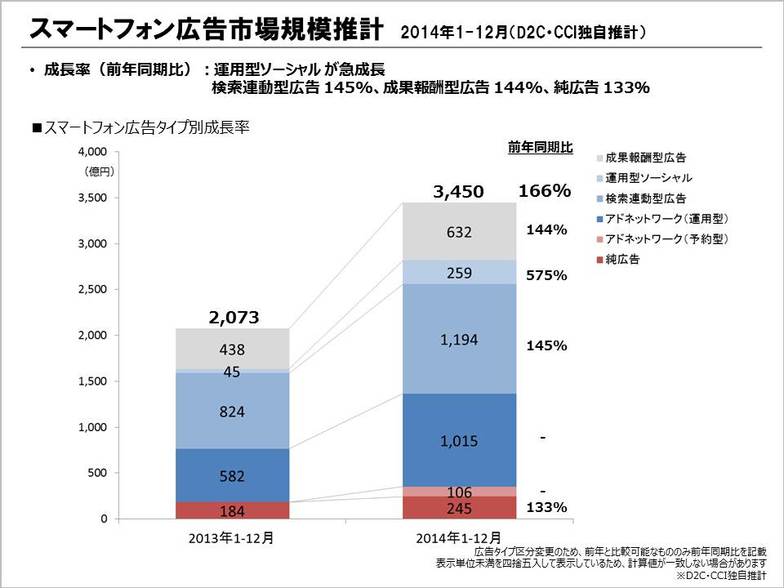
Growth projections by ad type are estimated as shown in the graph above. Programmatic social expanded rapidly, growing over fivefold from the previous year.
Furthermore, even search-linked advertising, the largest segment, grew by 145% year-on-year. Pure advertising, positioned within block-sold advertising, also showed solid growth at 133%.
*For this estimate, ad networks were split into "programmatic" and "reserved" types. If ad networks were combined, the growth rate would be 193% year-on-year. All ad types showed significant growth, resulting in an overall market growth of 166% year-on-year.
Reference: D2C Inc. Smile "What was the 2014 Smartphone Advertising Market Size? ~Full Year 2014 (Jan-Dec)~ ※D2C/CCI Original Estimates" http://www.d2c-smile.com/201505134559
Was this article helpful?
Share this article