Note: This website was automatically translated, so some terms or nuances may not be completely accurate.
DENTSU SOKEN INC. Publishes 'Information Media White Paper 2014' ~ Features Media Behavior Analysis at "Yeso-to" in the Opening Section
DENTSU SOKEN INC. Releases "Information Media White Paper 2014"
Smartphones have rapidly proliferated in recent years, significantly altering the behavior of consumers who now carry them. You notice more people holding smartphones in the streets and operating them on trains. The opening feature of the "Information Media White Paper 2014," titled "Yesoto," categorizes outdoor settings into seven scenes (streets, inside trains/buses, while driving, while riding as a passenger, inside stations, workplace/school, inside facilities) to understand the media contact environment in each scene. (DENTSU SOKEN INC. Media Innovation Research Department)
Rapid Smartphone Adoption Brings Major Changes to Consumer Behavior
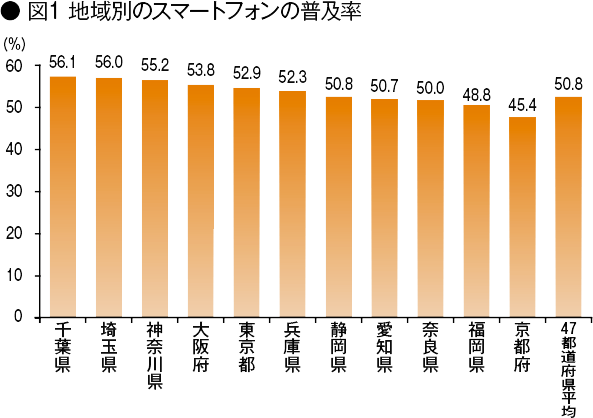
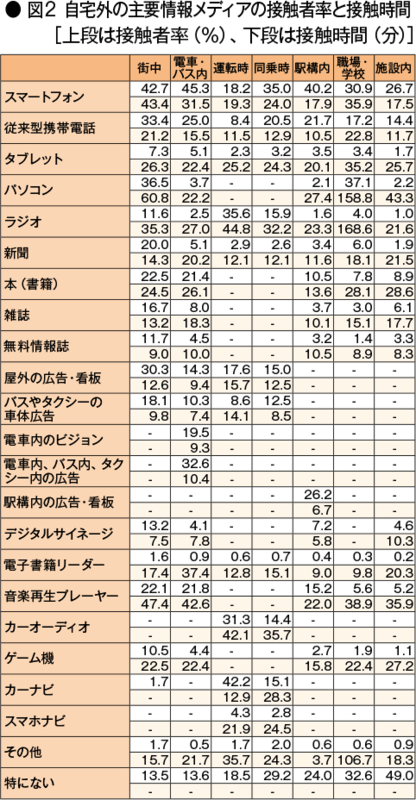
This survey found that the nationwide average smartphone penetration rate has already exceeded 50%, reaching 50.8% (Figure 1). By prefecture: Tokyo 52.9%, Kanagawa 55.2%, Chiba 56.1%. In the Kansai region: Osaka 53.8%, Hyogo 52.3%, Nara 50.0%. Fukuoka Prefecture, including Fukuoka City where subway communication infrastructure was established early, stands at 48.8%. Adoption rates are higher in areas with relatively large populations. The rapid expansion of high-speed communication environments like Wi-Fi and LTE in recent years has also contributed. The behavior of consumers who have started using smartphones has changed significantly, with smartphones increasingly capturing consumers' "eyes." Examining both contact rate and contact time (Figure 2) confirms that smartphones are the primary reach medium for home-based activities.
Except for "while driving," where smartphone use requires additional accessories and is relatively low, smartphones have high contact rates in every scenario. Their presence is particularly strong during public transportation use, such as 45.3% while "on trains/buses" and 40.2% while "inside stations." Indeed, observing daily commuters and students, it's evident that many are engrossed in social media or social games on their smartphones. Feature phones also maintain relatively high scores: 33.4% in "city streets" and 25.0% on "trains/buses."
Furthermore, examining the services used by commuters on smartphones and conventional mobile phones reveals that "inside trains/buses" sees news site browsing at 47.2%, with SNS usage showing LINE at 34.1%, Twitter at 19.9%, and Facebook at 14.6%. This suggests a relatively visual-information-centric communication pattern. In contrast, in "city streets," email services accounted for 44.7% and phone calls for 39.2%. At "station concourses," which differ from closed spaces like trains and buses and show a higher proportion of phone calls, transfer map searches stood out at 34.6%, highlighting information activities specific to stations.
Smartphone usage in the city exceeds 40%. One in two people find it a "good way to pass the time."
Outside specific scenarios, the "street" environment showed the highest smartphone contact rate at 42.7% (Figure 3-1). Indeed, the frequent sight of people using smartphones while walking in cities and campaigns discouraging this behavior indicate smartphones have deeply penetrated Japanese society. As mentioned earlier, conventional mobile phones also scored high at 33.4%, suggesting the mobile phone market is unlikely to shift entirely to smartphones immediately.
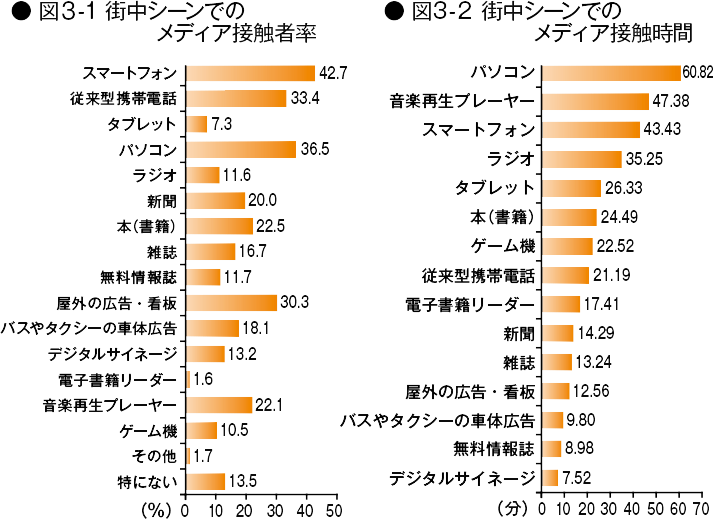
Outdoor advertising, such as billboards, is an important medium in urban areas, and contact rates with these media were also found to be high. While it was initially thought that smartphones were capturing consumers' "eyes," the contact rate for outdoor advertising itself was relatively high at 30.3%. On the other hand, tablets, which can be taken outdoors, still have a low contact rate of 7.3%, indicating they remain a minor presence as an information source in urban areas.
Looking at contact time (Figure 3-2), surprisingly, PCs averaged 60.8 minutes, the highest among all information sources. This is a result of improved wireless technologies like Wi-Fi and increased portability. Music players also saw a long contact time of 47.4 minutes as an auditory medium. Smartphones are used for a relatively long time at 43.4 minutes. Outdoor advertisements/signs and advertisements on buses and taxis, however, received only 12.6 minutes and 9.8 minutes respectively, indicating their contact time is currently low compared to other sources.
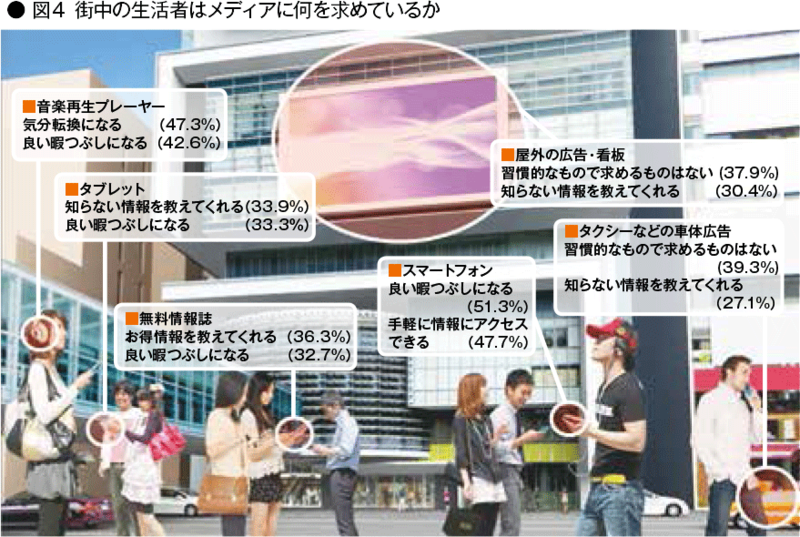
Looking at the benefits sought from each information source (Figure 4), smartphones ranked highest for "Good way to pass the time" at 51.3%, followed by "Easy access to information" at 47.7% and "Can retrieve information only when needed" at 46.3%. This indicates a strong mindset of using smartphones to make effective use of time.
With smartphone penetration this high, it's clear that capturing the behavioral patterns of consumers who own them is crucial. While smartphones excel as highly personalized information tools, their capacity for information dissemination as an advertising medium is not particularly large, and their efficiency undeniably falls short of mass media. However, they are undoubtedly a tool capable of precisely targeting consumers. To transform everyday people in public spaces into consumers, meticulous marketing design is essential. Survey results also reveal smartphones' strong character as a means to kill time. This necessitates designing consumer movement patterns to effectively utilize these "spare moments" as receptacles for information delivery. For instance, the networked expansion of digital signage could diversify information delivery methods throughout urban spaces. Furthermore, advancements in information processing technologies like location data and purchase history will likely spark a consumer acquisition battle even before they step outside their homes.
Detailed Analysis of Media Usage on Trains/Buses and While Driving
Here, we will individually overview scenarios outside of "urban areas." On "trains and buses," smartphone contact rates reach 45.3%, surpassing even books (the highest among paper media). Contact with in-vehicle ads like hanging advertisements stands at 32.6%. Music players account for 21.8%, with the longest contact time at 42.6 minutes. Communication design tailored to transportation systems is crucial. "While driving," auditory information is more compatible than visual information. Car navigation systems had the highest contact rate at 42.2%, with radio also performing well at 35.6%. Users of car audio systems reached 31.3%. Contact with smartphone navigation remained low at 4.3%. "While riding as a passenger," smartphone contact rate reached 35.0%, higher than while driving. Car navigation and car audio systems also hover around 15%. However, 29.2% of passengers report "nothing in particular," meaning they engage in no media contact activities. At "train stations," smartphone and station advertising/sign contact rates are high, but 24.0% report no contact with anything in particular. Users of music players or tablets tend to use them for relatively long periods once they start. They seek smartphones as a good way to pass the time. In "workplaces/schools," PC and smartphone contact rates were high, while other information sources were less prominent. PCs ranked top in both contact rate and duration, but smartphones also had a strong presence. Radio had a low contact rate but extremely long contact time. "Facilities" refers to public places like shopping centers and cafes, where overall contact with information media was low, and smartphone contact rates were subdued compared to other scenes. Among information media, smartphones had the highest contact rate at 26.7%, but about half had no contact with any media. Contact rates for paper media like books and magazines were low, but contact time tended to be relatively long.
As shown above, smartphones have a high contact rate among many information sources in the home environment, occupying a large portion of consumers' visual information. Responding to the proliferation of such devices, we expect to see increased efforts to link outdoor advertising with smartphones, as well as O2O-style integration between physical stores and online shopping. The natural increase in consumers searching for and researching information will also boost the market for search-linked advertising.
The survey was conducted online from August 31 to September 1, 2013,
targeting men and women aged 15 to 69 nationwide via the internet.
The valid sample size was 2,400.
'Information Media White Paper 2014'
DENTSU SOKEN INC., Media Innovation Research Department
The opening feature is "Audience Media Consumption Behavior: Changes Now Apparent." The main body consists of Part 1: "Trends in the Information Media Industry" and Part 2: "Information Media-Related Data." Published by Diamond Inc. on February 14. A4 size, 272 pages, ¥16,000 (excluding tax).
Was this article helpful?
Share this article