Note: This website was automatically translated, so some terms or nuances may not be completely accurate.
"2013 Japan Advertising Expenditures" totaled ¥5.9762 trillion, up 101.4% year-on-year. ― Total advertising spending increased for the second consecutive year, returning to a growth trajectory. TV spots, outdoor, transit, POP, and exhibition events performed well. ―
Japan's Advertising Expenditures in 2013: ¥5.9762 Trillion, Up 101.4% Year-on-Year
― Total advertising expenditure increased for the second consecutive year, returning to a growth trajectory. TV spots, outdoor, transit, POP, and exhibition events performed well ―
On February 20, Dentsu Inc. announced its "2013 (Heisei 25) Japan Advertising Expenditures," estimating Japan's total advertising expenditure and advertising expenditure by media type and industry.
According to the report, Japan's total advertising expenditure for 2013 (January to December) was ¥5,976.2 billion, a 101.4% increase year-on-year. The 2013 total exceeded the previous year's figure for the second consecutive year, driven by the sustained economic recovery trend due to the "Abenomics" effect and the impact of pre-consumption tax hike demand.
Click here for the Web DENTSU SOKEN INC. commentary article on "2013 (Heisei 25) Japan Advertising Expenditures" by Toshiyuki Kitahara, Senior Researcher, Media Innovation Research Department, DENTSU SOKEN INC.: http://dentsu-ho.com/articles/789
|
|
Characteristics of Advertising Expenditures in 2013 (Heisei 25) |
||
|
1. Total advertising expenditure in 2013 showed a positive trend, driven by the sustained economic recovery effect of "Abenomics" and the impact of pre-consumption tax hike demand in the latter half of the year. The first half saw an upward trend in the Japanese economy, including improved sales of high-priced goods, but this did not yet translate into an overall increase in advertising expenditure. Full-year total advertising expenditure reached ¥5,976.2 billion, a 101.4% increase year-on-year, marking the second consecutive year of growth. 2. By medium, the "four major mass media advertising expenditures" – "TV advertising" (100.9% YoY), "newspaper advertising" (98.8%), "magazine advertising" (98.0%), and "radio advertising" (99.8%) – saw a slight overall increase of 100.1%. Additionally, "promotional media advertising expenditures" also increased for the second consecutive year, rising to 100.1% of the previous year. "Satellite media-related advertising expenditures" (109.6%), where media value has become established, and "internet advertising expenditures" (108.1%), where performance-based advertising is performing well, continued to show steady growth. 3. By industry (mass media four categories), spending increased year-on-year in 8 out of 21 sectors: "Finance & Insurance" (115.6%: growth in direct-sale insurance products, NISA, etc.), "Food Services & Various Services" (110.3%: growth in legal services, etc.), "Real Estate & Housing Equipment" (105.8%: growth in general housing, etc.), "Household Goods" (105.5%: growth in beds, etc.), "Education, Medical Services, Religion" (103.1% YoY: increased by preparatory schools, cram schools, hospitals, medical services, etc.). Decreases were seen in "Hobbies & Sports Goods" (94.2% YoY: decreased by audio software, dolls, toys, etc.), "Government Agencies & Organizations" (94.6% YoY: decreased by political parties, political organizations, etc.), "Energy, Materials & Machinery" (94.9% YoY: decreased by electricity, gas, etc.), and "Distribution & Retail" (95.0% YoY: decreased by large discount stores, etc.). Decreases in political parties and organizations), "Energy, Materials, Machinery" (94.9%: Decreases in electricity, gas, etc.), "Distribution and Retail" (95.0%: Decreases in large discount stores, etc.), among 13 industries. |
1. Trends in Total Advertising Expenditures
Total advertising expenditure in 2013 was ¥5,976.2 billion, a 101.4% increase year-on-year, marking the second consecutive year of growth.
2. Overview of Advertising Expenditures by Medium
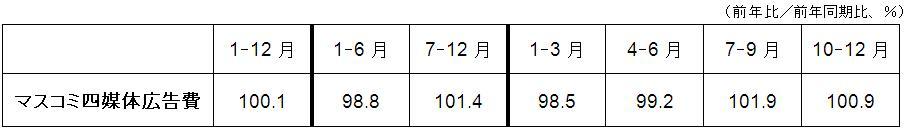
Advertising expenditures for the four major mass media outlets totaled ¥2.7825 trillion, a 0.1% increase year-on-year. Within this, television advertising expenditures increased by 0.9%. "Promotional media advertising expenditure" also exceeded the previous year at 100.1%. Furthermore, "satellite media-related advertising expenditure" grew to 109.6% and "internet advertising expenditure" also showed steady growth at 108.1%.
Looking at "advertising expenditures for the four major media" by quarter, a trend of lower spending in the first half of the year and recovery in the second half can be observed.
The situation by medium is as follows.
<Newspaper Advertising Expenditures>
- Newspaper advertising expenditure totaled ¥617 billion, down 1.2% year-on-year.
- Although spending fell below the previous year's level from January to May 2013, it recovered from June onward and remained steady. For the full year, the decline in the first half dragged down the overall result, preventing a year-on-year increase.
- With the economic recovery, advertising placements increased significantly in export-related sectors like "Automobiles and Related Products" and in "Finance and Insurance," which benefited from strong NISA and direct-to-consumer insurance sales. Additionally, placements for high-priced items like "Precision Equipment and Office Supplies" (watches) increased, capturing pre-consumption tax hike demand. As in the previous year, sectors with high direct-to-consumer advertising, such as "Cosmetics and Toiletries," also performed well.
- Newspaper publishers' digital editions continued to grow their membership, with regional papers also launching digital editions in succession. Impactful advertising techniques became more active, including large-format ads combining four newspaper pages, wrapping ads that envelop the newspaper, and advertising in special editions. Newspaper companies are initiating new efforts with various creative ideas.
<Magazine Advertising Expenditures>
- Magazine advertising spending totaled ¥249.9 billion, down 2.0% year-on-year.
- While trends toward digitization and the launch of major new magazines targeting women in their 40s were observed, simultaneous suspensions and discontinuations prevented a year-on-year increase.
- The "Fashion & Accessories" category, which holds a large share of magazine advertising, performed well at 101.3% year-on-year. Categories such as "Real Estate & Home Furnishings," "Finance & Insurance," and "Transportation & Leisure" exceeded the previous year's figures.
- Riding the wave of economic recovery, business magazines performed well, exceeding 100%.
- The number of newly launched magazines was 86, with most targeting readers aged 30 and above.
<Radio Advertising Expenditures>
- Radio advertising spending totaled ¥124.3 billion, down 0.2% year-on-year.
- Spending remained flat in the Tokyo metropolitan area, while local areas showed signs of recovery.
- Particularly strong performance was seen in "Real Estate & Home Equipment" (116.9% YoY), "Automobiles & Related Products" (109.5% YoY), and "Food Services & Various Services" (105.9% YoY), which benefited from pre-consumption tax hike demand. The affinity of radio as a medium for automobiles was reevaluated, leading to active program sponsorships and nationwide commercials.
- Listenership among the core demographic of listeners in their 40s and 50s recovered, while listenership among those in their 10s and 20s remained stable throughout the year.
- A total of 69 stations across 37 prefectures participated in radiko.jp. Both download numbers and unique users continued to increase.
<TV Advertising Expenditures>
- Television advertising expenditure totaled ¥1.7913 trillion, a 0.9% increase year-on-year.
- This marks the second consecutive year of growth.
- The first half of 2013 saw a slowdown due to factors like a rebound effect from the strong performance in the same period the previous year (recovery from the Thai floods, rebound effect from the impact of the Great East Japan Earthquake, large-scale advertising related to eco-car subsidies, etc.). Time-slot advertising (99.3% year-on-year) saw large-scale sports events like the "2013 World Baseball Classic (March)" and "FIFA Confederations Cup (June)", but these did not fully compensate for the strong performance of the previous year's "2012 London Olympics Volleyball World Final Qualification" and "UEFA EURO 2012".
- In the second half, advertising activity picked up due to improving corporate earnings and a recovery in personal consumption. TV spot advertising, in particular, gained momentum, showing strong growth at 102.0% year-on-year.
- Television spot advertising increased in sectors such as "Finance and Insurance" (127.6% YoY: growth in direct-to-consumer insurance, lottery, NISA-related ads, etc.), "Real Estate and Home Equipment" (114.6% YoY: growth in real estate brokerage, etc.), and "Beverages and Luxury Goods" (105.3% YoY: growth in beer, etc.).
<Advertising Production Costs for Four Mass Media Outlets>
(Note: Advertising production costs are included in media-specific advertising expenditures)
- Advertising production costs for the four major media totaled ¥309.1 billion, a 106.2% year-on-year increase.
- Of this, TV commercial production costs were ¥214.7 billion, a 107.9% increase year-on-year.
- Driven by the weak yen and rising stock prices, advertising demand exceeded the recovery-driven demand seen the previous year following the earthquake. Additionally, last-minute demand before the consumption tax hike boosted sales of high-priced goods.
- By industry, "Automobiles and Related Products," "Real Estate and Housing Equipment," and "Finance and Insurance" performed strongly.
<Satellite Media Advertising Expenditures>
- Satellite media advertising expenditure totaled ¥111.0 billion, a 109.6% increase year-on-year.
- BS broadcasting: ¥74.0 billion, 113.8% YoY. Continued strong performance from the previous year.
- CS broadcasting: ¥20.28 billion, 103.3% of the previous year. Exceeded ¥20 billion for the first time.
- CATV broadcasting: ¥16.75 billion, 100.5% of the previous year.
- Direct-to-consumer sales performed well across BS, CS, and CATV.
- Satellite media awareness is steadily expanding. BS viewing habits are becoming established, particularly among the middle-aged and older demographics, while CS and CATV viewership is expanding, primarily among affluent audiences.
<Internet Advertising Expenditures>
- Internet advertising expenditure (media costs + production costs) reached ¥938.1 billion, a 108.1% increase year-on-year.
- Internet advertising media fees reached ¥720.3 billion, a 108.7% increase year-on-year.
- Looking at the overall Internet advertising media cost market, growth exceeded the previous year's rate in 2013, driven by the diversification and evolution of devices and the economic recovery. Examining the market breakdown, while traditional block-sold advertising growth remained flat, the emerging field of performance-based advertising* showed strong growth.
- Fixed-slot advertising has become established across a wide range of industries, primarily in "Information & Communications," "Automobiles & Related Products," "Food," and "Beverages & Luxury Goods." In terms of methods, in addition to utilizing mainstream portal sites, various specialized sites focused on specific genres, rich advertising such as video, social media, smartphone sites, and apps were also employed. Amidst increasing device diversity, advertising operations are beginning to explore "device-free" approaches that manage campaigns across all devices.
- Within internet advertising media costs, programmatic advertising spending reached ¥412.2 billion, a 121.6% increase. The search-linked advertising market, which constitutes the majority of programmatic spending, continues to expand, buoyed by the growing adoption of smartphones and tablets. Furthermore, new advertising methods leveraging DSPs (systems that maximize advertising effectiveness from the advertiser's perspective) through RTB (real-time bidding) for highly targeted campaigns are experiencing rapid growth. Furthermore, programmatic advertising utilizing video is also surging. By industry, programmatic advertising is expanding and becoming more prevalent not only in traditional core sectors like "Finance & Insurance" and various industries utilizing e-commerce, but also in sectors such as "Automobiles & Related Products," "Food," and "Beverages & Luxury Goods," where it is increasingly being used for branding purposes.
(※) Programmatic advertising refers to advertising methods that automatically or instantly optimize ads using platforms capable of processing vast amounts of data. This includes search-linked ads and some ad networks, with newer examples like DSPs/ad exchanges/SSPs being typical. Note that block-sold ads, tie-up ads, and affiliate ads are not included in programmatic advertising.
- Internet advertising production costs reached ¥217.8 billion, a 106.2% increase.
- This exceeded the previous year due to device diversification and SNS penetration, but the growth rate continued to slow compared to the previous year.
- The number of projects increased alongside more active advertising and promotional activities. However, the number of large-scale projects decreased, and production unit costs continued to fall. Furthermore, with the growth of programmatic advertising, cost performance is increasingly emphasized throughout the entire process—from production to operation—for banners and landing pages used as measures to drive traffic to websites.
- Following the previous year, the "Real Estate & Home Furnishings" sector continued its strong growth. In 2013, sectors such as "Finance & Insurance," "Cosmetics & Toiletries," "Fashion & Accessories," "Pharmaceuticals & Medical Supplies," and "Education, Medical Services & Religion" also saw significant growth. Industries sensitive to economic conditions and those utilizing direct marketing stood out.
- Corporate websites, e-commerce sites, and membership sites for CRM purposes experienced significant growth. These sites are positioned as owned media, encompassing planning, system/program development, design/content creation, operation/maintenance, and performance verification.
<Promotional Media Advertising Expenditures>
- Promotional media advertising expenditure totaled ¥2.1446 trillion, a 100.1% increase year-on-year.
- This marks the second consecutive year of increase.
- Factors driving the overall increase included the expansion of various media and events at exhibitions such as motor shows and commercial facilities, as well as digital signage and POP advertising in transit advertising.
- Conversely, "insert advertisements" saw a decline due to rising printing and paper costs leading to smaller paper sizes. While the unaddressed mail market is expanding, "DM" faces intense competition. "Free papers/free magazines" and "telephone directories" also saw declines, partly due to a shift toward internet advertising. These factors impacted the overall growth rate of promotional media advertising expenditure.
- The roles of each media type are becoming clearer, sometimes converging and sometimes competing to deliver optimal performance.
- Outdoor advertising reached ¥307.1 billion, a 102.5% increase.
- This increase was driven by large-scale sign replacement demand, particularly for financial-related VI and CI signage.
- Digital boards entered their second full year of operation, with further media development. Advertisements came not only from the traditional "Beverages & Luxury Goods" and "Automobiles & Related Products" (including foreign cars) sectors, but also from new industries such as distribution.
- Large-screen displays saw expanded advertising from "Beverages & Confectionery" due to the intense heat in July and August, with this trend continuing into September.
- Stadium signage saw strong spot advertising demand tied to games.
- Commercial facilities such as Tokyo Skytree Town and Grand Front Osaka were particularly active.
- Transportation advertising reached ¥200.4 billion, a 101.5% increase.
- This marks a recovery to the ¥200 billion level for the first time in four years.
- By industry, growth was seen in "Beverages & Luxury Goods," "Food Services & Miscellaneous Services" (e.g., aesthetic salons), "Education, Medical Services & Religion" (e.g., language schools), and "Pharmaceuticals & Medical Supplies."
- Digital signage continued to expand with new installations and expansions. In-vehicle vision had particularly high utilization rates, and train interior stickers also performed well.
- Bus shelters are seeing increased utilization rates in certain regional areas (Fukuoka, Osaka, Nagoya, Hiroshima, etc.) due to favorable locations.
- POP advertising reached ¥195.3 billion, a 106.0% increase.
- POP advertising spending at storefronts, anticipating signs of increased consumption, continued to rise from the previous year.
- By industry, strong performance in "Automobiles & Related Products" was complemented by growth driven by "Information & Communications" (boosted by fare discounts and transfer campaigns) and "Food," "Beverages & Luxury Goods" (which saw increased consumer-facing campaigns).
- Methods combining internet advertising with in-store promotions diversified. Techniques promoting consumer purchases by using online channels to drive foot traffic and then supplementing final purchase information with POP displays increased.
- Exhibitions, videos, and others totaled ¥268 billion, a 102.8% increase.
- This was driven by the holding of large-scale exhibitions (such as Eco-Products, CEATEC, and motor shows).
- In Tokyo, Osaka, and Nagoya, the number of exhibitions and events increased alongside economic recovery and improved corporate performance. Additionally, in Tohoku, events related to reconstruction efforts increased.
3. Overview of Advertising Expenditures by Industry (21 Industries, Mass Media Only)
In 2013, advertising spending increased in 8 out of 21 industries and decreased in 13 industries.
Sectors showing increases included "Finance & Insurance" (115.6% YoY: growth in direct-sale insurance products, NISA accounts, etc.) and "Food Services & Miscellaneous Services" (110.3% YoY: growth in legal services, women's wigs, etc.), both achieving double-digit growth. Additionally, "Real Estate & Home Equipment" (105.8% YoY: increases in general housing, housing exhibitions, etc.), "Household Goods" (105.5% YoY: increases in beds, deodorizers, etc.), "Education, Medical Services, Religion" (103.1% YoY: increases in prep schools/cram schools, hospitals/medical services, language schools, etc.), and "Automobiles & Related Goods" (101.4% YoY: increases in kei cars, sedans, SUVs, etc.) also exceeded the previous year.
On the other hand, sectors showing declines included "Hobbies & Sports Goods" (94.2%: decreases in audio software, dolls, toys, etc.), "Government Agencies & Organizations" (94.6%: Decreases in political parties and organizations), "Energy, Materials, Machinery" (94.9%: Decreases in electricity, gas, etc.), "Distribution, Retail" (95.0%: Decreases in large mass retailers, etc.), and "Food" (96.0%: Decreases in health foods, beauty foods, etc.).
Dentsu Inc. News Release
http://www.dentsu.co.jp/news/release/2014/pdf/2014014-0220.pdf
Was this article helpful?
Share this article