Note: This website was automatically translated, so some terms or nuances may not be completely accurate.
What are people's attitudes toward LGBTQ+ issues? ~ Latest Survey Report
Sayuri Nakagawa
Kahori Kishimoto
Dentsu Inc.
Since conducting Japan's first large-scale survey on LGBTQ+ in 2012, Dentsu Inc. has continued this research for over a decade. The fifth iteration, the "LGBTQ+ Survey 2023" (*), analyzed not only the attitudes and experiences of LGBTQ+ individuals but also the awareness, knowledge, and actions of non-LGBTQ+ individuals.
This series will analyze the latest survey results from various perspectives. The first installment introduces the main topics of the "LGBTQ+ Survey 2023".
※The survey was conducted primarily by the dJ Sustainability Promotion Office, an organization within dentsu Japan of the Dentsu Group, with the cooperation of Dentsu Diversity Lab, which conducts research and provides solutions on diversity, equity, and inclusion issues.
〈Table of Contents〉
▼LGBTQ+ Identity Holders: 9.7%
▼ Inclusion Awareness for LGBTQ+: About 80%. But a Gap Exists with Action
▼Employment Intent at Companies with LGBTQ+ Initiatives: About 60%
▼Parents of LGBTQ+ Children: About 70% Say "I Want to Support My Child's Life"
▼Partnership System: Related to Livability for Those with Partners, but Awareness Remains a Challenge
The proportion of LGBTQ+ individuals is 9.7%
The "LGBTQ+ Survey 2023" classified gender identity based on the combination of the following three elements:
- Gender identity
- Sex assigned at birth
- Sexual orientation (gender of romantic/sexual attraction)
Based on responses at the time of the survey, the "LGBTQ+ population" is defined as respondents who are not heterosexual (heterosexual) and whose gender identity does not match the sex assigned at birth (cisgender).
A screening survey of 57,500 Japanese residents aged 20 to 59 found that the LGBTQ+ population accounted for 9.7% of all respondents. Dentsu Inc. Diversity Lab speculates that one factor contributing to the slight increase from 8.9% in the 2018 and 2020 surveys is the advancement of awareness regarding one's own gender identity and sexual orientation, driven by increased information about LGBTQ+ issues.
However, considering that some respondents may still find it difficult to express their gender identity or sexual orientation even in an anonymous survey, and that perceptions of gender and sexuality can be fluid within individuals, we believe it is necessary to continue monitoring the trend of these scores.
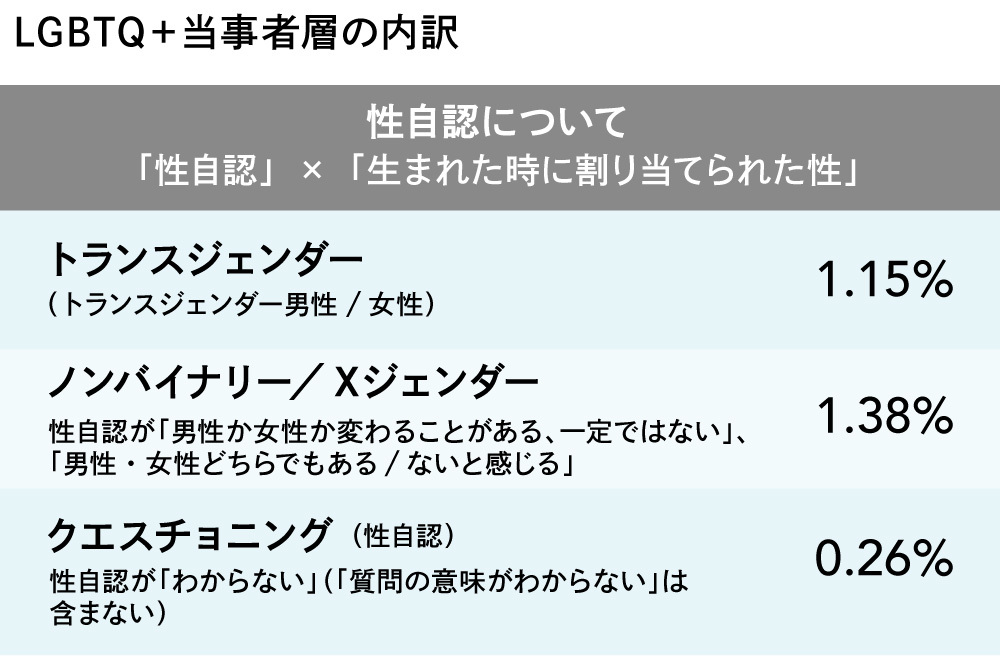
We also calculated breakdowns based on the combinations of "gender identity × sex assigned at birth" and "gender identity × sexual orientation." As in the previous survey, this confirmed the existence of diverse gender identities beyond L (lesbian), G (gay), B (bisexual), and T (transgender) that fall under Q+.
For "gender identity × sex assigned at birth": * Transgender (gender identity differs from sex assigned at birth): 1.15% * Nonbinary/X-gender (gender identity is not fixed, may change between male and female, or is neither male nor female): 1.38% Those who answered "questioning" regarding their gender identity accounted for 0.26%.
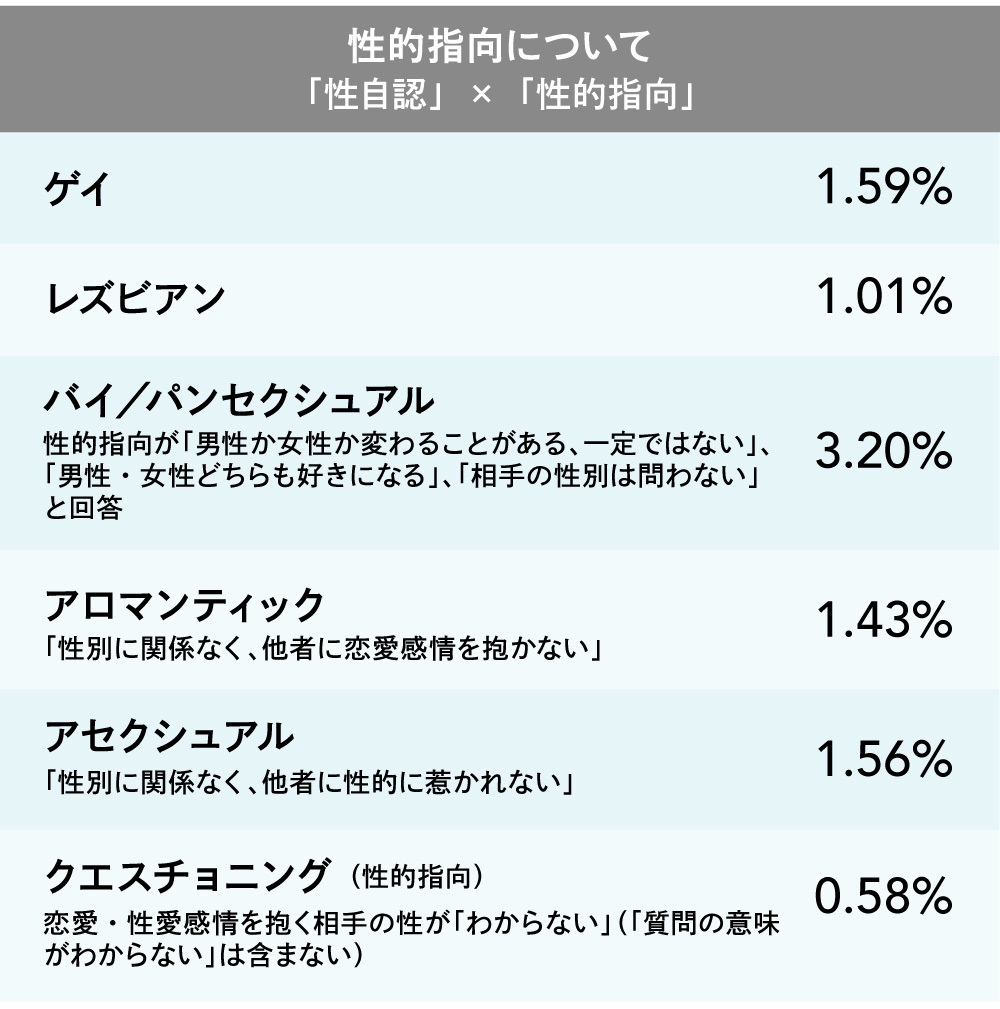
Regarding "gender identity × sexual orientation," besides "gay" (1.59%) and "lesbian" (1.01%), the largest proportion was "bisexual/pansexual" at 3.20%, which includes those who responded that their sexual orientation "can change between men and women, is not fixed," "can be attracted to both men and women," or "does not depend on the other person's gender."
Additionally, "Aromantic" (1.43%), meaning not experiencing romantic attraction to others regardless of gender, "Asexual" (1.56%), meaning not experiencing sexual attraction to others regardless of gender, and "Questioning" (0.58%), meaning unsure of sexual orientation, were also reported.
Note that the total exceeds 9.7% because some respondents identified with multiple identities, such as being non-binary and asexual.
Inclusion awareness toward LGBTQ+ individuals stands at about 80%. However, there is a gap between awareness and action.
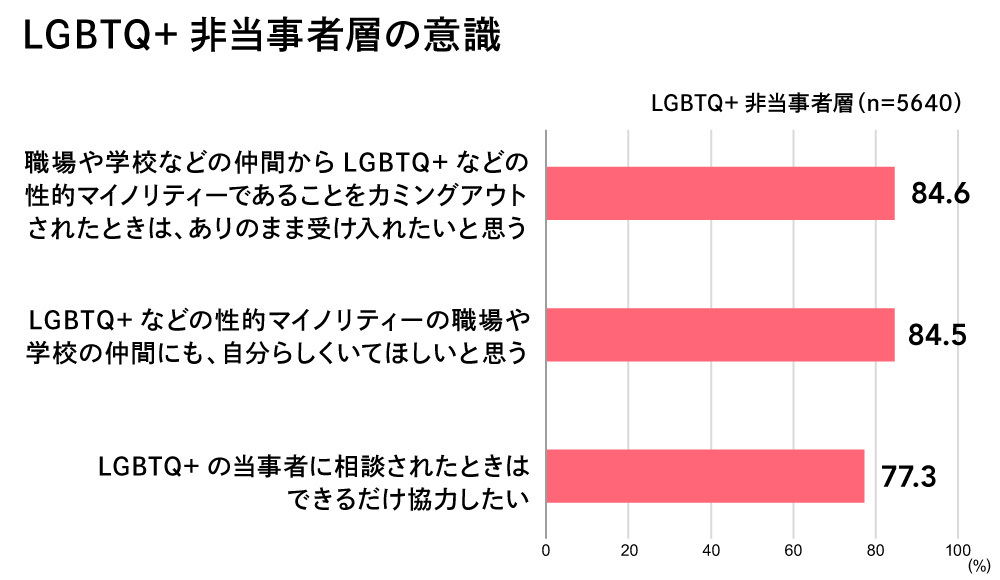
As momentum for diversity and inclusion grows in companies, schools, and local governments, awareness of LGBTQ+ inclusion is also rising among non-LGBTQ+ individuals. For example, 84.6% of non-LGBTQ+ respondents strongly agreed with the statement: "If a colleague or classmate came out as LGBTQ+ or another sexual minority, I would want to accept them as they are."
Other findings also show strong inclusion awareness: 84.5% agreed "I want LGBTQ+ colleagues or classmates to be themselves," and 77.3% said "I would try to help if an LGBTQ+ person asked for advice."
However, examining actual behavior reveals a gap with these attitudes. For instance, while using gender-neutral language is considered considerate toward LGBTQ+ individuals, only 17.1% of non-LGBTQ+ respondents stated, "I use gender-neutral terms like 'partner' or 'lover' instead of 'boyfriend' or 'girlfriend.'"
Furthermore, only 36.7% said they "change the subject or call out discriminatory remarks made in their presence," and 31.1% stated they "actively seek information and listen to the voices of LGBTQ+ individuals to gain a proper understanding." Overall, these results were low.
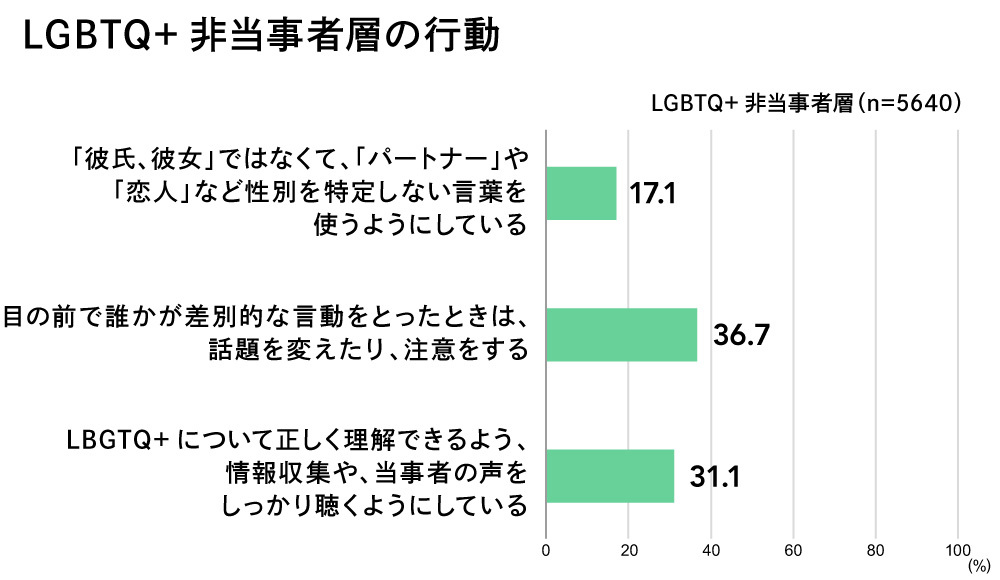
While awareness of inclusion for LGBTQ+ individuals is growing, the number of people actually taking actions that lead to inclusion remains limited.
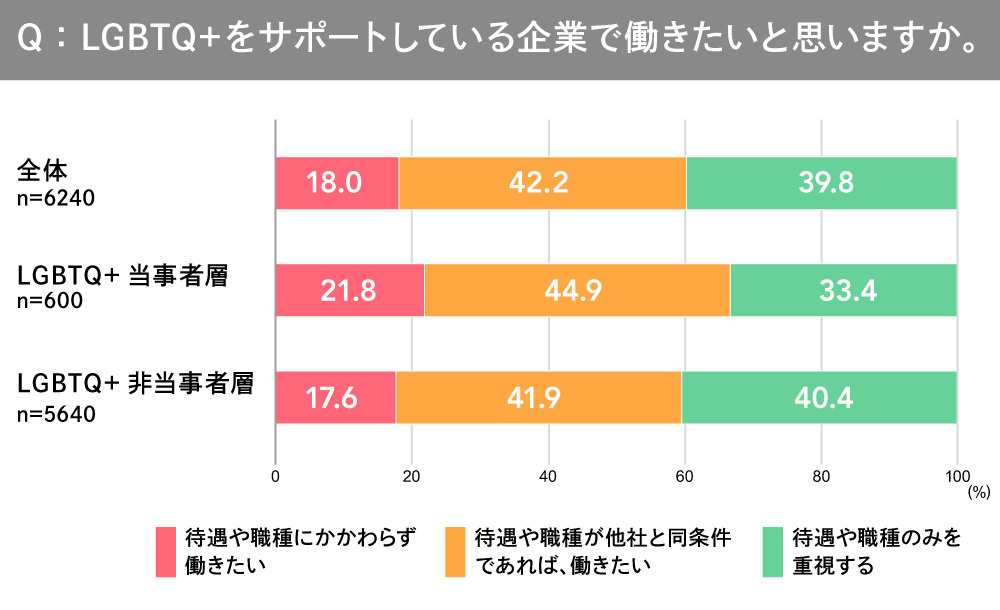
Approximately 60% express interest in working for companies implementing LGBTQ+ initiatives
The number of companies working to create workplaces where LGBTQ+ individuals can be themselves is increasing year by year. In 2022, over 400 companies applied for the PRIDE Index, an evaluation framework developed by "work with Pride," an organization supporting the promotion and establishment of LGBTQ+ diversity management. The PRIDE Index assesses workplace initiatives related to LGBTQ+ issues.
When asked if they would like to work for a company that supports LGBTQ+ individuals, 18.0% responded "Yes, regardless of compensation or job type" (21.8% among LGBTQ+ individuals, 17.6% among non-LGBTQ+ individuals). "I would want to work there if the compensation and job type were the same as other companies" was 42.2% (44.9% among LGBTQ+ individuals, 41.9% among non-LGBTQ+ individuals). Overall, about 60% expressed a desire to work for LGBTQ+-friendly companies. While the desire was slightly stronger among LGBTQ+ individuals, there was no significant difference among non-LGBTQ+ individuals.
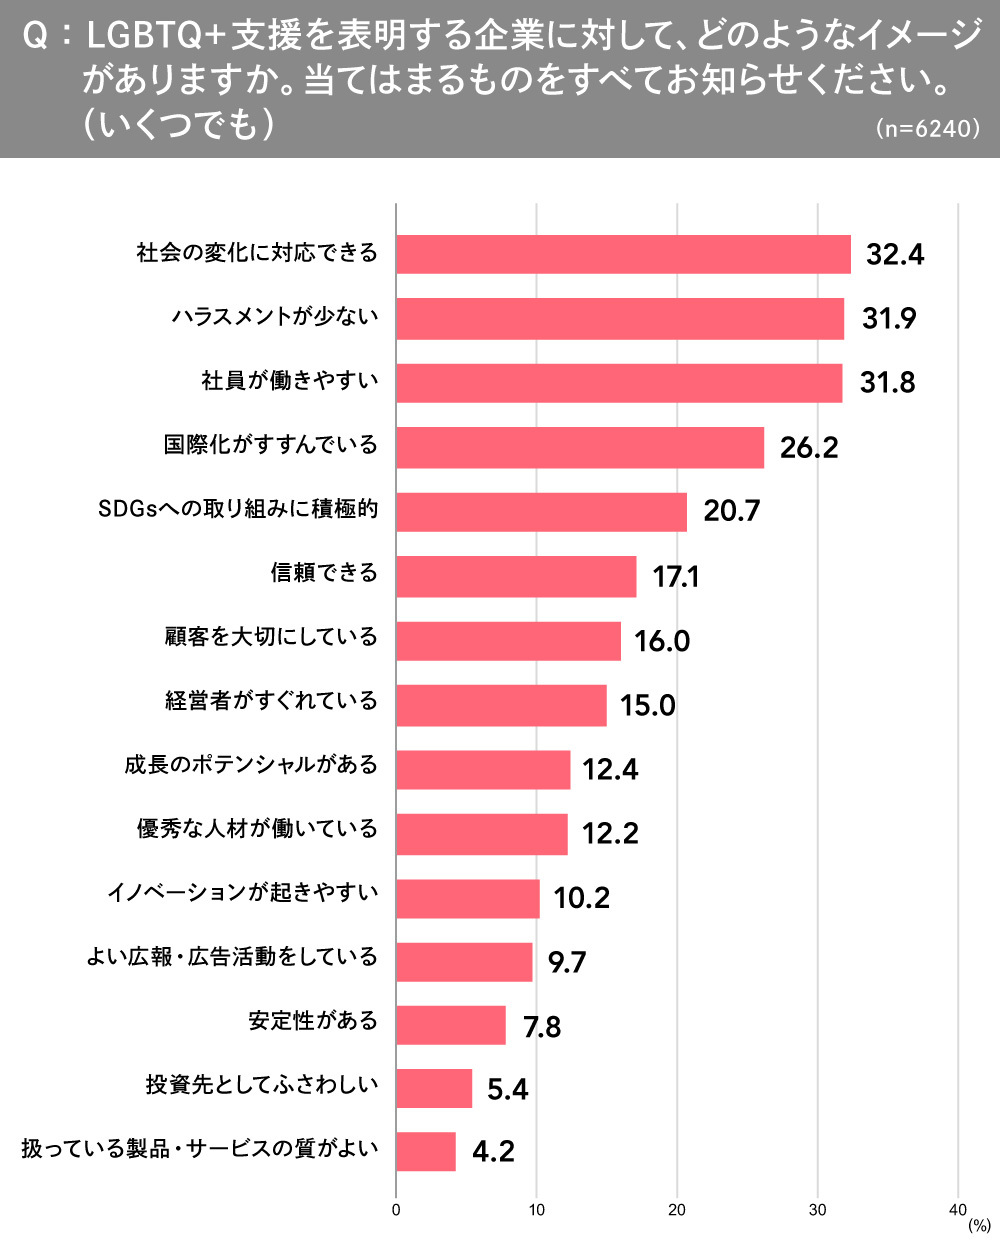
Furthermore, when asked about their image of "companies that publicly support LGBTQ+," the top responses were: "able to adapt to societal changes" (32.4%), "less harassment" (31.9%), and "a comfortable place for employees to work" (31.8%). These results suggest that LGBTQ+-friendly companies are viewed positively not only by LGBTQ+ individuals themselves but also by non-LGBTQ+ individuals.
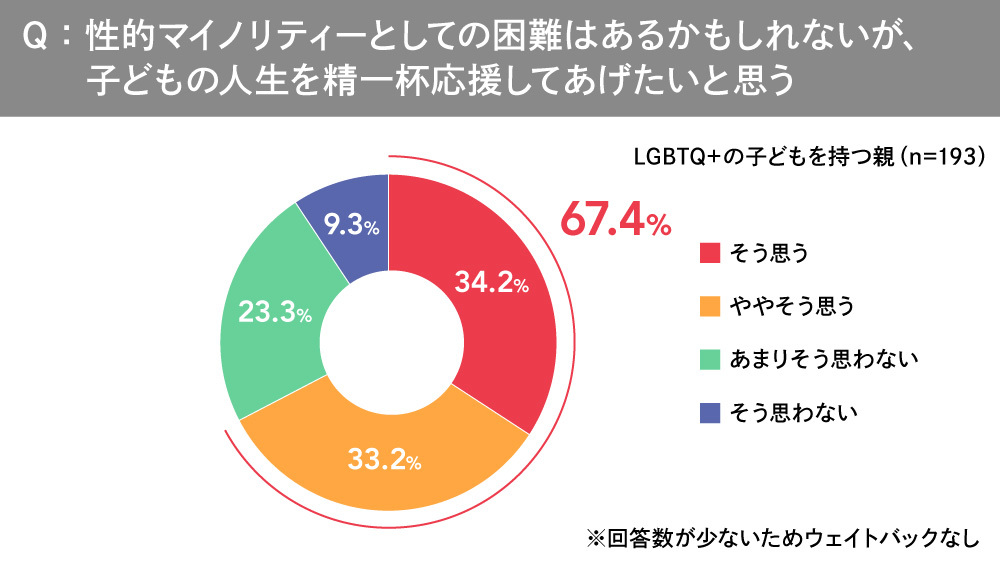
Approximately 70% of parents with LGBTQ+ children responded that they "want to support their child's life"
The 2023 survey included questions for the first time specifically targeting parents of LGBTQ+ children and other sexual minorities.
When asked, "Despite potential difficulties as a sexual minority, do you feel you want to support your child's life to the fullest?", 67.4% responded "Yes" or "Somewhat yes." While roughly 70% of parents expressed a desire to support their child's life, the survey also revealed that about 30% do not fully accept their child's way of life.
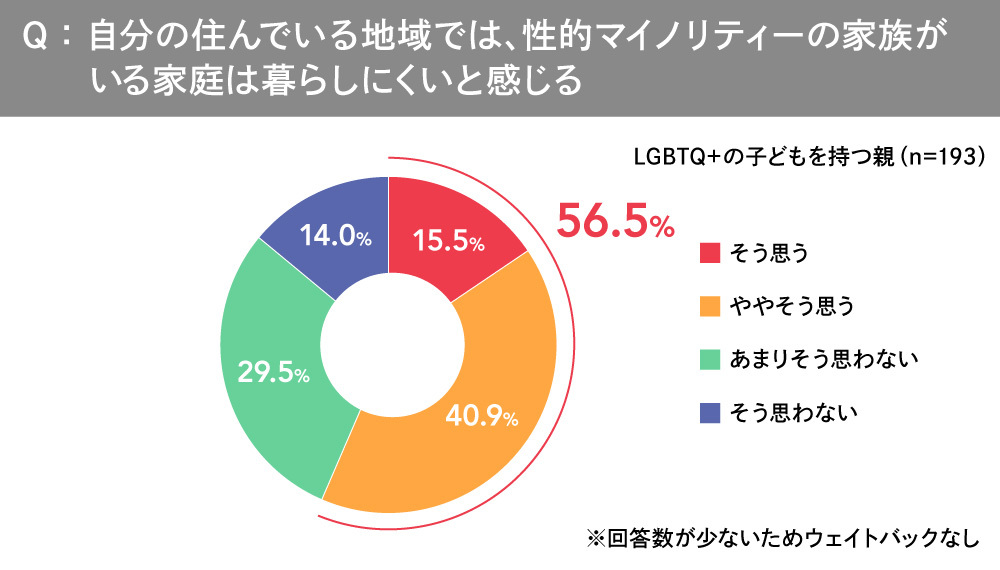
Furthermore, regarding the question "Do you feel that families with LGBTQ+ members find it difficult to live in your community?", 56.5% of respondents answered "Agree" or "Somewhat agree." This result suggests that parents of LGBTQ+ children may experience inconveniences or face challenges in their community life.
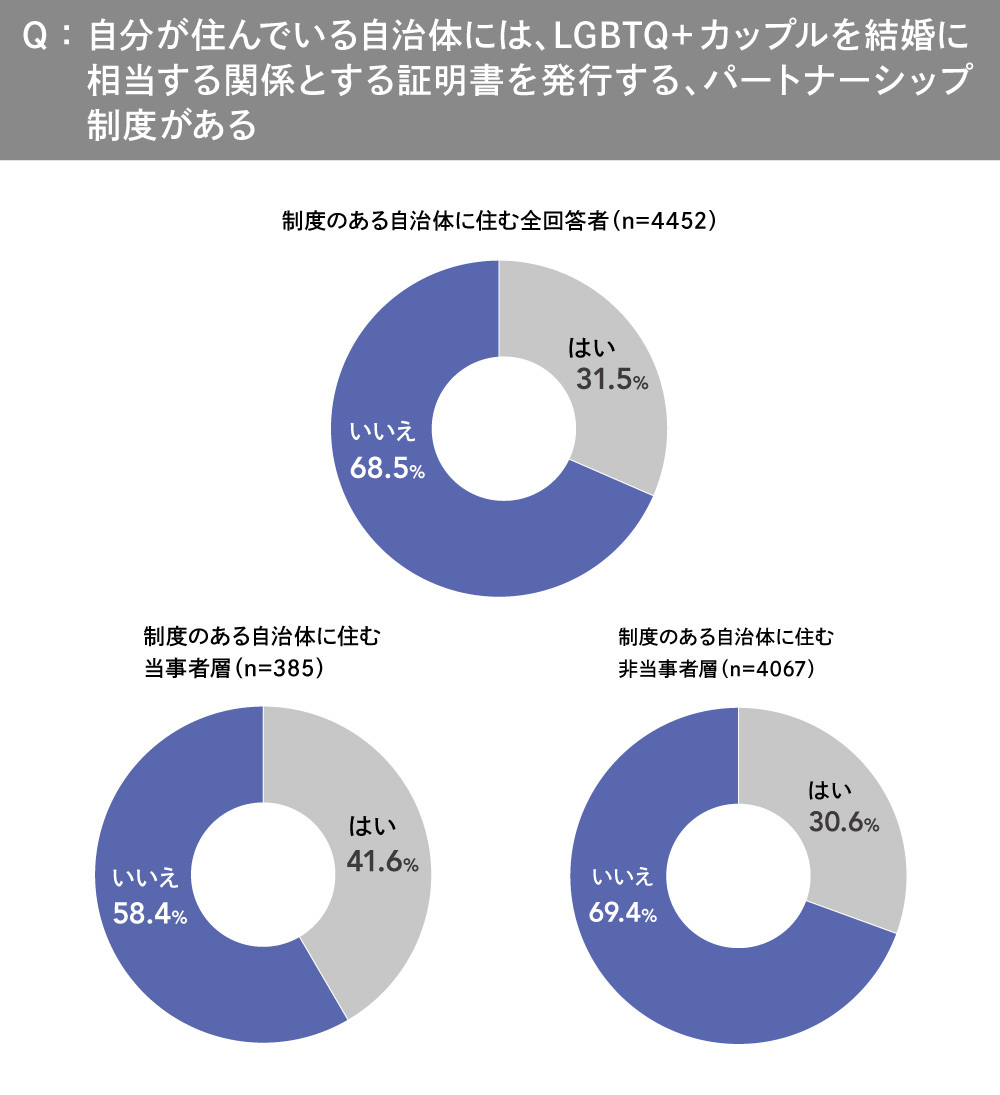
Partnership systems affect livability for affected groups, but awareness remains an issue
When asked whether they felt their local area was easy to live in, responses differed based on whether the municipality offered a "partnership system"—a certificate issued by local governments recognizing same-sex couples as equivalent to married couples. The percentage of respondents who felt their area was "very livable" or "fairly livable" was 65.0% among LGBTQ+ individuals living in municipalities with the system, compared to 56.5% among those living in municipalities without it, clearly showing a higher sense of livability in areas with the system.

However, awareness of the partnership system remains low. Among respondents living in municipalities with the system, 68.5% (58.4% of the LGBTQ+ community and 69.4% of non-LGBTQ+ individuals) were unaware of its existence.
While it should be noted that many municipalities have only recently introduced the partnership system, since municipalities with the system are expected to promote understanding among residents and businesses, awareness is desired regardless of whether one is an LGBTQ+ individual.
In addition to the five topics introduced in this article, the "LGBTQ+ Survey 2023" gathered insights on the attitudes and behaviors of both LGBTQ+ individuals and non-LGBTQ+ individuals across a wide range of themes, including communication in daily life, media, and needs regarding companies. Next time, we will introduce the content of the digital book "Things I've Always Wanted to Ask," created based on the survey results.
LGBTQ+ Survey 2023 "Things I've Always Wanted to Ask" eBook Download Here
[Survey Overview]
Survey Name: "Dentsu Inc. LGBTQ+ Survey 2023"
Conducted by: dJ Sustainability Promotion Office
Survey Cooperation: Dentsu Inc. Diversity Lab
<Screening Survey>
Survey Participants: 57,500 individuals aged 20–59
Survey Area: Nationwide
Survey Period: June 14–19, 2023
Survey Method: Internet survey
<Main Survey>
Survey Participants: 6,240 individuals aged 20–59 (600 LGBTQ+ individuals / 5,640 non-LGBTQ+ individuals)
Survey Area: Nationwide
Survey Period: June 14–19, 2023
Survey Method: Online survey
*Weighting was applied by prefecture, gender, and age group (20s–30s / 40s–50s) to align with the proportion of LGBTQ+ individuals and the overall population composition.
*Percentage figures are rounded to the nearest hundredth, so totals may not always add up to 100%.

Was this article helpful?
Share this article
Newsletter registration is here
We select and publish important news every day
For inquiries about this article
Author
Sayuri Nakagawa
After joining Dentsu Inc., worked as a copywriter in the Creative Bureau handling clients in food, apparel, cosmetics, and other sectors. Following graduate studies in the UK, joined Dentsu Diversity Lab in 2017. Led projects on gender and sexuality, including the "LGBTQ+ Survey." Left Dentsu Inc. at the end of September 2024.
Kahori Kishimoto
Dentsu Inc.
Marketing Division 3
Strategist
Born in Tokushima Prefecture. Researcher at Dentsu Inc. Diversity Lab. Deputy Editor-in-Chief of web magazine "cococolor." Engaged in strategy development and planning across diverse industries including beverages, food, film, and information services. Recipient of awards including the "15th Japan Marketing Grand Prix," "PR Award Grand Prix 2022 Silver," and "2020 Transportation Advertising Grand Prix Station Media Category Excellence Award."