Note: This website was automatically translated, so some terms or nuances may not be completely accurate.
 LGBTQ+ Survey 2026 [1/1]
LGBTQ+ 2026 Survey—The Key to Moving Beyond “Thinking You Understand” Is Realistic Imagination
Since conducting Japan’s first large-scale survey on LGBTQ+ issues in 2012, Dentsu Inc. has continued to conduct these surveys for over 10 years. The “LGBTQ+ Survey 2026” (*), now in its sixth iteration, analyzed not only the attitudes and experiences of LGBTQ+ individuals but also the attitudes, knowledge, and behaviors of non-LGBTQ+ individuals, just as in the previous survey.
In this series, we will analyze the latest survey results from various perspectives. In this first installment, we introduce the key topics from the “LGBTQ+ Survey 2026.”
*The survey was conducted primarily by the dentsu Japan DEI Office—an organization within dentsu Japan, part of the Dentsu Group—in collaboration with dentsu DEI innovations, which conducts research and provides solutions for diversity, equity, and inclusion (DEI) issues.
<Table of Contents>
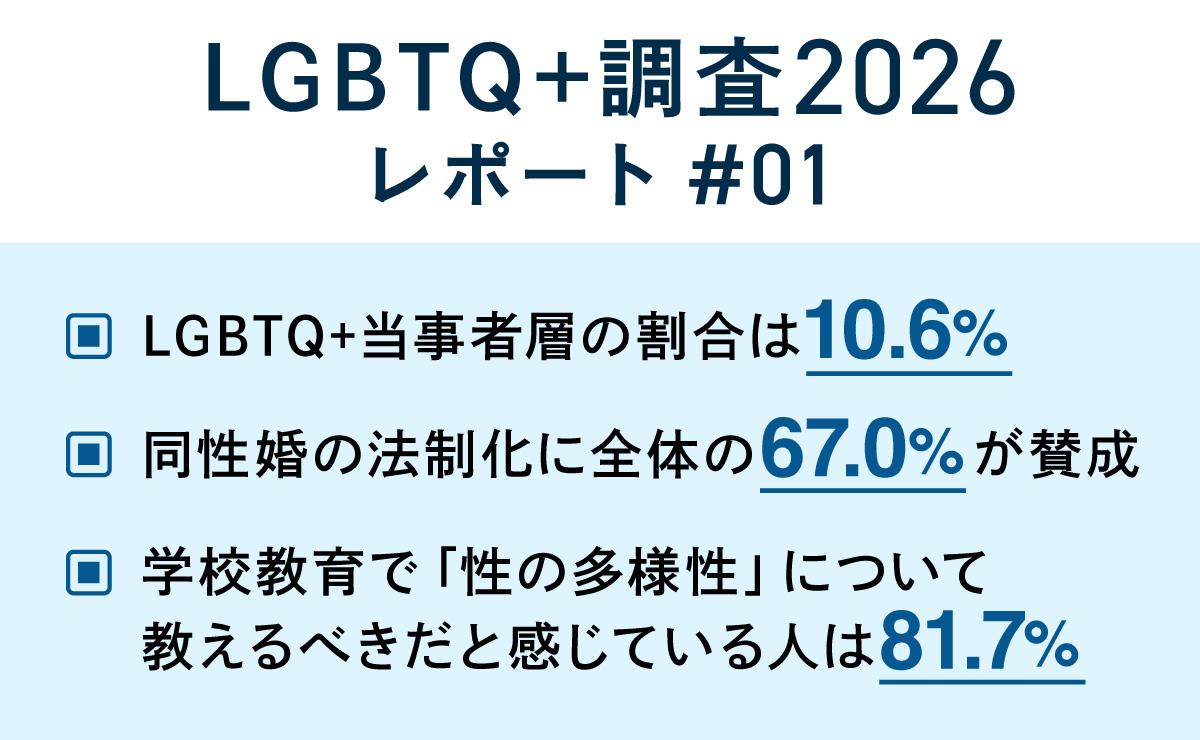
▼10.6% of the population identifies as LGBTQ+
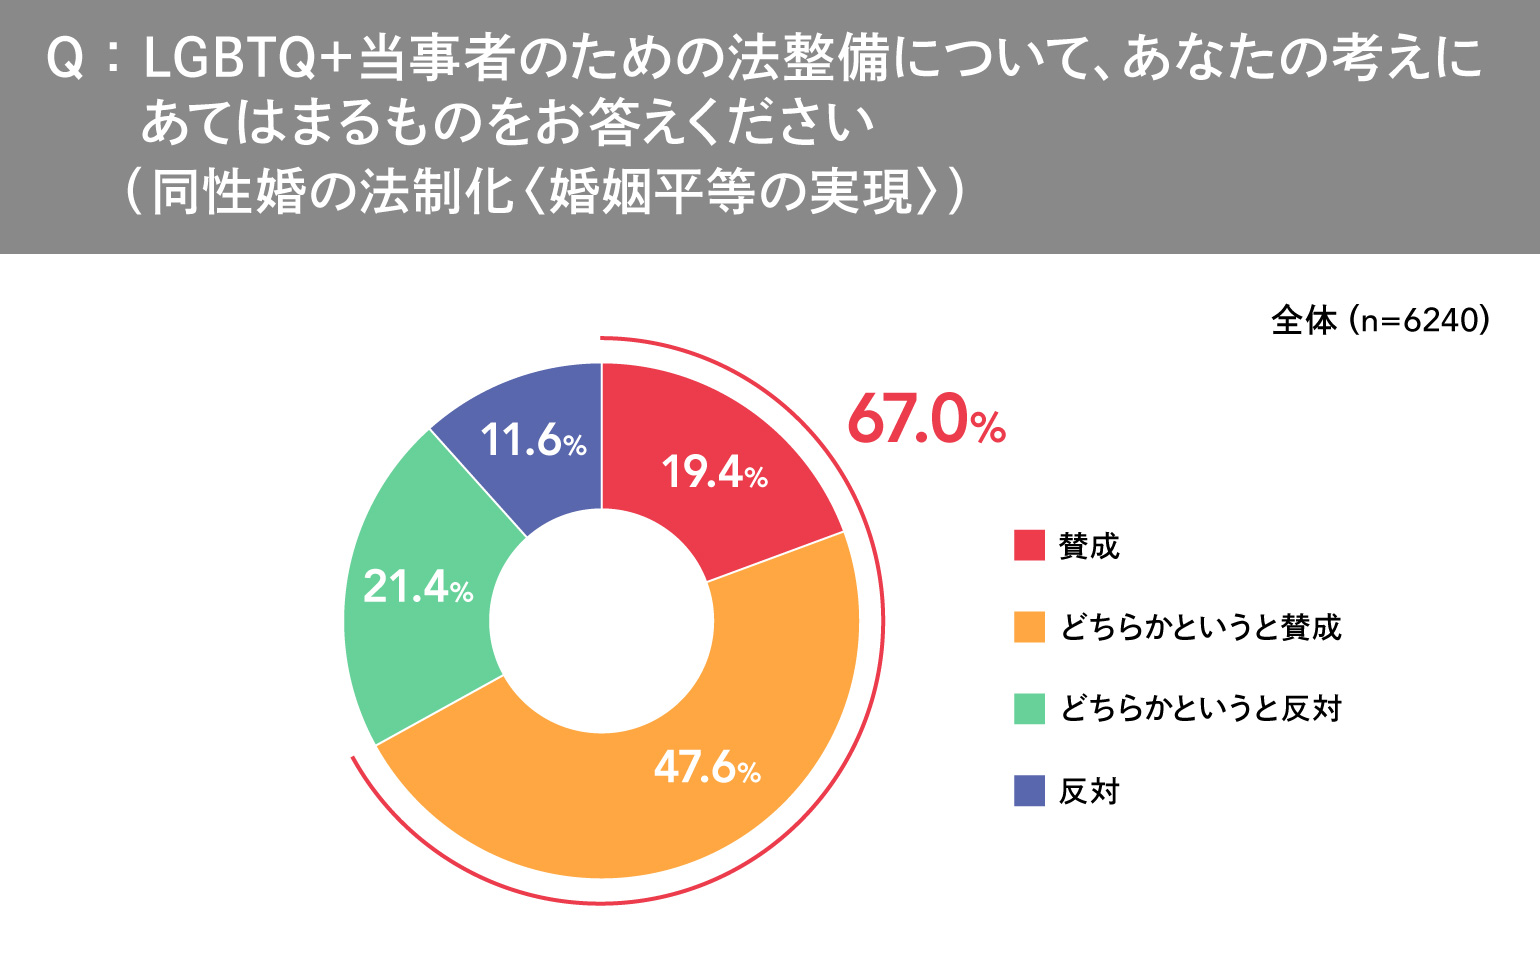
▼67.0% of respondents support the legalization of same-sex marriage
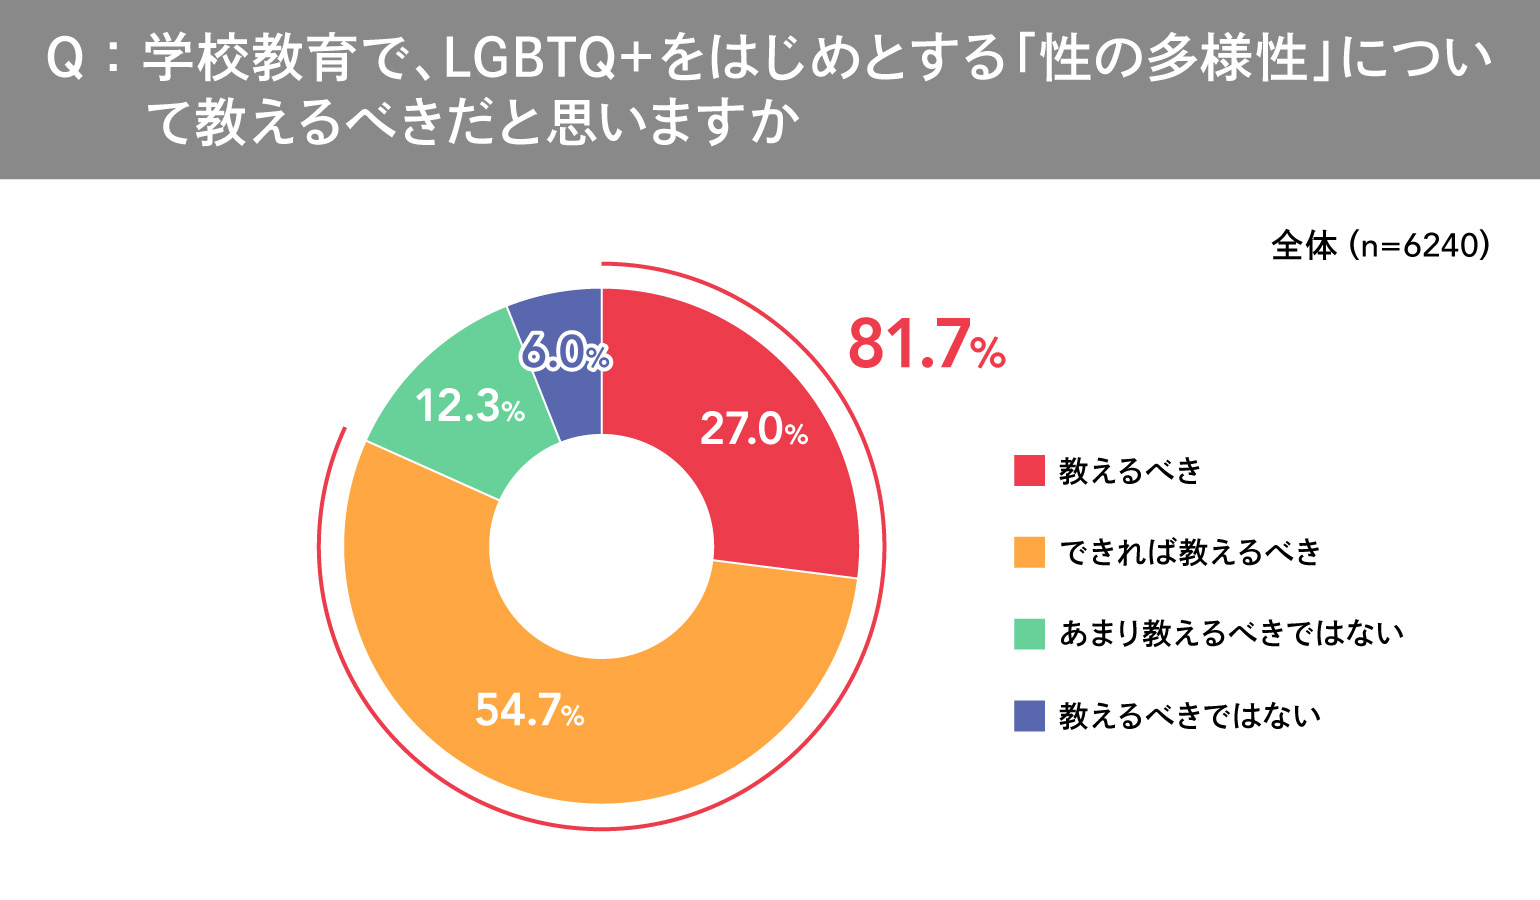
▼81.7% Believe “Sexual Diversity” Should Be Taught in Schools
▼Availability of LGBTQ+ Training Influences Inclusive Attitudes and Behavior
▼Imagining the Perspectives of LGBTQ+ Individuals Changes the Attitudes and Behavior of Non-LGBTQ+ Individuals
▼Top 3 Difficult Experiences Faced by LGBTQ+ Individuals: Anxiety About the End of Life and the Future Also Rank High
▼A Gap Was Found in Perceptions of Barriers in Daily Life Between LGBTQ+ Individuals and Non-LGBTQ+ Individuals
The proportion of the LGBTQ+ community is 10.6%
In the “LGBTQ+ Survey 2026,” sexual orientation was classified based on a combination of the following three factors:
・Gender identity
・Sex assigned at birth
・Sexual orientation (toward whom romantic or sexual feelings are directed)
Based on responses at the time of the survey, the “LGBTQ+ community” is defined as all respondents other than those who identified as heterosexual and whose gender assigned at birth matched their gender identity (cisgender).
A screening survey of 46,658 people aged 20 to 59 residing in Japan revealed that the proportion of the LGBTQ+ community among all respondents rose slightly to 10.6% from 9.7% in the 2023 survey.We analyze this as resulting from increased information regarding LGBTQ+ issues, which has led to greater self-awareness regarding gender identity and sexual orientation and made the actual situation more visible. However, recognizing that some respondents may still find it difficult to disclose their gender identity or sexual orientation even in an anonymous survey, and that perceptions of gender and sexuality can be fluid even within individuals, we believe it is necessary to continue closely monitoring trends in these figures.
We also calculated a breakdown based on the combinations of “gender identity × sex assigned at birth” and “gender identity × sexual orientation.” The results confirmed, as in the previous survey, that in addition to L (lesbian), G (gay), B (bisexual), and T (transgender), there are diverse gender identities included under the umbrella of “Q+.”
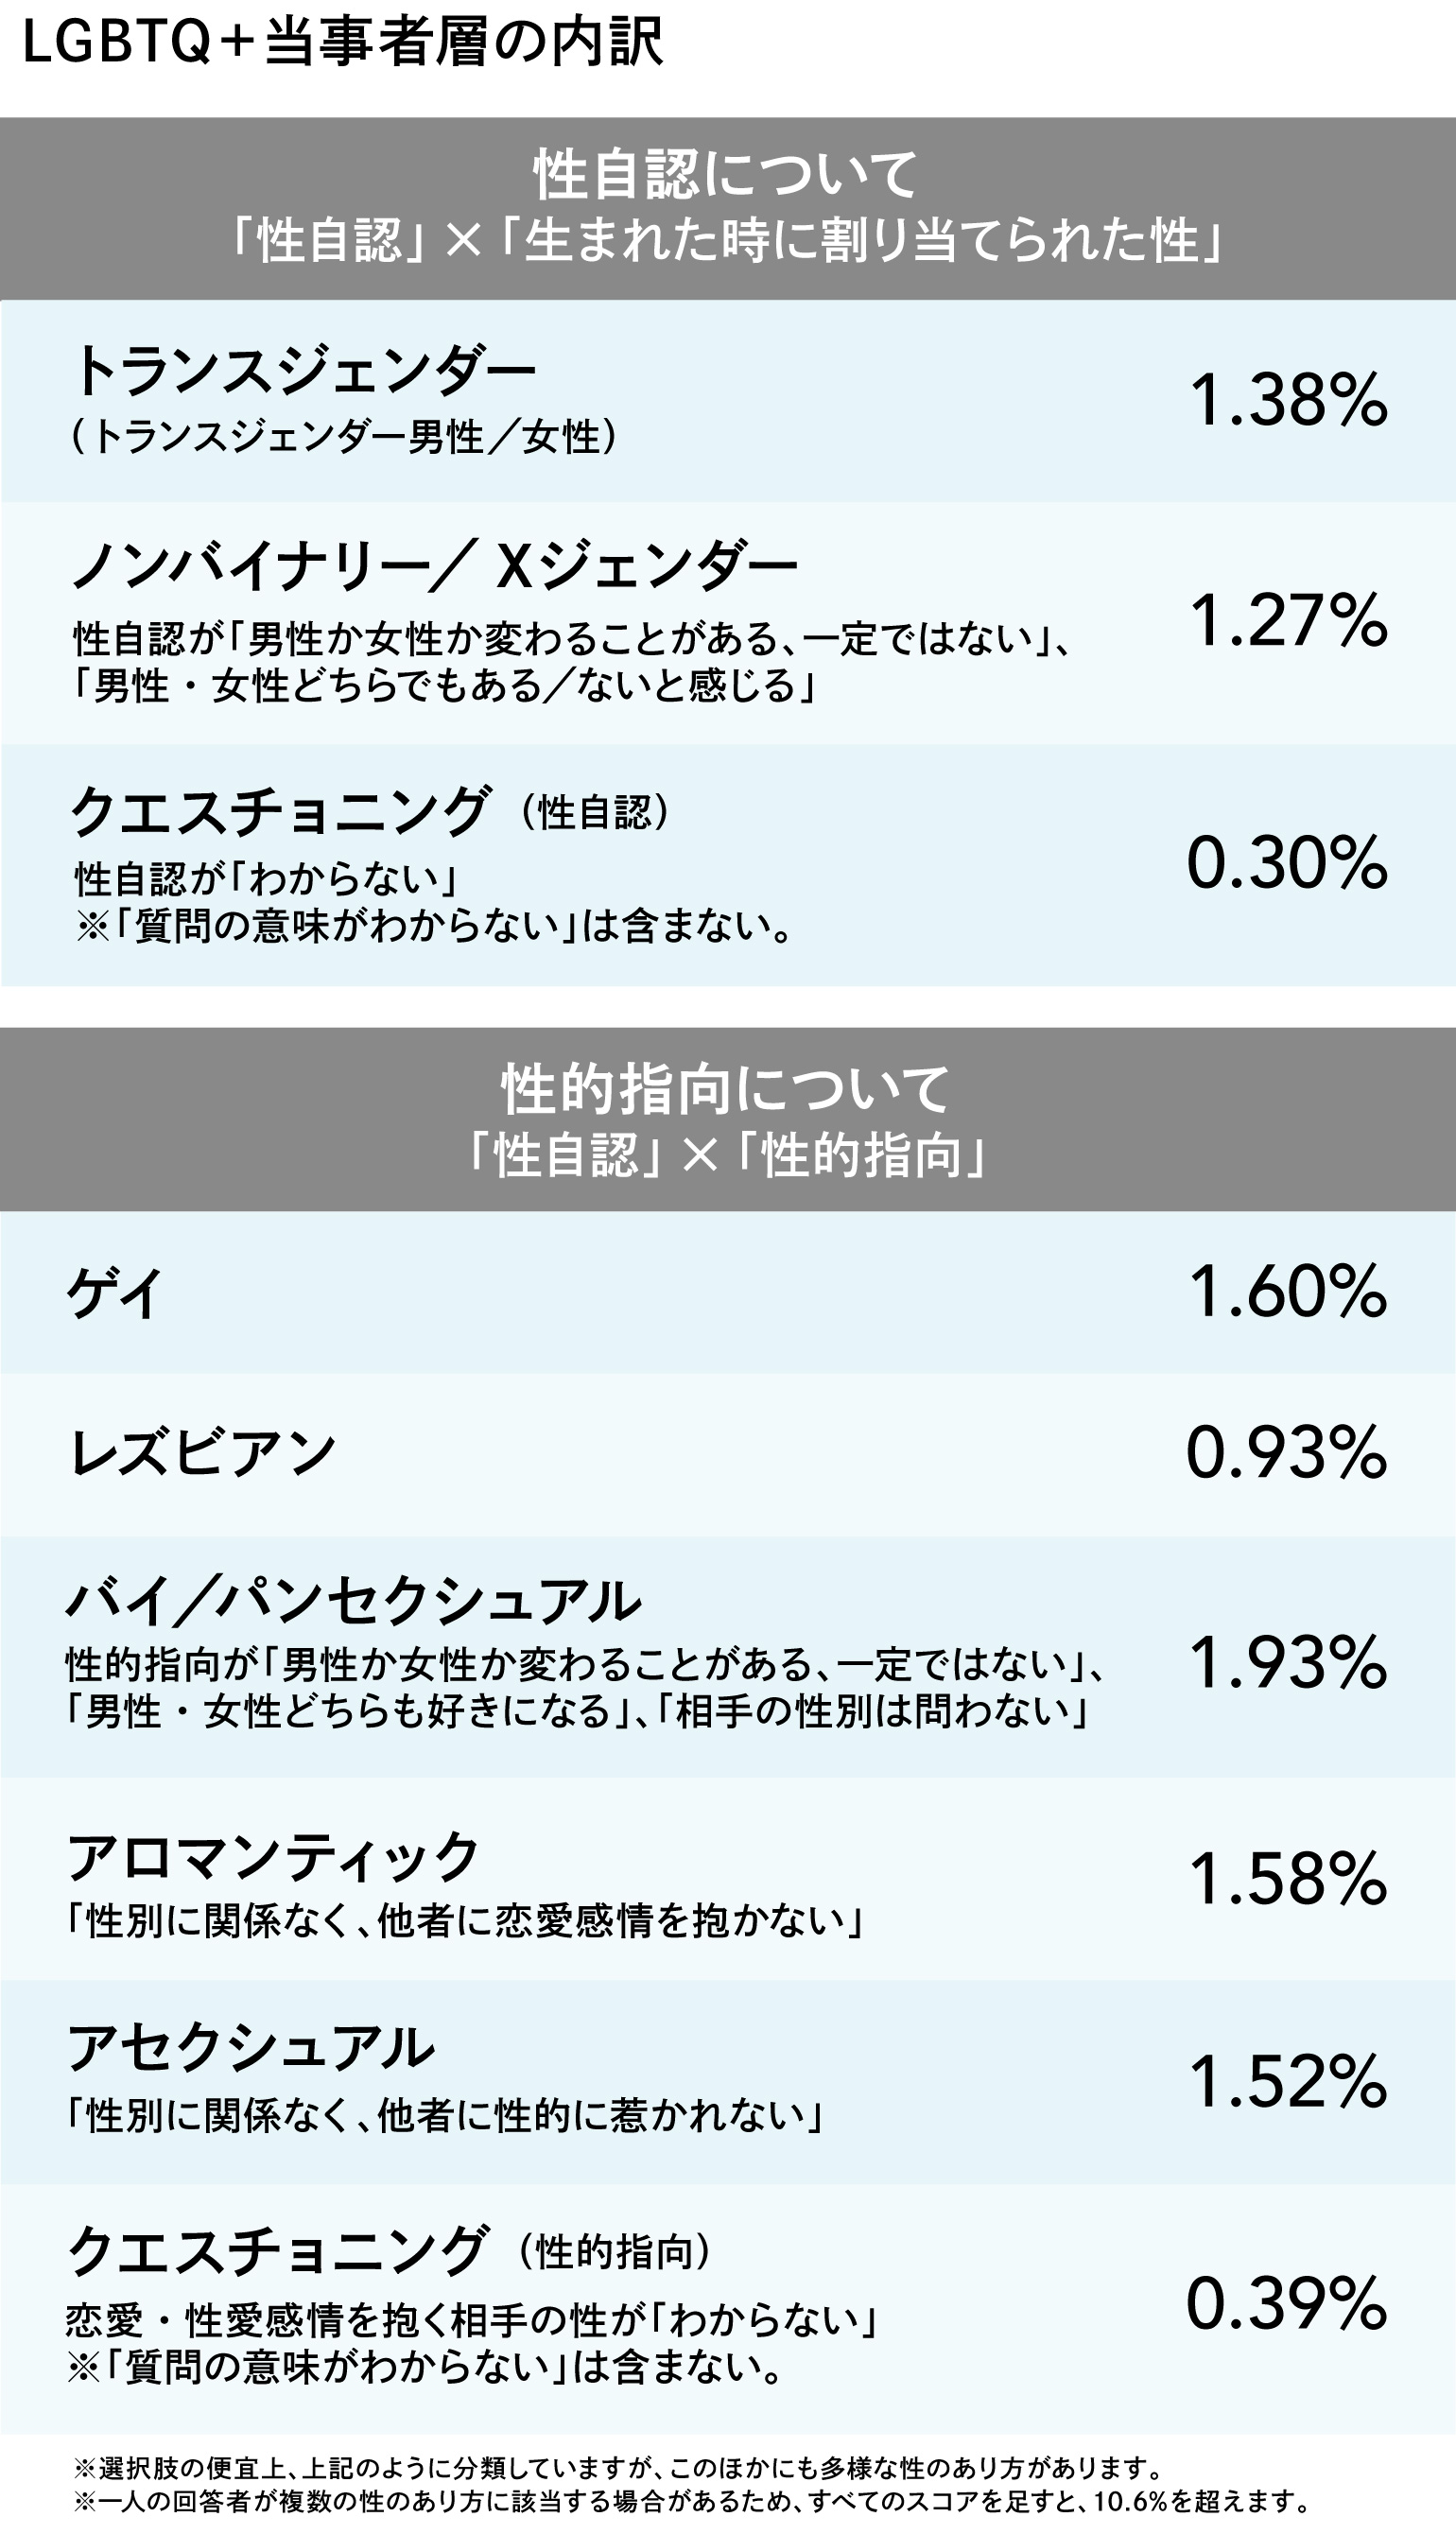
In the “Gender Identity × Sex Assigned at Birth” category, “Transgender” individuals—whose gender identity differs from the sex assigned at birth—accounted for 1.38%, while “Non-binary/X-gender” individuals—who feel their gender identity “varies between male and female and is not fixed” or “is both male and female or neither”—accounted for 1.27%.“Questioning,” where respondents indicated they “don’t know” their gender identity, accounted for 0.30%.
Furthermore, in the “Gender Identity × Sexual Orientation” category, in addition to “Gay” (1.60%) and “Lesbian” (0.93%), the largest proportion—1.93%—was “Bisexual/Pansexual,” which includes those who responded that their sexual orientation “varies between male and female and is not fixed,” “I am attracted to both men and women,” or “I am not selective about the gender of my partner.”
Furthermore, “aromantic” (1.58%), who do not experience romantic feelings toward others regardless of gender; “asexual” (1.52%), who do not experience sexual attraction toward others regardless of gender; and “questioning” (0.39%), who are unsure of their sexual orientation, were also identified.
Note that the total of all these percentages exceeds 10.6% because some respondents identify as “non-binary” and “asexual,” among other gender identities, meaning they fall into multiple categories.
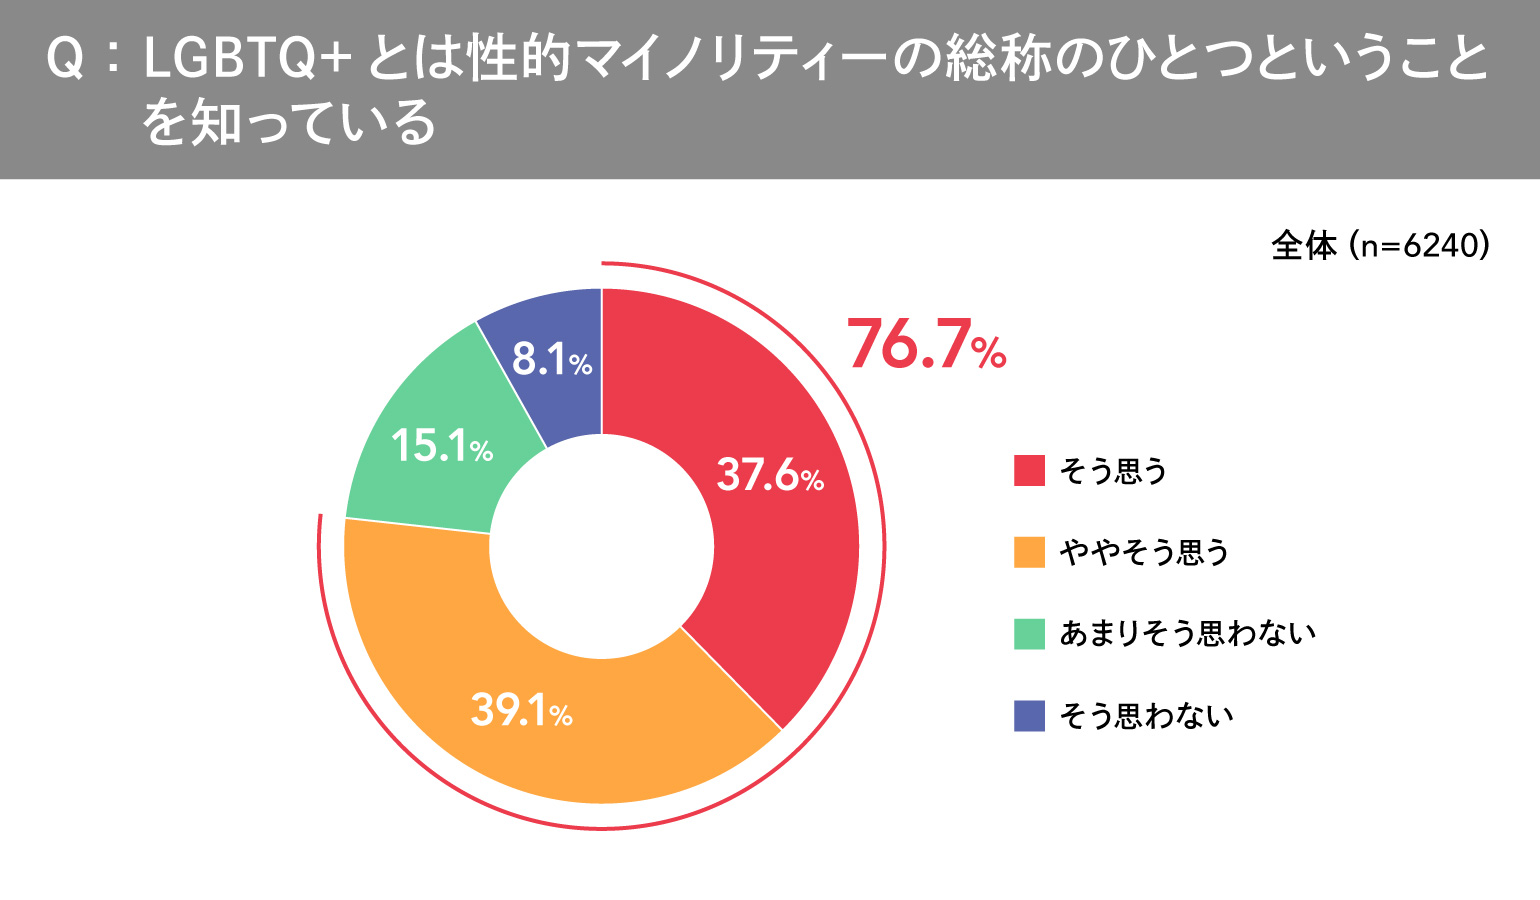
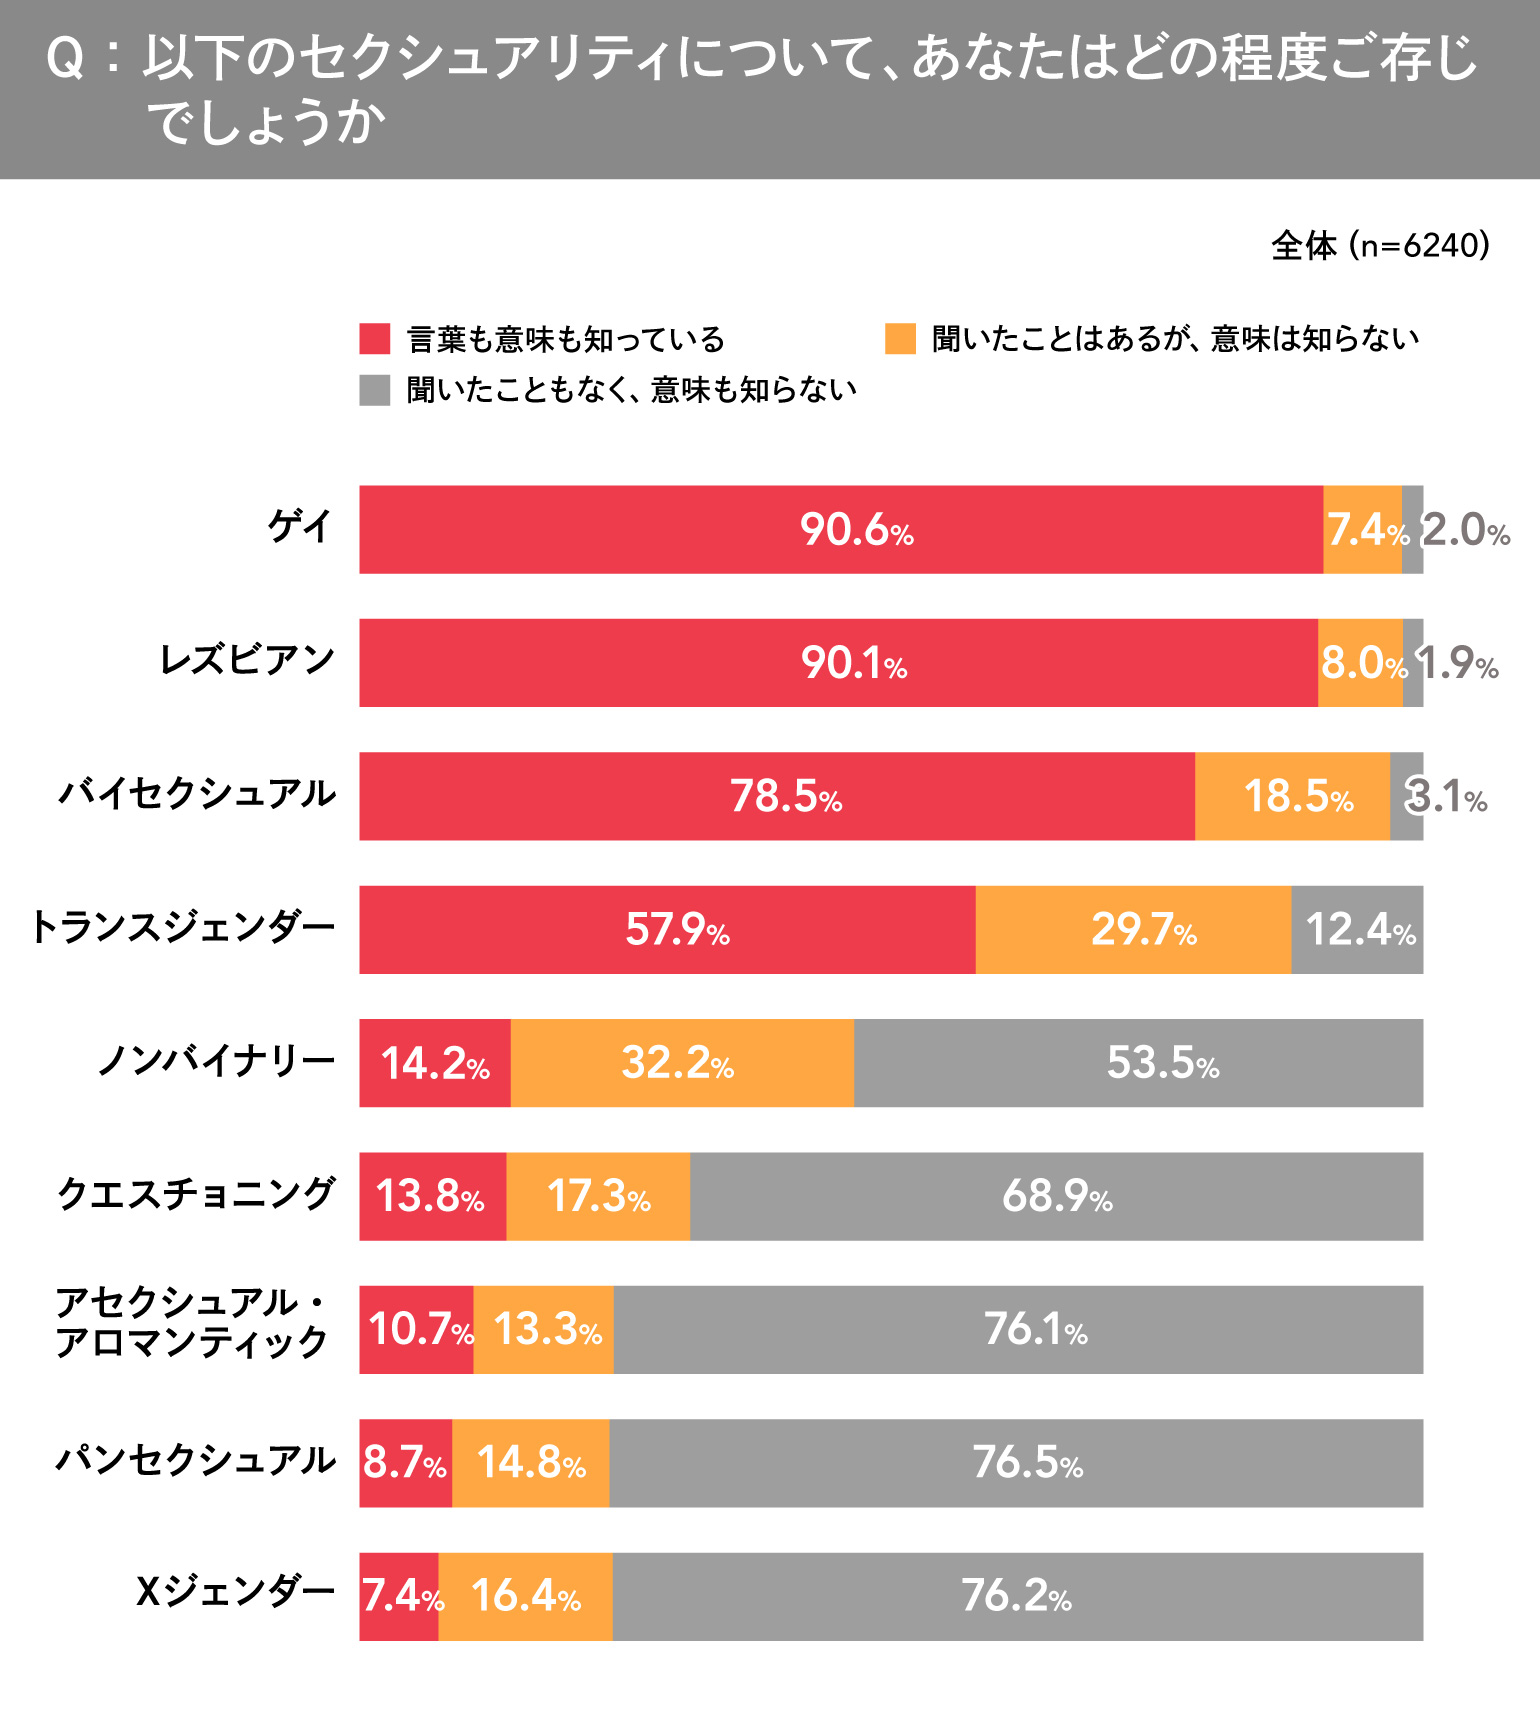
Furthermore, while awareness of the term “LGBTQ+” stands at a high level of 76.7%, there is a significant disparity in awareness of the terms for each specific identity: “G” (Gay) at 90.6%, and “A” (Asexual) and “A” (Aromantic) within the “Q+” category at 10.7%.
67.0% of the total population supports the legalization of same-sex marriage
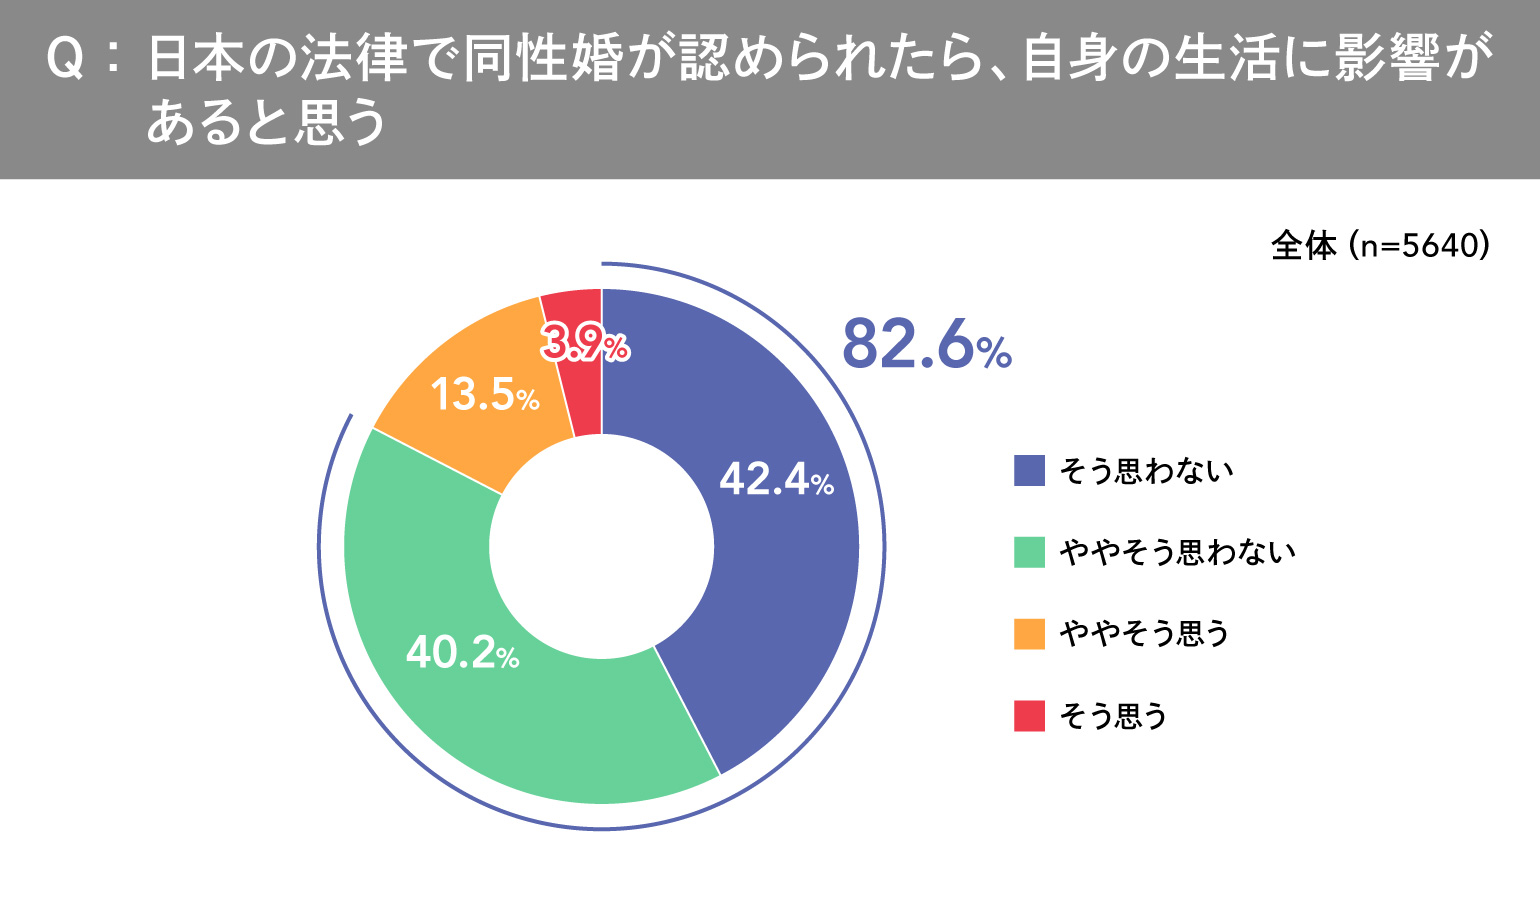
The percentage of people who support the legalization of same-sex marriage (achieving marriage equality)—including those who answered “in favor” or “somewhat in favor”—stood at 67.0%. Additionally, 82.6% of non-LGBTQ+ individuals (those who answered “disagree” or “somewhat disagree”) believe that even if same-sex marriage were recognized in Japan, it would not affect their own lives.
Some people say, “I don’t see the need for same-sex marriage—isn’t a civil partnership system sufficient?”However, in reality, there are indeed people who face difficulties—such as anxiety and disadvantages—because their relationships with their partners are not legally recognized. Given this situation, it is important not only to debate the merits of the system but also to focus on “what kinds of difficulties arise in what situations” and deepen our understanding. To that end, making these often-hidden difficulties visible through the concrete experiences and voices of those directly affected is believed to lead to broader social understanding in the future.
81.7% of People Believe “Sexual Diversity” Should Be Taught in Schools
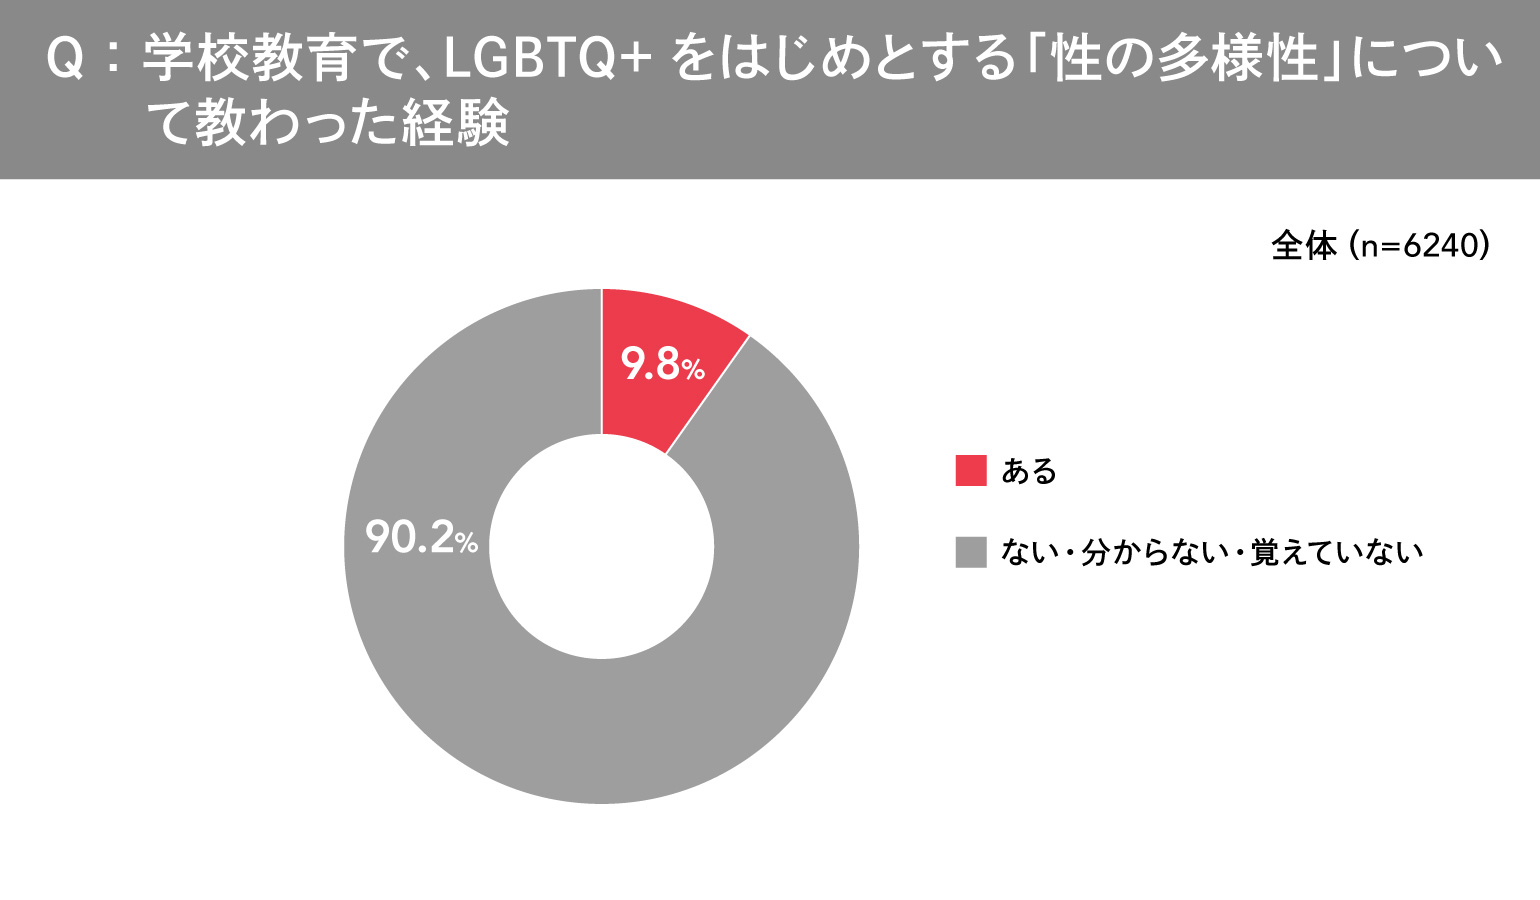
A total of 81.7% of respondents—including both those directly affected and those who are not—believe that “sexual diversity,” including LGBTQ+ issues, should be taught in schools. On the other hand, only 9.8% of respondents reported having been taught about LGBTQ+ issues in school. This suggests that, despite more than 80% of people believing that “LGBTQ+ issues should be taught in schools,” education on sexual diversity in schools remains very limited.
Whether or Not One Has Received LGBTQ+ Training Affects Inclusive Attitudes and Behavior
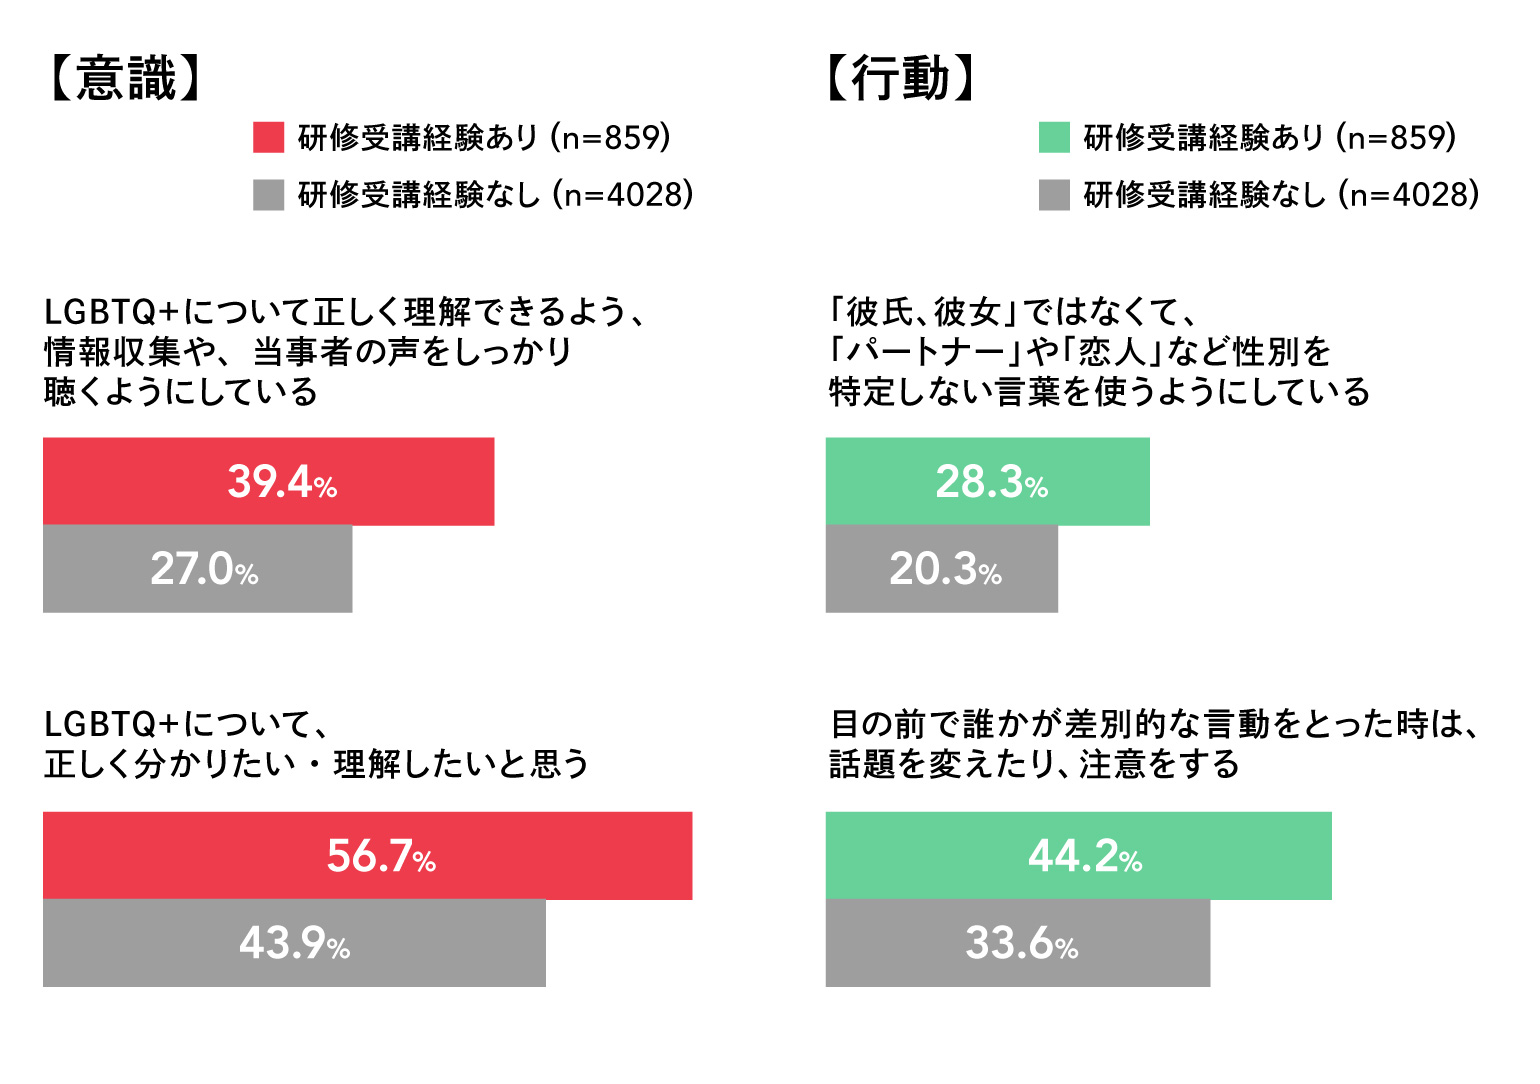
The survey revealed significant differences in attitudes and behaviors depending on whether or not respondents had received LGBTQ+ training. Among those who had received LGBTQ+ training at their company, 56.7% (combined total of “I agree” and “I somewhat agree”) stated that in their daily lives they “want to correctly understand and learn about LGBTQ+ issues”— a figure 12.8 percentage points higher than among those who had not received training (43.9%).Furthermore, 44.2% of those who had received training (combined “Agree” and “Somewhat agree” responses) said they would “change the subject or speak up” if they witnessed someone engaging in discriminatory speech or behavior right in front of them, which is 10.6 percentage points higher than the group that had not received training (33.6%).
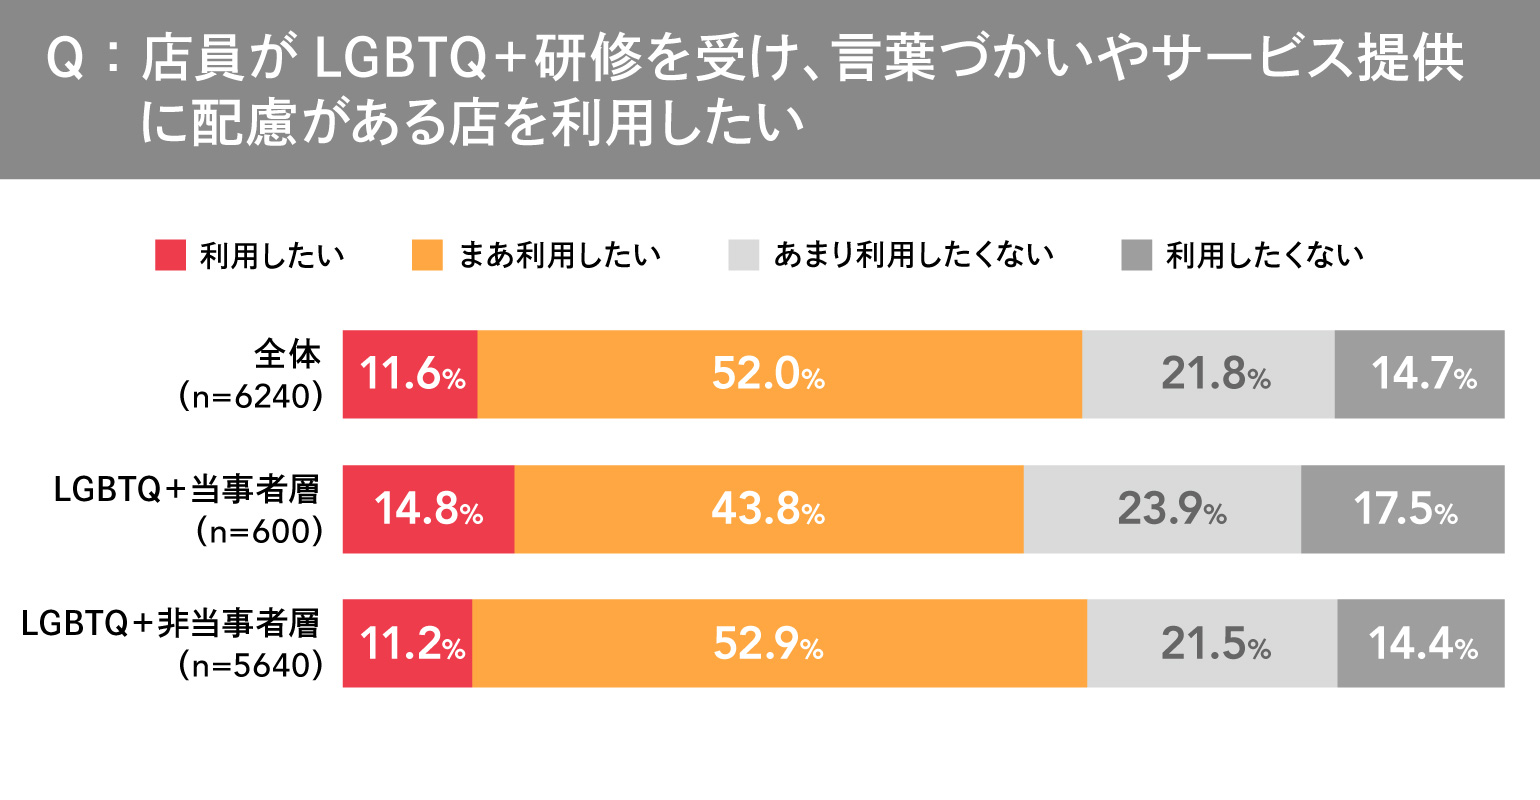
Furthermore, 63.5% of respondents (combined total of “Yes” and “Somewhat”) stated they would like to patronize stores where staff have undergone LGBTQ+ training and are mindful of their language and service.The score was higher among non-LGBTQ+ individuals (64.1%) than among LGBTQ+ individuals (58.6%), suggesting that consideration and initiatives regarding LGBTQ+ issues are recognized as valuable factors not only by LGBTQ+ individuals but also by non-LGBTQ+ individuals.
Furthermore, past surveys have shown that such initiatives go beyond being mere compliance measures; they also have secondary effects that lead to positive impressions, such as “the ability to adapt to social changes” and “a comfortable work environment for employees.” These initiatives are considered important factors that contribute to improving the image of companies and brands, which in turn leads to increased peace of mind and satisfaction among all customers.
Imagining LGBTQ+ Individuals Leads to Changes in the Awareness and Behavior of Non-LGBTQ+ Individuals
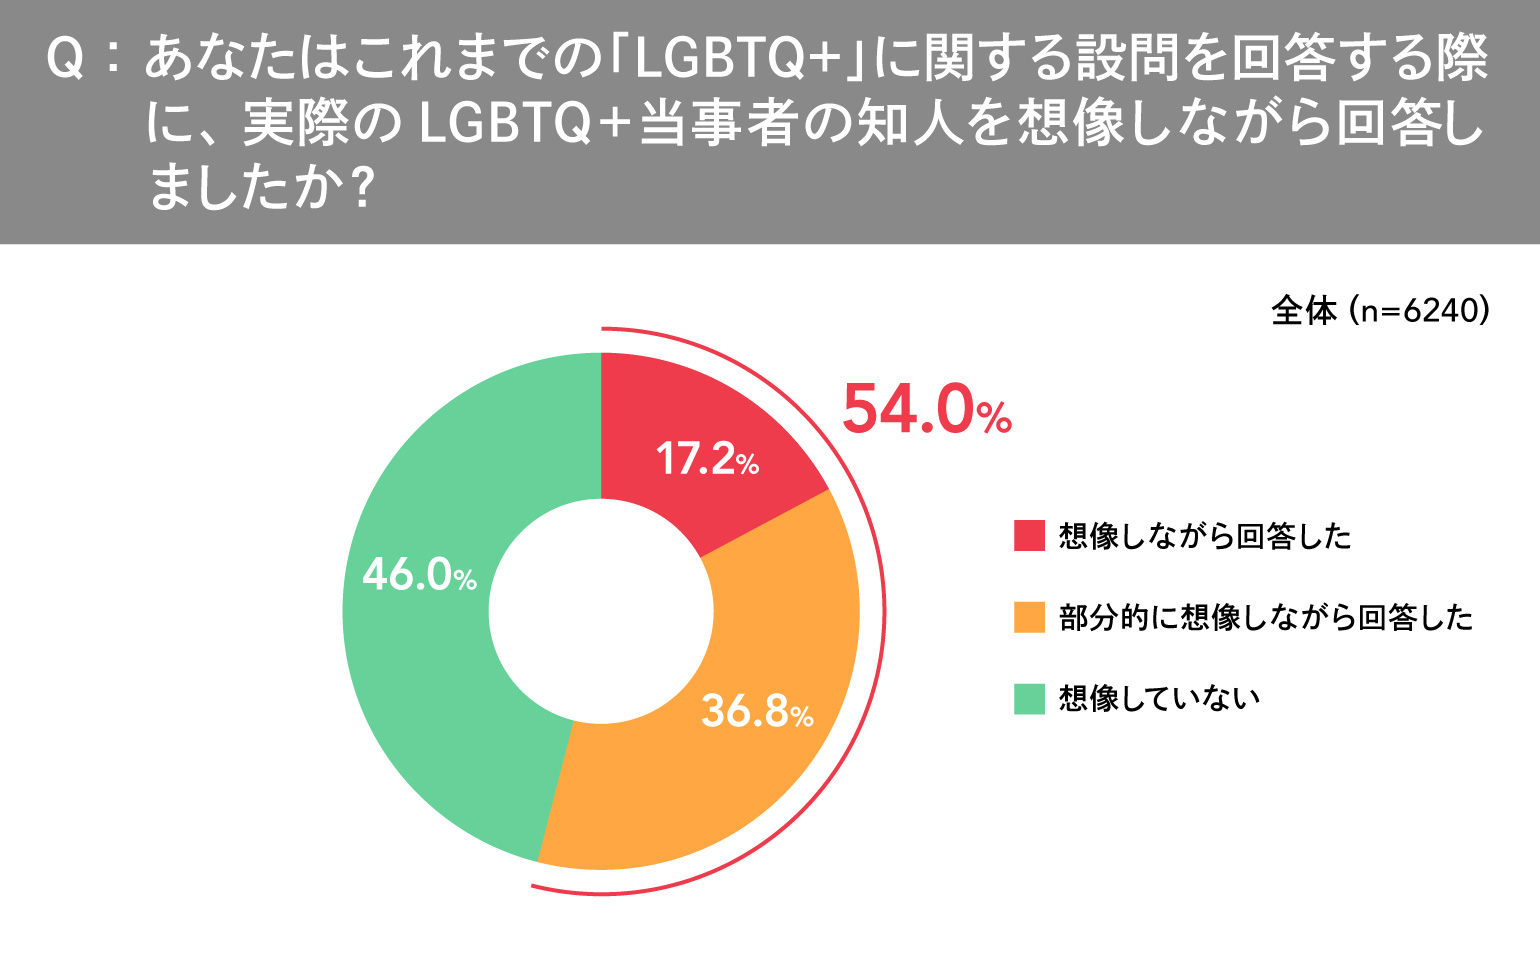
In this survey, we asked, “When answering questions related to LGBTQ+, did you imagine an actual person you know who is part of the LGBTQ+ community?” The results showed that 17.2% answered “I answered while imagining such a person,” and 36.8% answered “I answered while partially imagining such a person,” for a total of 54.0%, revealing that a majority of respondents answered while picturing a person from the LGBTQ+ community.On the other hand, 46.0% of respondents answered that they “did not imagine anyone.”
So, how does actually “answering while imagining a person from the LGBTQ+ community” affect the scores?
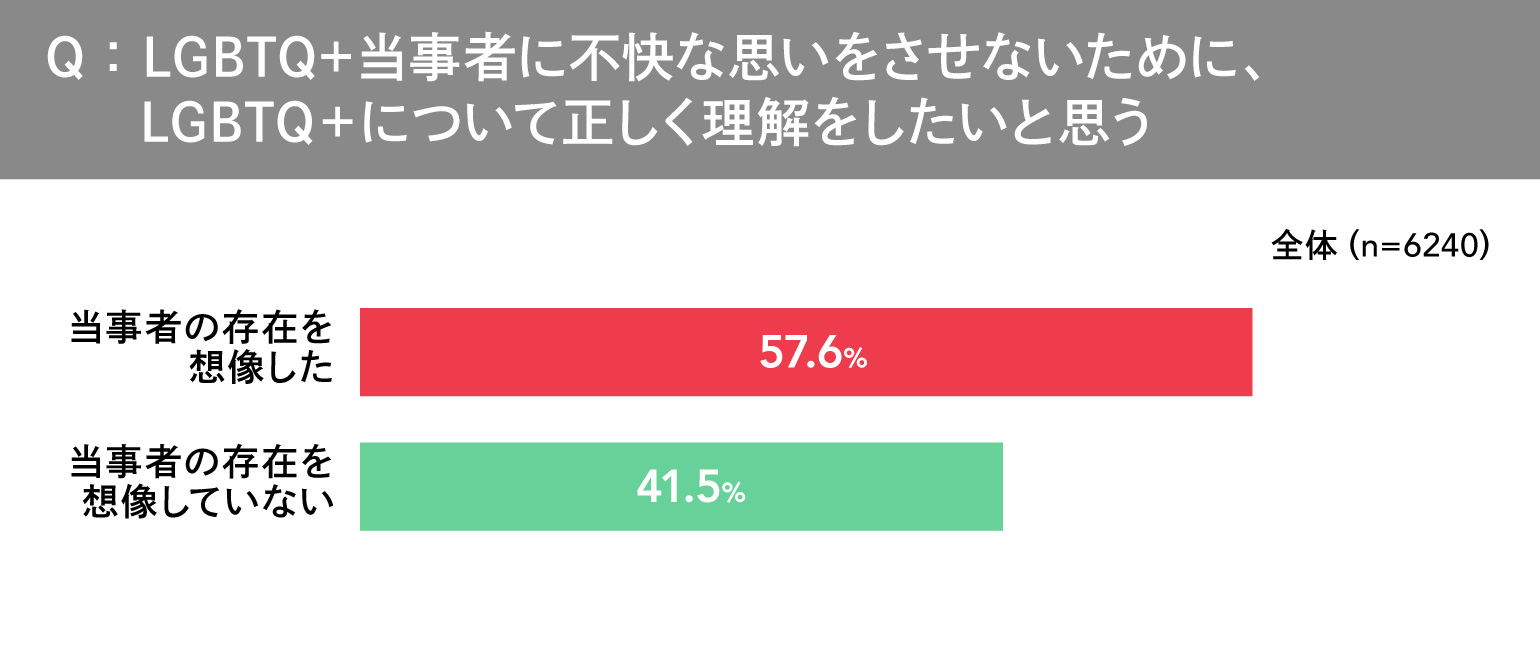
First, regarding the sentiment that “I want to understand LGBTQ+ issues correctly so as not to cause discomfort to members of the community,” there was a 16.1-point difference between those who visualized a member of the community while answering the survey (57.6%) and those who did not (41.5%).
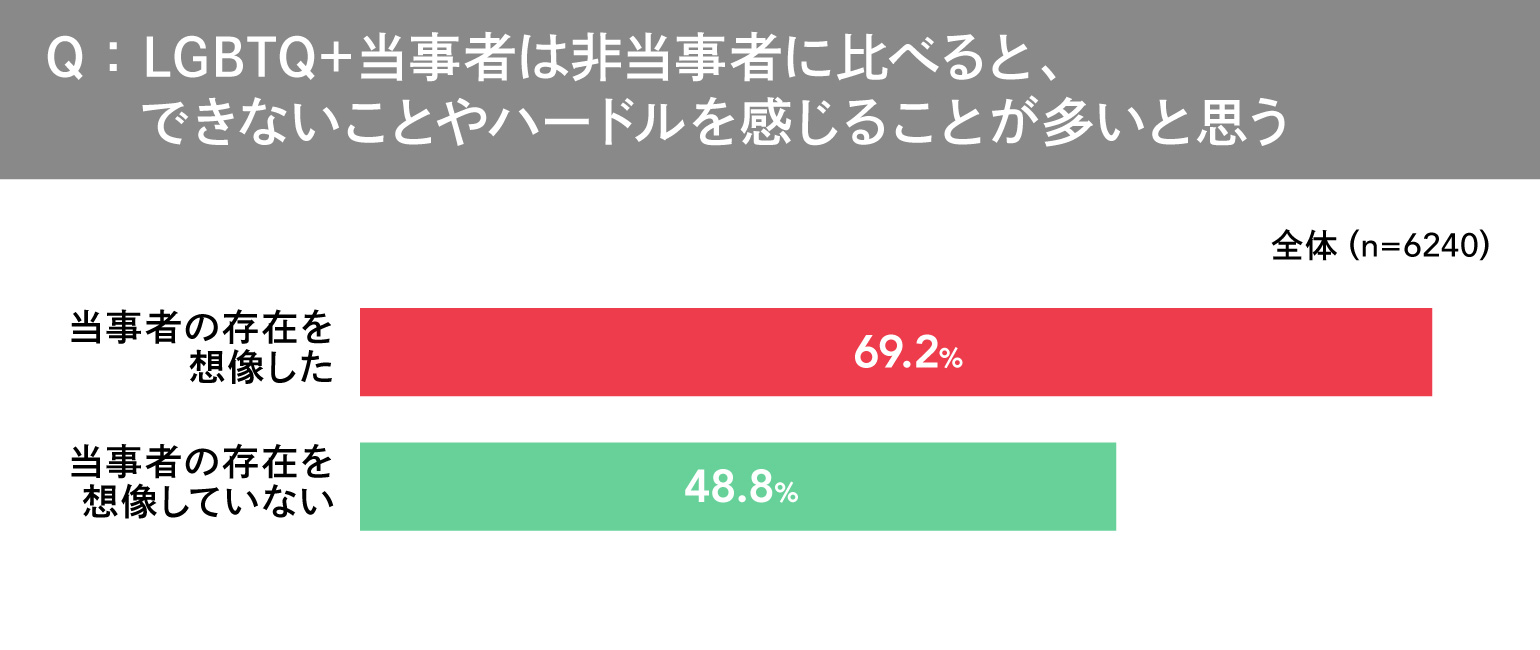
Furthermore, regarding the perception that “LGBTQ+ individuals face more limitations and obstacles than non-LGBTQ+ individuals,” there was a 20.4-point difference between those who visualized a specific person (69.2%) and those who did not (48.8%).
This suggests that picturing a specific person fosters a proactive attitude of “wanting to understand correctly” and deepens understanding of the invisible inconveniences and barriers present in daily life.
In other words, the act of “imagining while picturing a specific person” may go beyond mere possession of knowledge; it may also influence the depth of understanding of the issues, the level of empathy, and even the recognition of the need for social action.This survey reveals that the key factors behind differences in attitudes toward LGBTQ+ issues are not merely “whether or not one is aware of the topic,” but also “whether one can imagine a specific person,” and furthermore, “whether one can consider matters from the perspective of someone different from oneself and imagine that person’s feelings.”
Top 3 Difficult Experiences Reported by LGBTQ+ Individuals: Anxiety About the End of Life and the Future Also Ranks High
Among the comments submitted regarding experiences that individuals felt were difficult or left them feeling unsettled, “relationships with family and relatives” ranked first, “school and education” second, and “anxiety about the end of life and the future (end-of-life planning)” third.
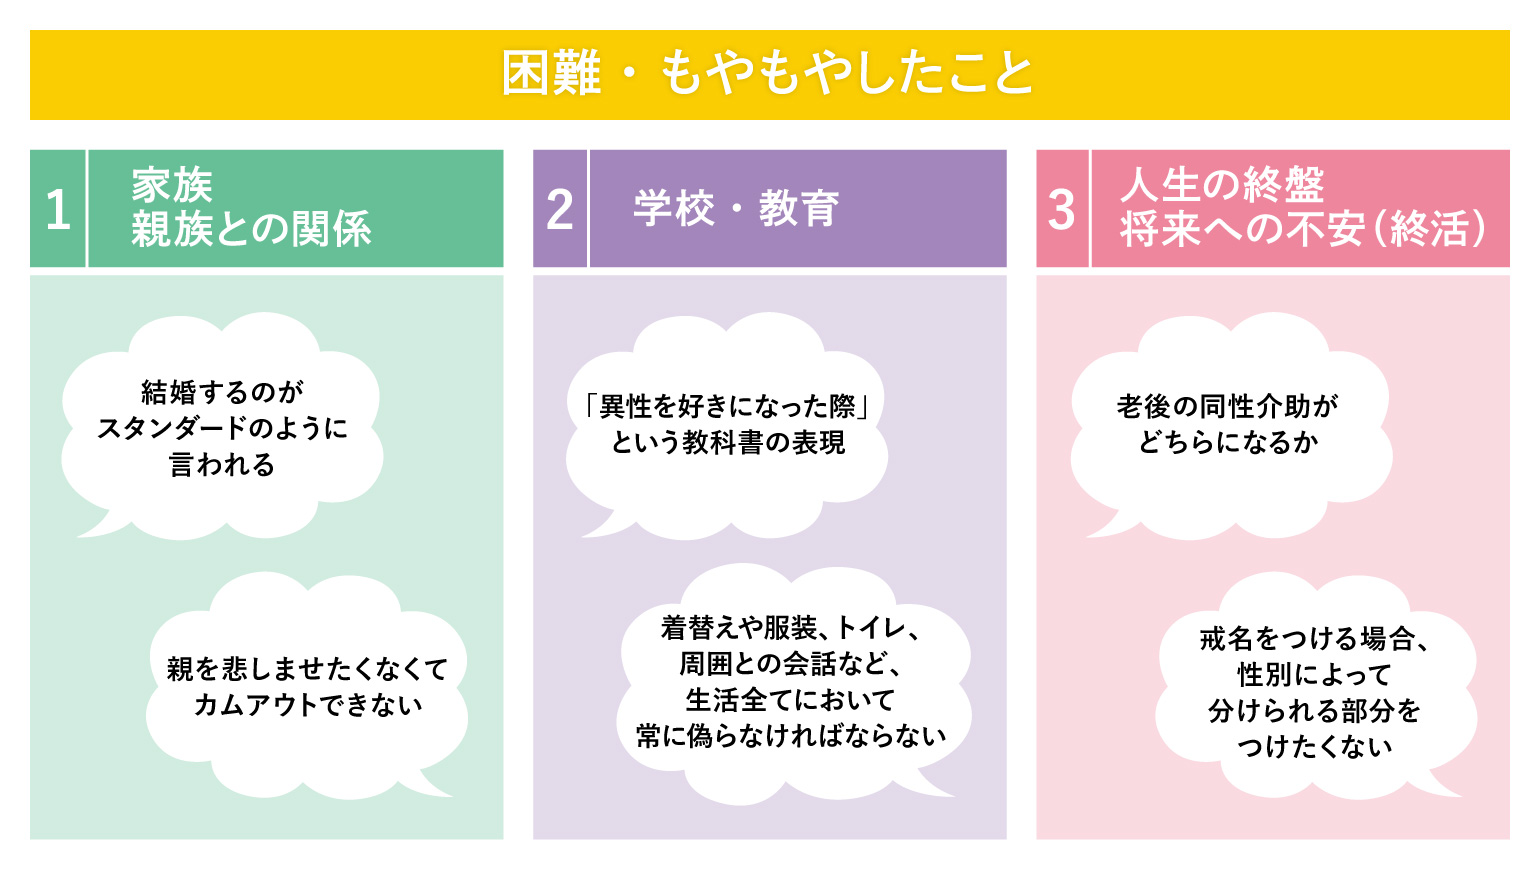
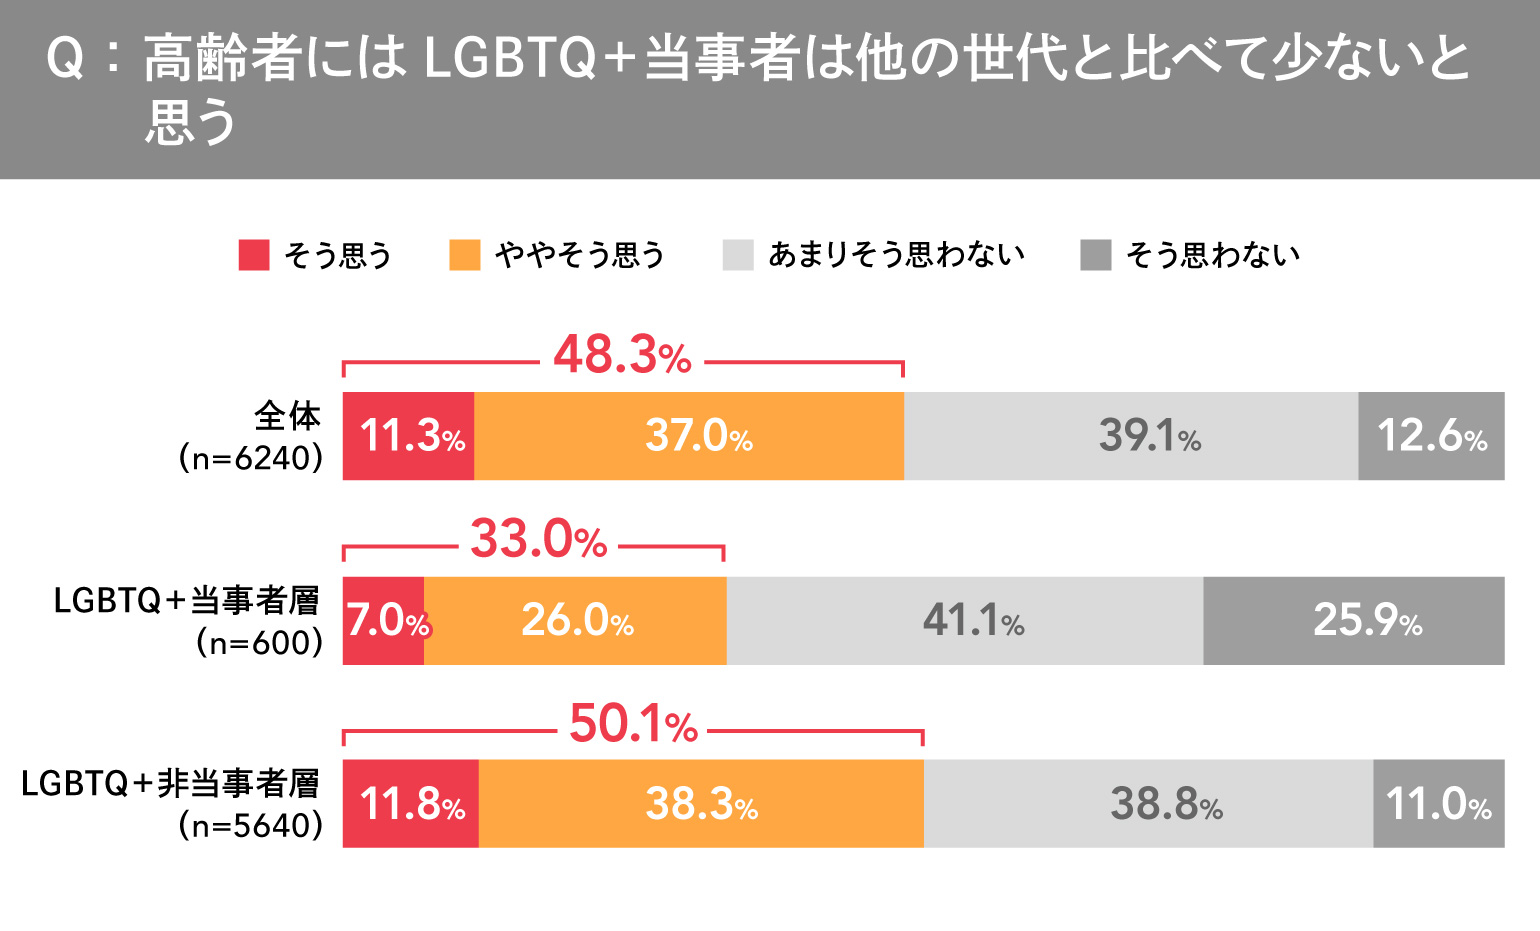
Additionally , 50.1% of non-LGBTQ+ individuals (combined total of those who “agree” and “somewhat agree”) believe that “there are fewer LGBTQ+ people among the elderly compared to other generations.” While it is true that older LGBTQ+ individuals are often underrepresented, the survey suggests that the issues they face—such as long-term care, medical care, and end-of-life planning—are wide-ranging. In the open-ended responses, participants cited concerns such as “fear of not being able to be with my partner at the end of their life,” “a same-sex partner not being able to give medical consent,” “which partner will provide care for the other in old age,” and “not wanting parts of a posthumous Buddhist name that distinguish by gender.”
Although older LGBTQ+ individuals do exist, they are often overlooked due to historical and societal factors, which may have led to the stereotype that “there are few LGBTQ+ people among the elderly.”
Furthermore, when discussing the challenges faced by LGBTQ+ individuals, attention tends to focus on areas such as romance and marriage—which are relatively easy for non-LGBTQ+ people to visualize. In reality, however, challenges exist from the beginning to the end of life, and issues in areas such as healthcare, long-term care, and end-of-life planning are still not sufficiently recognized.
A gap in perception regarding barriers to daily life was identified between LGBTQ+ individuals and non-LGBTQ+ individuals
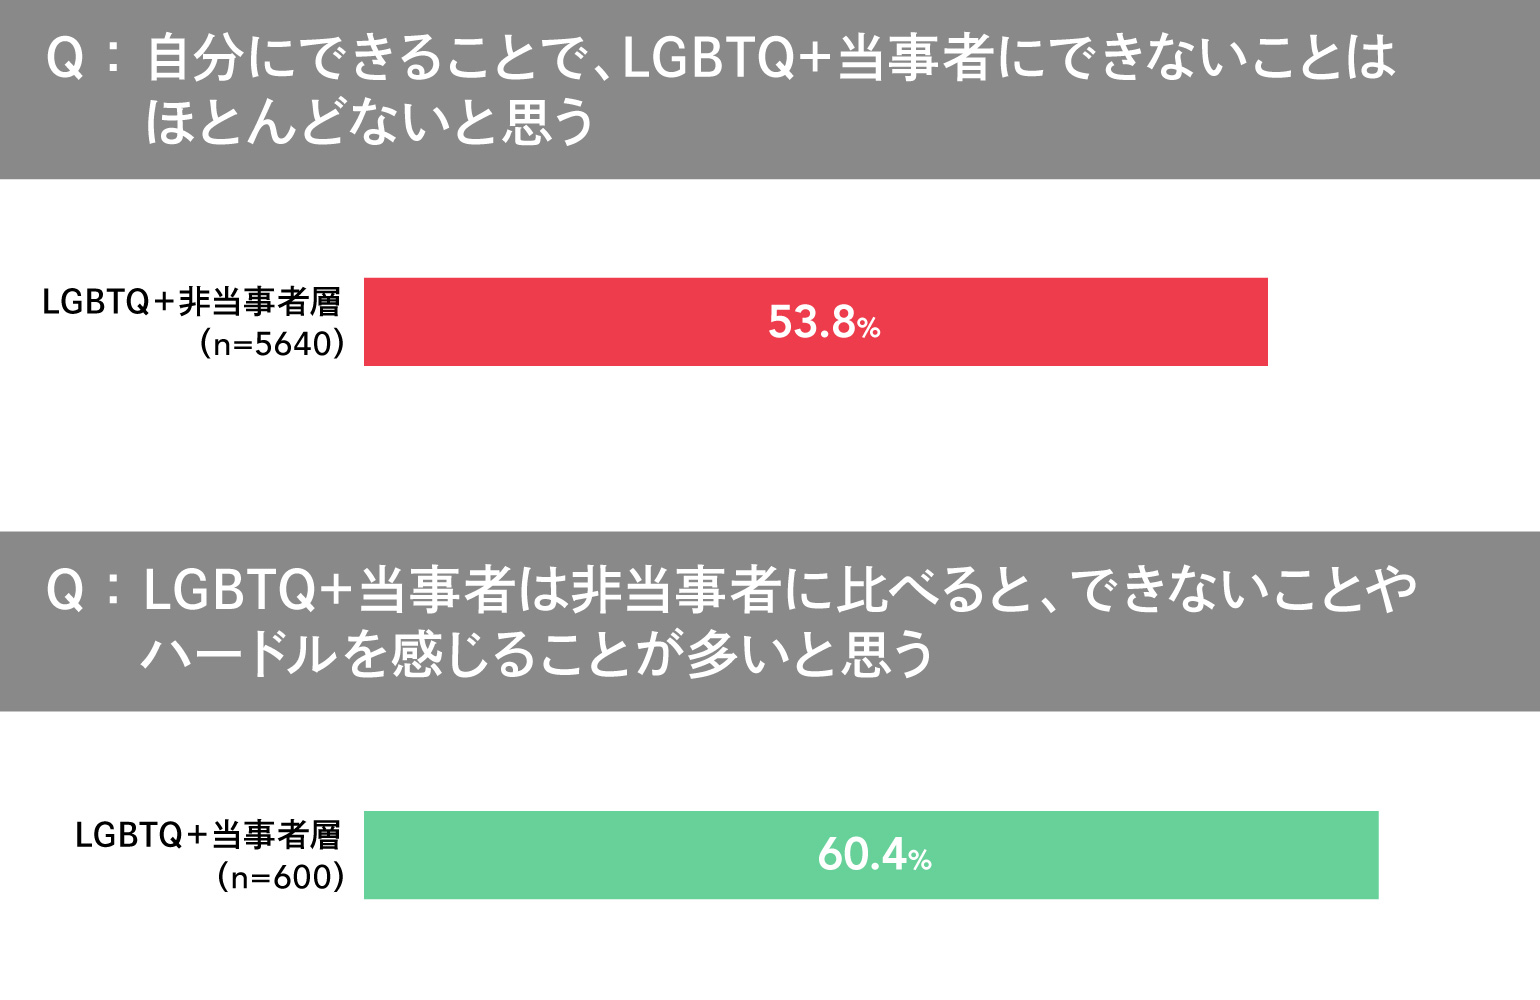
While LGBTQ+ individuals experience various hurdles in their daily lives, non-LGBTQ+ individuals tend to perceive that LGBTQ+ individuals live just as freely as they do, revealing a gap in perception between the two groups.
In fact, 60.4% of LGBTQ+ individuals responded that they “experience more limitations and hurdles than non-LGBTQ+ individuals.” On the other hand, 53.8% of non-LGBTQ+ individuals responded that “there is almost nothing that I can do that LGBTQ+ individuals cannot.”
These results reveal a discrepancy between the real barriers experienced by LGBTQ+ individuals and the perceptions held by non-LGBTQ+ individuals.
Furthermore, it became clear that this gap in perception between LGBTQ+ individuals and non-LGBTQ+ individuals exists across various stages of life.
One such gap is that non-LGBTQ+ individuals believe, “You can just buy a wedding ring with your same-sex partner,” while LGBTQ+ individuals feel anxious about the stares they might receive from others when purchasing or wearing such a ring. For non-LGBTQ+ individuals, these are often well-intentioned remarks, such as “You should just get a wedding ring without worrying about it” or “I hope you’ll be happy once you have one.”On the other hand, however, these remarks often fail to empathize with the circumstances of same-sex couples or the anxieties they experience daily, and can sometimes unintentionally cause them harm.
Through this survey, I came to feel that one reason for this gap may be that non-LGBTQ+ individuals have limited opportunities to hear the real voices of LGBTQ+ people. Based on this insight, I created the digital book *“What We Think We Know vs. The Reality.”*Covering themes such as “Romance and Marriage,” “Work Styles,” “Housing,” “Children and Education,” “Healthcare and Disaster Preparedness,” and “Retirement,” the book aims to visualize the “assumptions” held by those outside the experience and the “reality” faced by those directly affected, serving as a catalyst for recognizing these differences. We hope that these insights will deepen each person’s understanding and lead to a society where everyone can live more comfortably.
In the next post, I’ll provide a detailed introduction to the content, background, and intent behind the digital book “What We Think We Know vs. The Real Story,” which was created based on the survey results.
( Click here to download the LGBTQ+ Survey 2026 “What People Think They Know vs. The Real Story” digital book)
[Survey Overview]
〈Screening Survey〉
・Target Area: Nationwide
・Eligibility Criteria: Ages 20–59
・Sample Size: 46,658 people
・Survey Method: Online survey
・Survey Period: January 19–27, 2026
〈This Survey〉
・Target Area: Nationwide
・Eligibility criteria: Ages 20–59
・Sample Size: 6,240 respondents (600 from the LGBTQ+ group / 5,640 from the non-LGBTQ+ group)
・Survey Method: Online survey
・Survey Period: January 19–27, 2026
Note: The results have been weighted by prefecture, gender, and age group (20s–30s / 40s–50s) to align with the proportion of LGBTQ+ individuals and the general population distribution.
Note: Since the percentages in this survey are rounded to the nearest whole number (to the second decimal place), the total may not add up to 100%.
Was this article helpful?
Share this article


Newsletter registration is here
We select and publish important news every day
For inquiries about this article
Author
Ryo Morita
Dentsu Inc.
Chubu Business Production Bureau, Account Lead Division 3
Account Lead

Kahori Kishimoto
Dentsu Inc.
Marketing Division 3
Strategist