Note: This website was automatically translated, so some terms or nuances may not be completely accurate.
What are the characteristics of kids' lifestyles? ~Analyzed using kids/ex~
Video Research Ltd. launched its "Children's Survey" in 1976 as a service to comprehensively capture children's lifestyles, including daily activities, attitudes, media exposure, and product usage.
Subsequently, it evolved into the "Character and Children's Market Survey," incorporating character penetration data to expand marketing data targeting children. Now, in response to recent changes in children's living environments, we have released "Kids/ex," a renewed survey. Here are some highlights from the first survey results.
Minions Close in on the Ever-Popular Doraemon
The number one character chosen by children in the 2017 "Kids/ex" survey is "Doraemon." It continues to hold the top spot from the previous "Character and Children's Market Survey." While classic characters like "My Neighbor Totoro" and "Mickey Mouse" rank highly, the second place is taken by the relatively new character "Minions" [Figure 1].
So, how do parents rate these characters?
Previous "Character and Children's Market Surveys" focused solely on "mothers" as respondents. However, "Kids/ex" expanded the scope from "mothers" to include "parents." This change allows us to track popular characters among fathers in addition to the child and mother rankings.
The number one favorite character for both mothers and fathers was "My Neighbor Totoro," differing from the children's top choice.
Following "My Neighbor Totoro," mothers ranked "Mickey Mouse," "Minions," and "Minnie Mouse" highly. In contrast, fathers ranked "Doraemon" (tied for 1st place), "Lupin the Third," "Dragon Ball," and other characters not favored by mothers highly.
While some discrepancy between children's and parents' rankings was anticipated based on previous surveys, this study revealed differences specifically between mothers' and fathers' favorite characters, and a tendency among fathers to prefer game characters.

Children's daily activities show a decrease in "sleep" and an increase in "learning" as they grow older
"Kids/ex" tracks children's daily activity patterns and rhythms through diary-style lifestyle surveys. This time, we present data on children's "sleep" and "learning" time.
Last year, we frequently heard about "sleep debt." But are growing children getting enough sleep?
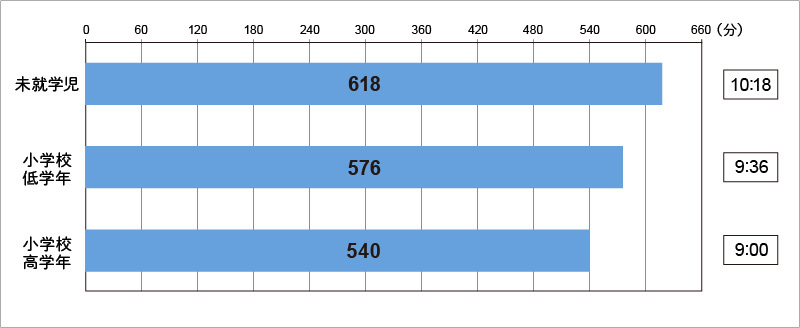
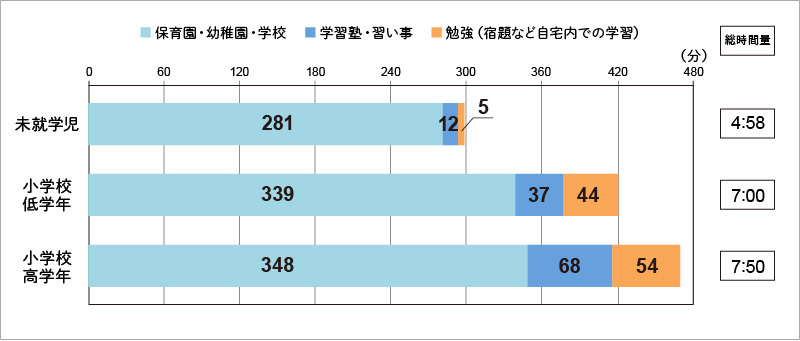
Sleep time averages 10 hours and 18 minutes per day for preschoolers, but drops to 9 hours for upper elementary school children, showing sleep duration decreases with growth [Figure 2]. Meanwhile, "learning" time—spent at school, cram schools, extracurricular activities, and studying at home—increases with school age, revealing the busy daily lives of children [Figure 3].
Internet exposure increases in upper elementary grades
Next, we present media exposure time at home. Television viewing time showed less variation by grade level compared to "learning" time. However, time-shifted TV viewing (recorded playback) was slightly longer among preschoolers, averaging 32 minutes per day compared to elementary school students. On the other hand, internet exposure time averaged 35 minutes per day among upper elementary school students, longer than other age groups [Figure 4].
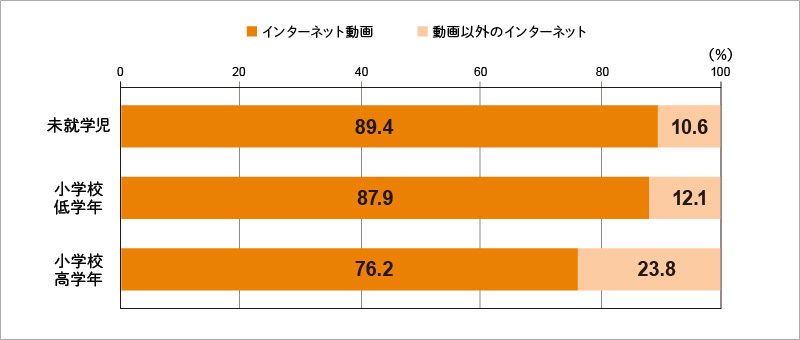
Breaking down internet activities, video viewing accounted for over half of the total weekly internet time across all age groups.
Video viewing can be enjoyed even without reading or input skills, and it appears that video viewing is the central focus of internet contact, especially for younger children [Figure 5].
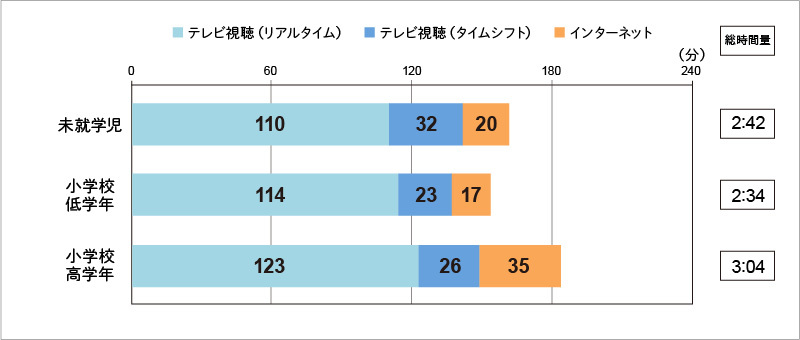
[Figure 4]: Daily Time Spent on "TV" and "Internet" (At Home / Weekly Average)
Children's Internet Use Concentrated on YouTube
So, what does children's internet usage look like? [Figure 6]
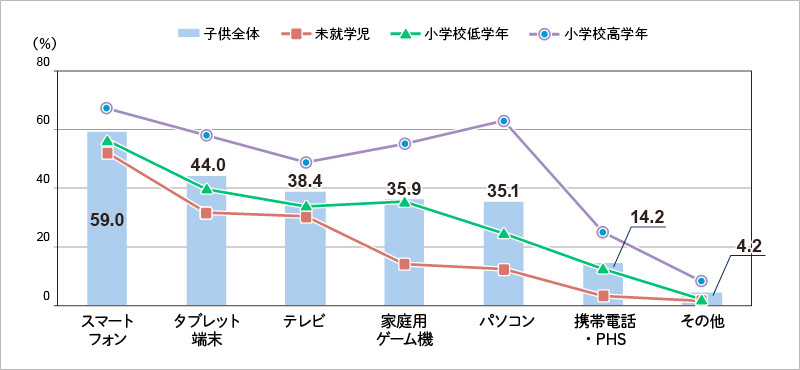
The experience rate of internet use by device over the past six months shows "smartphones" exceeding half, at 59% of all children. Furthermore, mobile devices—specifically "smartphones" and "tablets"—occupied the top two spots in experience rates, followed by "TVs" and "home video game consoles," all surpassing "PCs." Among upper elementary school children, the PC experience rate reached a level comparable to mobile devices.
Regardless of device, children's internet usage is heavily concentrated on YouTube (used by about 80% of internet users), with no other services standing out significantly.
Furthermore, children's favorite internet videos include "funny videos" (such as "try it out" videos, nearly 50%), "game playthroughs" (30%), "toy reviews," and "anime" (both just under 30%). This also suggests children enjoy watching YouTubers' videos.
<Kids/ex Survey Overview>
・Survey Area: Within 50km of Tokyo
・Survey Participants: Individuals aged 3 to 12 years old (excluding junior high school students)
※ Responses entered by parents or parent representatives
・Valid Sample Size: 2017: 593 responses
(Mothers: 319 / Fathers: 274)
(Preschoolers: 190 / Lower Elementary: 183 / Upper Elementary: 220)
・Survey Period: October 6 (Fri) to October 29 (Sun), 2017
・Survey Method: Survey conducted via electronic questionnaire
・Subject Selection Method: Survey requested from ACR/ex monitors with eligible children living in the same household
・Main Survey Items: Character Recognition / Media Exposure / Product Usage / Daily Life Awareness / Daily Life Behavior
*Includes some questions targeting the parents of the subjects
This article is edited based on the VR Digest published by Video Research Ltd. in March 2018.
Was this article helpful?
Share this article
Newsletter registration is here
We select and publish important news every day
For inquiries about this article
Author

Tomoko Akiyama
Video Research Ltd.
Media and Communications Business Division ACR/ex Business Promotion Department
Joined the company in 1991 and was assigned to the Direct Marketing Department. After working in telemarketing and internet research, began planning and analyzing VR independent surveys in 2006. Has been involved with the ACR/ex single-source consumer data since 2014.