Note: This website was automatically translated, so some terms or nuances may not be completely accurate.
Data-Driven Insights: How "Startups × TV Commercials" Drive Business Growth
How do TV commercials contribute to a company's business growth?
Various metrics that were difficult to visualize in the past can now be demonstrated with data.
This time, we explore the potential of TV commercials by introducing case studies of startups that implemented them.
Shouldn't startups focus more on digital advertising than TV commercials?
Generally, the main reasons many companies run TV commercials are to "reach their target audience efficiently" and to "maximize brand awareness." Even today, "reach rate" and "brand awareness" remain crucial metrics in corporate marketing, and it is undeniably true that TV commercials have the power to improve these.
However, an increasing number of industries are finding these effects alone insufficient to justify their investment in TV commercials.
Because TV commercials involve large investments, they easily become entangled in accountability debates. Compared to digital advertising, they are far more frequently questioned with statements like, "The results aren't as good as expected. What's your take on this?"
It's crucial for advertising agencies to explain upfront to prevent companies' expectations—their "anticipated effect"—from diverging too far from reality. However, even more significantly, when asked how TV commercials themselves contribute to "business growth," it's difficult to quantify their direct impact on customer acquisition, profits, or subsequent loyalty. This lack of clear, direct numerical evidence linking TV commercials to business outcomes is a major reason companies hesitate to invest in them.

This situation often leads to the perception that only companies with the resources to invest in brand building (national clients) run TV commercials. It's easy to imagine that startups, particularly those demanding rigorous PDCA cycles for each consumer interaction based on KPIs and business growth, tend to concentrate their ad spending on digital advertising where results are more easily visualized.
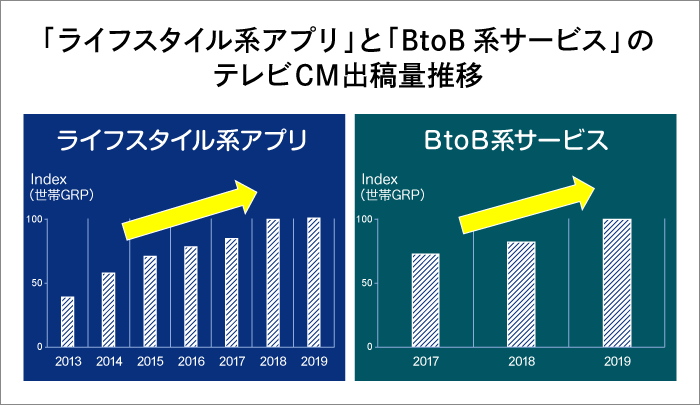
However, looking at industries where TV advertising share is growing recently, "lifestyle apps" and "B2B services" stand out, showing this hypothesis doesn't always hold true.
*1 Definition of lifestyle apps: Smartphone app services excluding game apps
What is the "Link" to Business Growth Led by TV Commercials? ~ Visualizing "TV Commercials Were Extremely Effective"
Many startup companies that ran TV commercials often report the following effects from their CEOs or marketing managers:
- App downloads increased
- Increased active app users
- Increased registered members
- Target audience expanded
- Achieved profitability
- Stock price has risen
- Sales have increased
- Lead time to order fulfillment shortened
- Repeat customers increased
- The number of stores carrying the product increased
- It went viral
While these statements may initially seem like "qualitative" self-satisfaction, they can be visualized as data. Let's look at some of the metrics we were actually able to demonstrate with data.
Direct impact from TV commercials

Of course, TV commercials alone didn't drive the stock price up.
Rather, regarding stock prices, not only startups but also companies running TV commercials for the first time need accountability to shareholders for investing such a large budget. In other words, to avoid sell orders from shareholders concerned about the effectiveness of advertising spend, it is necessary to visualize the impact of TV commercials "comprehensively and quantitatively."
Here, we are not suggesting that "TV commercials control everything." It is better to think of TV commercials as a base around which various metrics are mutually "linked."
The metrics we were able to visualize through data, linked to TV commercials, are as follows. They broadly fall into two categories: Action (behavioral) and Psychology (psychological).

For "Action," we can visualize a wide range of metrics including search volume, download numbers, click-through rates, conversion rates, service user counts, and sales. For "Psychology," metrics include interest in the brand, understanding rates, corporate image, and stock prices.
Let's explain the TV commercial-based "link" in a bit more detail.
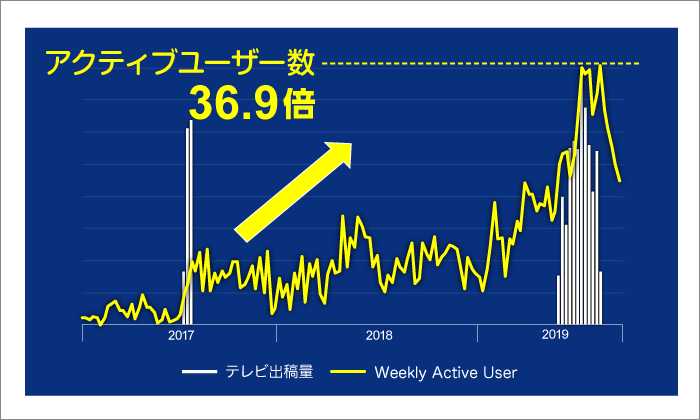
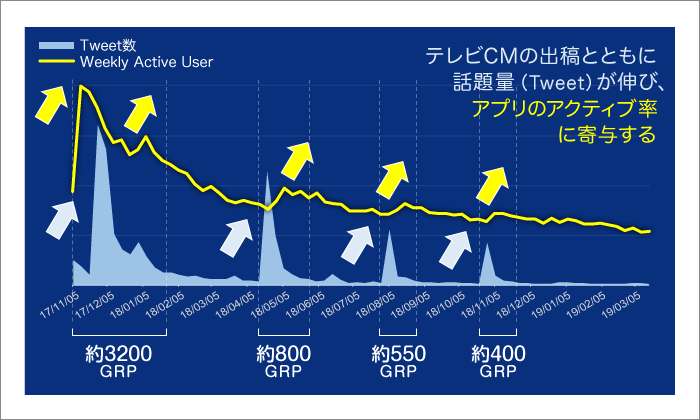
For example, we often receive requests like "We want to create buzz (get people tweeting) using TV commercials." We can visualize the "link" from TV commercial → number of tweets → activation rate, showing whether this directly contributes to the business—specifically, whether tweets lead to subsequent downloads and further app launches (activation).
Furthermore, beyond just "links," we can demonstrate, using data from over 400 TV commercial campaigns in the app industry, which specific elements within the TV commercial creative contribute to actions like downloads.
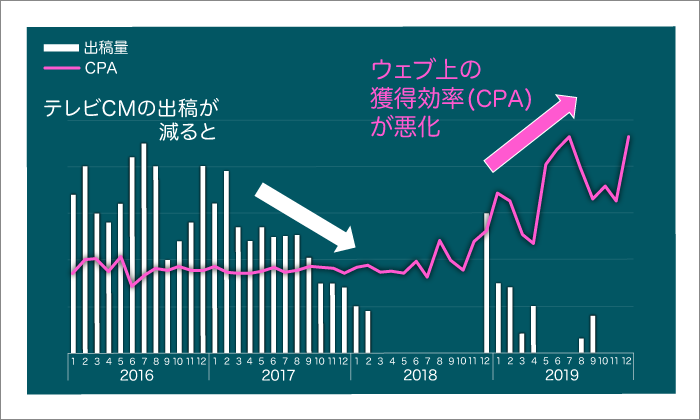
Conversely, for companies running regular campaigns, we can visualize the link between TV commercials and online acquisition efficiency (CPA) to answer the question: "How would online behavior change if we stopped TV commercials?"
Examples of visualizing the "link" of TV commercial effectiveness
Distinguish between short-term PDCA and PDCA for business growth
Questions like "What's the ROI of TV commercial placements?" or "How do they compare to digital ads?" are certainly important to visualize. However, within discussions like "TV commercials boosted XX!", we must separate the visualization of "short-term effects"—such as search volume, tweet count, or download numbers—from the visualization of "mid-to-long-term effects". What matters more than immediate effects is how much TV commercials can contribute to "business growth (sales)."
Let's jump right in: If you were in the following situation, which would you choose?

In the short term, you might be inclined to choose creative material A, but in the long term, material B is more likely to directly drive sales. It's probably been common knowledge in the industry for a while that we should look at it from the perspective of active users (Cost Per Active) rather than downloads (Cost Per Install). However, recently, visualizing active users and running PDCA cycles has become standard practice for all companies.
For example, by connecting Dentsu Inc.'s DMP (STADIA※2) with company data (like mobile device IDs such as ADID), we can ask: "What are the TV viewing habits of people who actually downloaded the app?" "Can digital advertising capture high-quality active users likely to make purchases?" From a "psychological" perspective: "Which approach enhances the image directly linked to business growth (e.g., perceived technological strength, desirability as an employer)?" We now live in an era where it's standard practice to run PDCA cycles side-by-side for both "behavioral" and "psychological" aspects, comparing TV and digital.
※2 STADIA: As of May 2019, it possesses a scale linking approximately 12 million mobile device IDs and 50 million Cookie_ids to audience data, alongside approximately 100,000 survey monitors linked by individual-level unique IDs, against approximately 4 million actual viewing log data points from TV sets and recorders combined.
This is why many startups, precisely because they anticipate business growth, utilize TV commercials not only for digital but also with the specific aim of creating a "link" to their digital efforts. Furthermore, this "integrated PDCA focused on business growth" can be adopted not only by startups but by various companies, including national clients.
By customizing and leveraging various data—such as website visitor data and real-world data—and quantifying it, we can drive innovation in business. Utilizing TV commercials as one such method holds significant value.
Was this article helpful?
Share this article
Newsletter registration is here
We select and publish important news every day
For inquiries about this article

Author

Hama Daiki
Dentsu Digital Inc.
Corporate Division, Corporate Planning Department, Strategic Planning Lead
While engaged in media planning operations, I also develop solutions addressing various challenges and needs arising in the field. This includes creating the "Response Connector Dashboard Pro" to visualize the effectiveness of TV commercials and connected TV. My focus extends beyond individual optimization in media planning to broadly achieve marketing efficiency and maximize impact, centered on overall business growth. Master of Engineering (Human Engineering/UX).