Note: This website was automatically translated, so some terms or nuances may not be completely accurate.
Maximize advertising effectiveness through people-centered TV planning.
TV ratings serve as a crucial metric for corporate marketing activities. Their history is long, with nearly 60 years since AC Nielsen began household ratings surveys using measurement devices in 1961. During this time, ratings measurement methods have evolved.
Dentsu Inc. has released a new service, "People Driven TV Planning." This service extracts and visualizes advertisers' marketing targets in detail from increasingly sophisticated TV ratings data, evaluating TV advertising slots based on how much that target audience actually watches. This article explains the service.
New Television Ratings Data Continues to Emerge
Household ratings surveys began in 1961, followed by the launch of Video Research Ltd.'s "mechanical individual ratings survey" in the Kanto region in 1997. During this period, corporate marketing activities focused not only on consumers' "gender and age" but also on various "attitudes," "values," "hobbies," and "preferences," driving product development and advertising planning.
Furthermore, as digital marketing deepened, various data became available that could capture consumers' diverse "attitude shifts" and "actions" right up to the point of "purchase."
Against this backdrop, in 2020, Video Research Ltd.'s mechanical individual ratings survey underwent a major renewal, significantly expanding its measurement areas and sample size to capture the viewing behavior of "individuals" nationwide. This data has become an indispensable standard not only for advertisers and agencies planning TV advertising campaigns but also for broadcasters in program production and scheduling.
Beyond Video Research Ltd.'s mechanical individual ratings survey, new television ratings data sources have emerged, such as INTAGE's "Media Gauge TV" and "i-SSP," and Switch Media Lab's "SMART." Video Research Ltd. has also begun providing TV viewing data through "CUBIC." Many of these "new TV ratings data" sources include not only viewer "gender and age" but also diverse data such as "attitudes," "values," "hobbies," and "preferences." Furthermore, they can aggregate internet usage data from PCs and smart devices, along with app launch information, alongside TV viewing data.
What are the benefits of being able to obtain data beyond simple ratings?
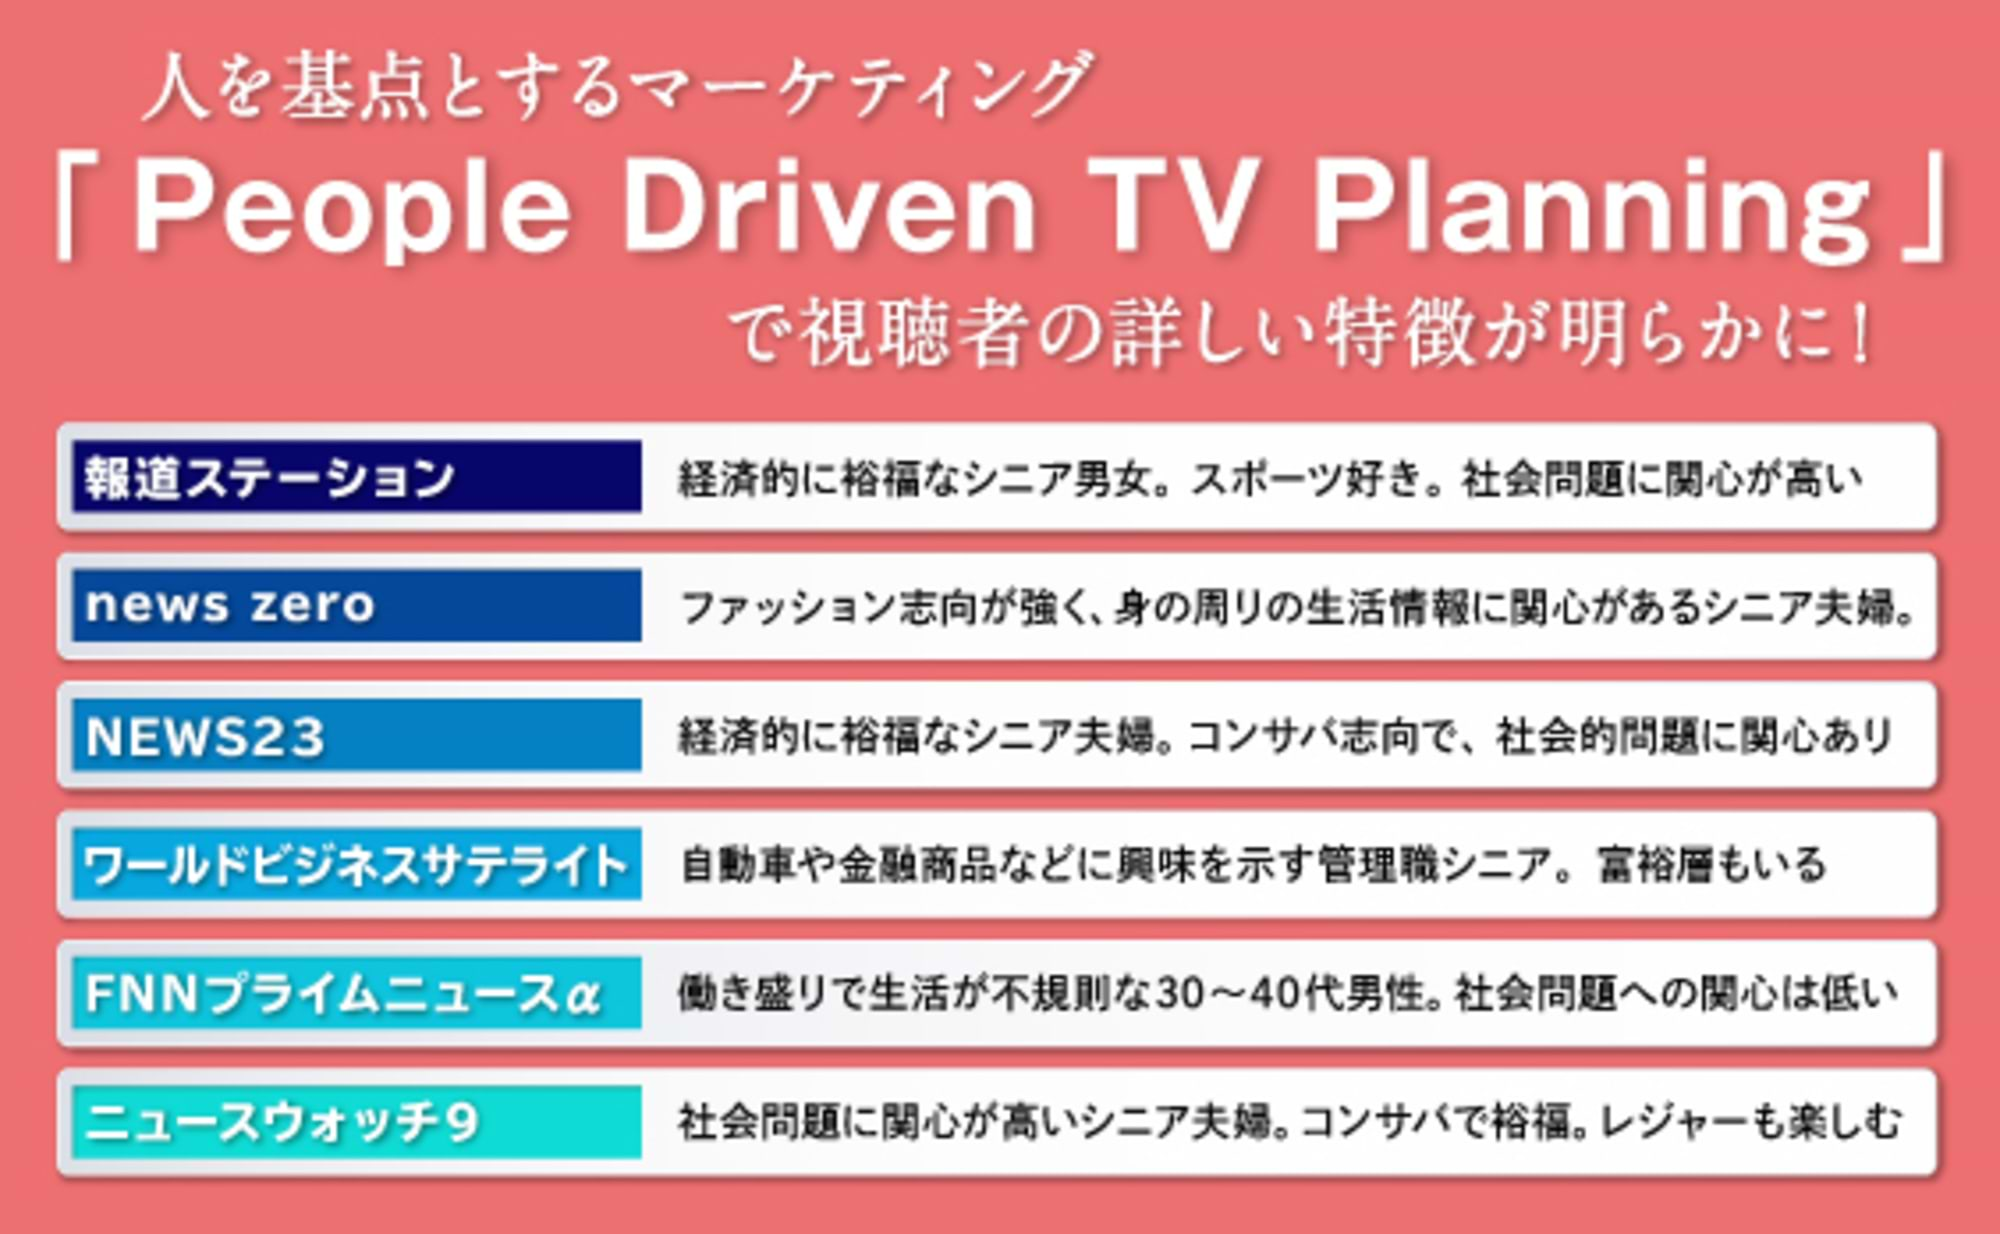
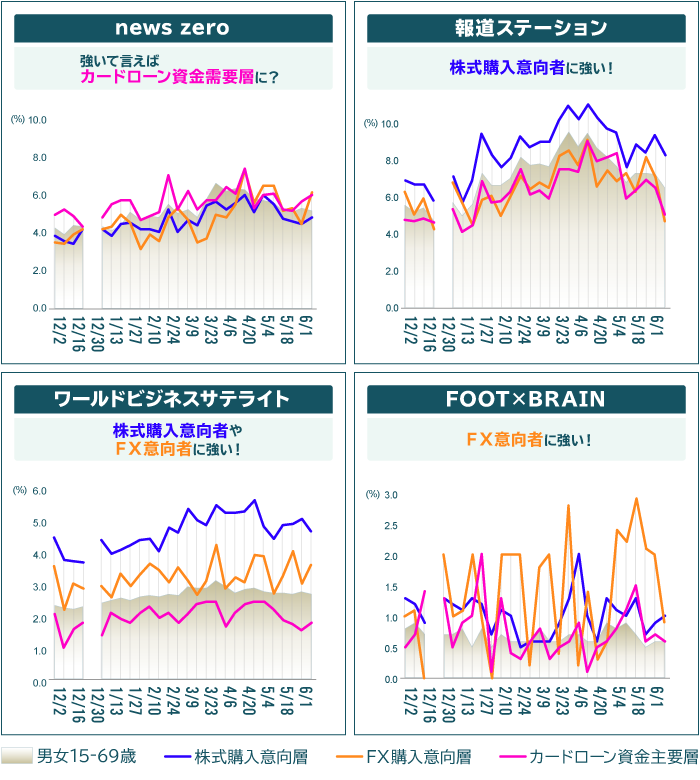
For example, weekday evening news programs are strongly associated with male viewers aged 35 to 69. However, this new data reveals the specific characteristics of each program's audience.
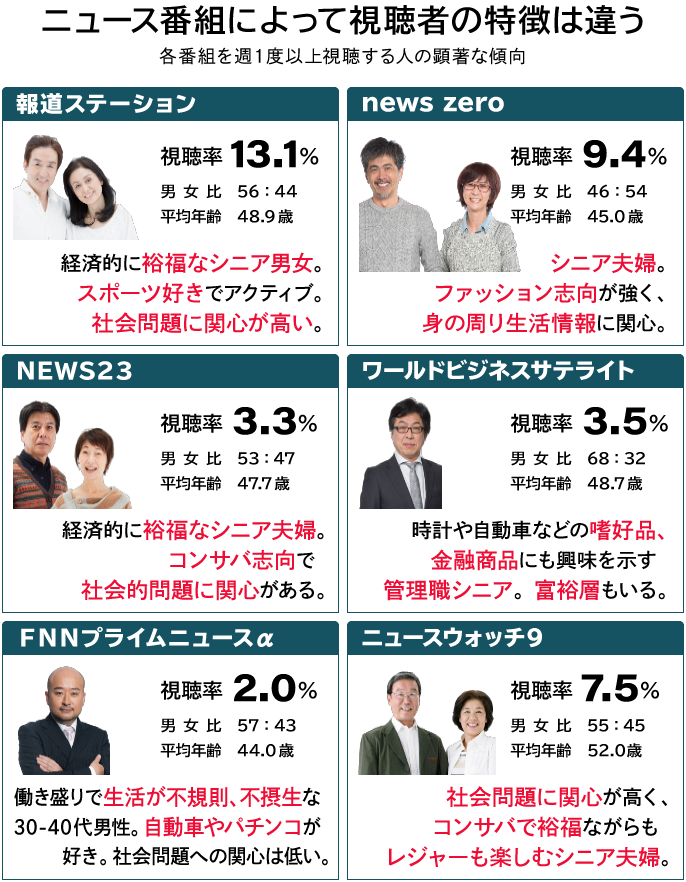
When data collected beyond TV viewing undergoes statistical analysis called "significance testing," various insights emerge. Values, interests, favorite celebrities, newspapers and magazines read, internet usage patterns, consumption behavior. Significant differences (statistically meaningful differences) appear across all these areas.
In other words, we see that viewers' profiles, lifestyles, and preferences differ completely depending on the program. Even weekday evening news programs, which might seem to attract similar viewers, have distinct personalities. We discover that each program has its own dedicated audience, reflecting the creators' ingenuity.
At Dentsu Inc., which is advancing "People Driven Marketing," we have already been collecting and analyzing similar data through platforms like "STADIA," an integrated marketing platform for digital ad delivery and effectiveness verification based on actual TV viewing logs. Furthermore, by actively utilizing the "new TV ratings data" introduced here, we will promote "People Driven TV Planning," which evaluates and leverages the true power of television from the consumer's perspective.
Enhancing Insight with Marketing-Level Ratings to Unlock TV's Power
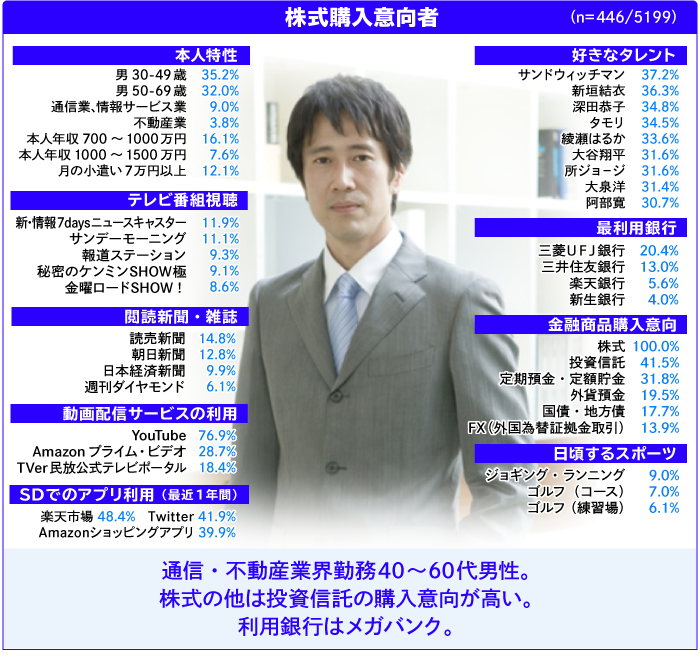
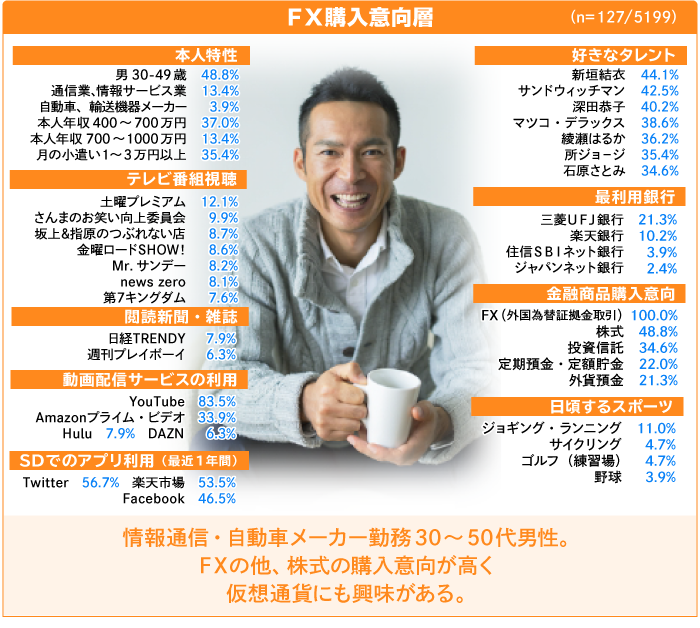
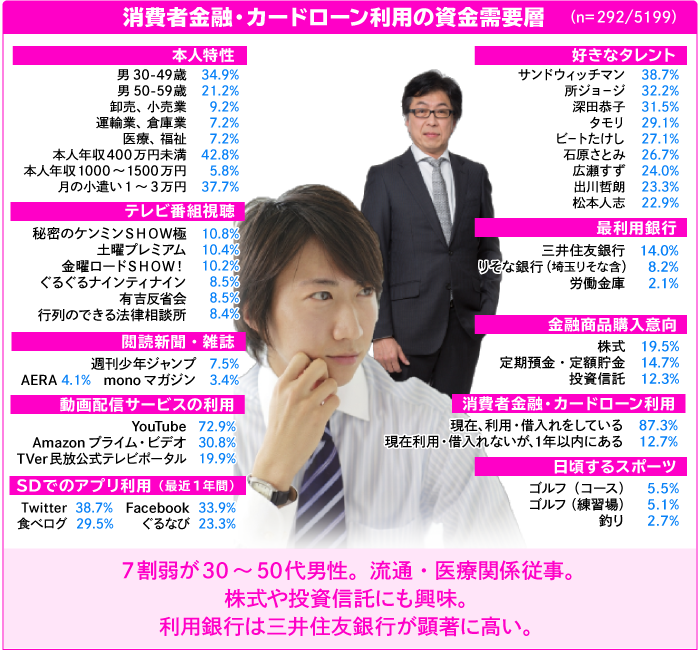
As an example of "People Driven TV Planning," we extracted three marketing segments likely relevant to financial advertisers: "Stock Purchase Intention Segment," "FX Purchase Intention Segment," and "Card Loan Fund Utilization Segment." Similar to program viewer personas, verifying significant differences one by one reveals various insights.
Furthermore, TV ratings for each demographic can be calculated minute-by-minute, just like traditional mechanical individual ratings. This measurement applies to both terrestrial and BS satellite broadcasts.
It is also possible to extract consumers from app launch logs and compile TV viewing rates. Let's look at some TV viewing rates for users who launched the "Rakuten Ichiba Shopping App," "Amazon Shopping App," "Yahoo! Shopping," and "Mercari (Merpay)" apps during the period from February 10 to May 10, 2020, which includes the start of the COVID-19 pandemic and the state of emergency declaration period.
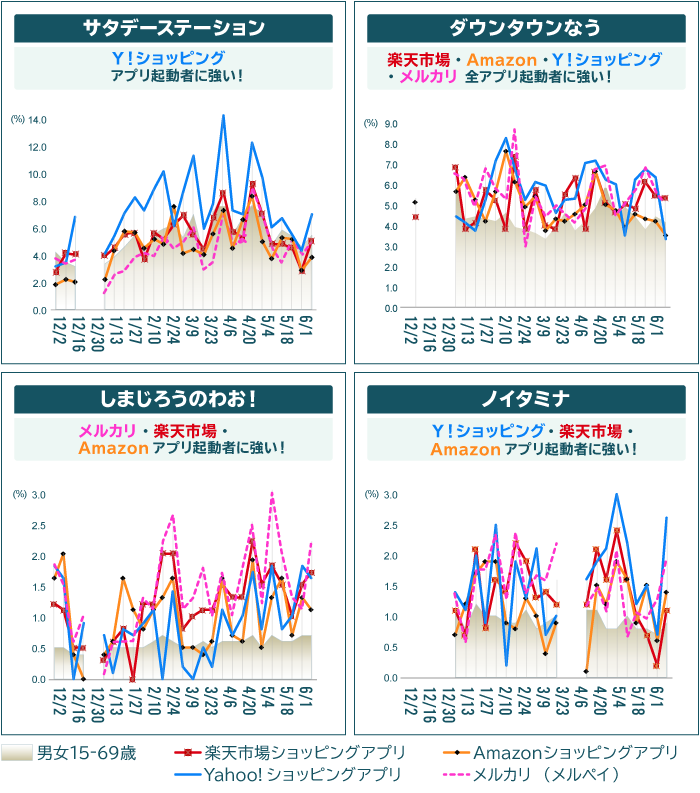
On programs like Saturday Station and several news programs, viewers who launched the "Yahoo! Shopping" app tended to show higher ratings. Furthermore, "Downtown Now" showed high viewing tendencies among users of all apps, making it a highly attractive program for advertising touchpoints with e-commerce services.
Anime programs also show distinct patterns: "Shimajiro's Wao!" reveals higher viewing tendencies among users who launched "Mercari," "Rakuten," and "Amazon," while "Noitamina" shows higher viewing tendencies among users who launched "Yahoo! Shopping," "Rakuten," and "Amazon."
Thus, the "marketing-tier ratings"—viewership among "consumers"—reveal distinct differences across demographics, even between news programs and anime. This applies not only to variety shows and dramas but also to major sports broadcasts and special programs, making it easier to discover advertisers' target customers in ways traditional individual ratings by gender and age couldn't. Dentsu Inc. has established an environment where various marketing demographic ratings, taking these segment-specific differences into account, can be compiled daily as "People Driven TV Ratings" and proposed to advertisers.
Streaming platforms like Netflix and Amazon Prime Video are said to leverage not only engagement metrics for each piece of content, but also thorough analysis of vast amounts of other interest data to understand the lifestyles and values of individual consumers, applying this insight to content production and scheduling. Meanwhile, broadcasters have also recognized this importance, accelerating similar initiatives, and we are increasingly receiving requests for viewer analysis.
The viewer—TV's customer—is not tied to the device, but fundamentally to the content. "People Driven TV Planning" clarifies this point through data, further unlocking television's inherent power.
Was this article helpful?
Share this article
Newsletter registration is here
We select and publish important news every day
For inquiries about this article
Back Numbers

Author

Hiroki Kita
Dentsu Inc.
Marketing Division 2
Executive Planning Director
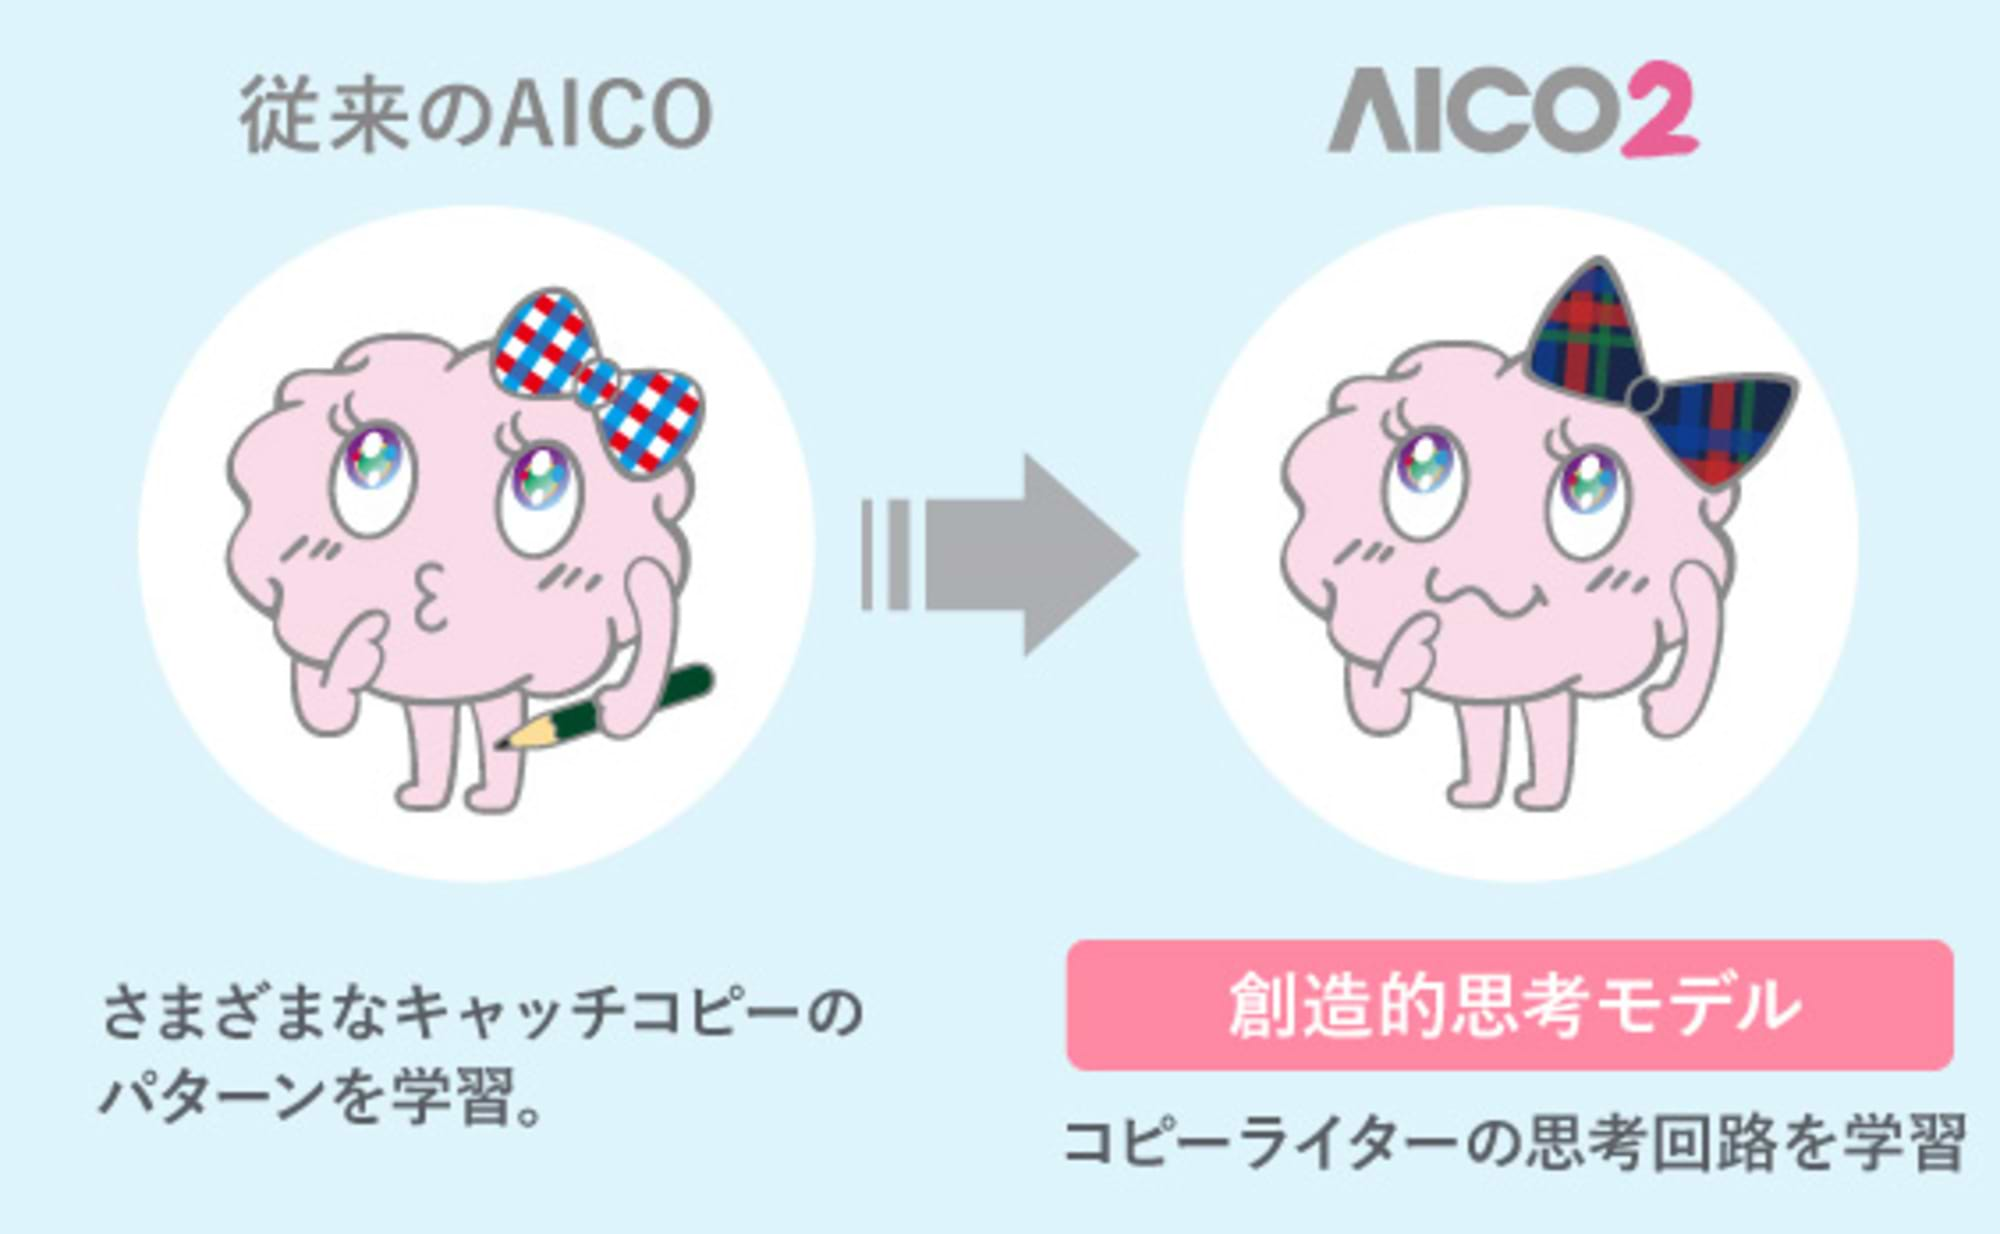
After working as a CM planner, sales executive, and on secondment to Beacon Communications K.K., he was involved in planning numerous product advertising campaigns. Later, as an advertiser representative for a single-company sponsored program, he handled multiple new program launches with broadcasters. Currently, in addition to data-driven customer analysis and planning, he is engaged in developing target profiling tools such as People Profiler and AICO2.