Note: This website was automatically translated, so some terms or nuances may not be completely accurate.
What challenges hinder Japanese companies from "using data for business growth"?
<Table of Contents>
▼What is the "Disconnect in Data Utilization Processes" Seen in Typical Japanese Companies?
▼Discrepancies in Direction Caused by Organizational Structure Widen with Each PDCA Cycle
▼Example of Directional Misalignment: "Inappropriate Segmentation of KPIs"
▼The Solution Lies in Integrating and Cycling Two PDCA Cycles with Different Speeds
What is the "Disconnect in Data Utilization Processes" Seen in Typical Japanese Companies?
Many Japanese companies lack highly specialized "data analysis personnel."
Furthermore, due to differences in employment structures, compared to the US, few companies have dedicated in-house teams responsible for collecting and utilizing marketing data.
- Data Analysis → "Collaborate with specialized data analysis companies"
- Post-analysis measures → "Collaborate with specialized firms for strategy planning and execution"
This fragmentation between "data analysis" and "post-analysis initiatives" represents the typical data utilization structure in Japanese companies.
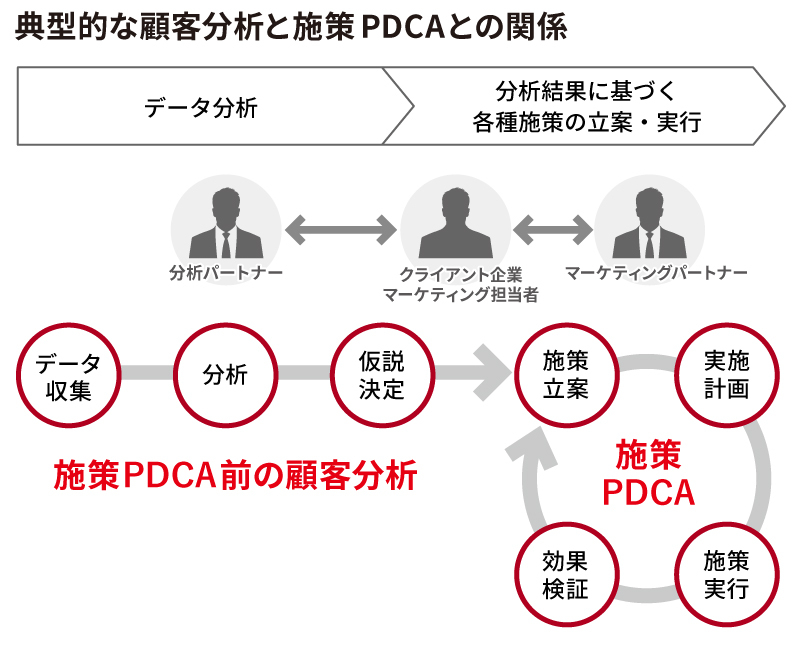
In essence, the company that should be the primary driver of data utilization becomes a hub connecting "specialized data analysis companies" and "specialized action planning and execution companies" (see diagram below).
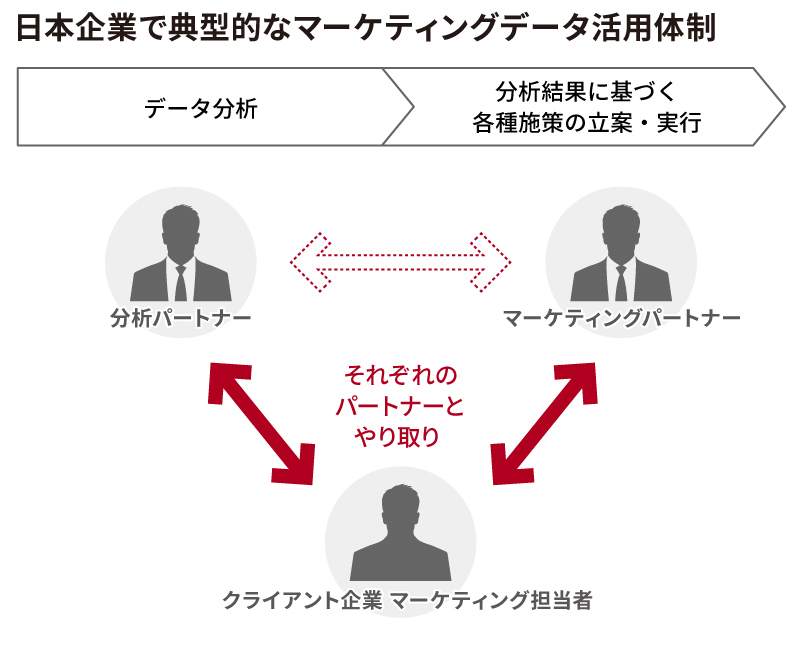
Of course, some companies successfully drive data utilization even within this structure. However, in many cases, the communication costs for the marketing personnel at the hub company become excessively high, often leading to miscommunication.
This article examines the disconnects in data utilization processes commonly found in projects within such structures.
Directional misalignment caused by the structure grows larger with each PDCA cycle
The core issue with the previous structure is the time lag between "data analysis" and "post-analysis initiatives."
Consequently, data analysis is often confined to the "entry point" of the PDCA cycle. In the actual PDCA loop, speed takes priority, and data analysts are rarely involved (see figure below).
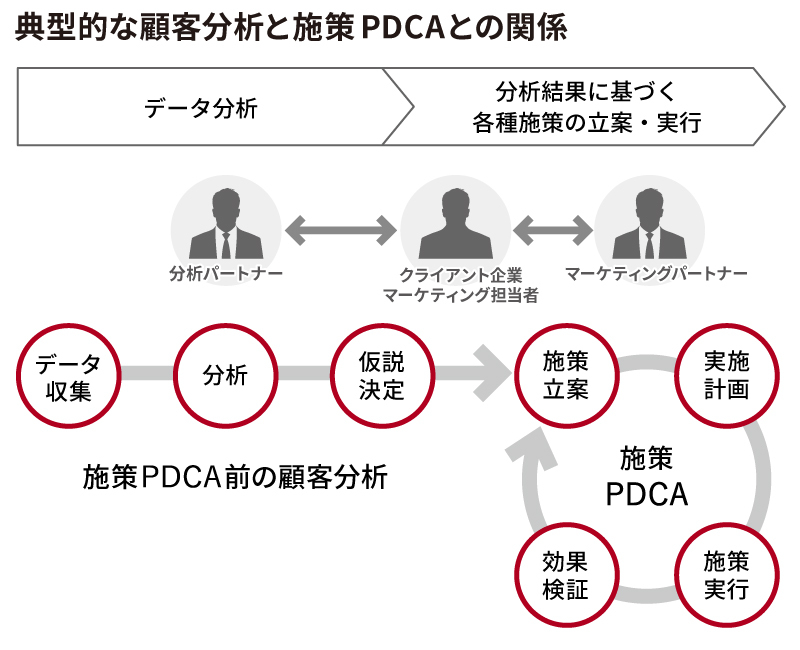
For example, suppose a specialized data analysis firm sets customer segments through its analysis, creates algorithms using data to segment customers, and defines KPIs for each segment.
However, the subsequent measures for each segment and the resulting changes in KPIs are typically managed through a PDCA cycle involving the specialized agency planning and executing the measures and the client's measure implementation team.
At first glance, this data utilization process appears rational and efficient. And indeed, it is possible to cycle through PDCA toward improving the defined KPIs.
However, in my experience, while the PDCA cycle in this process works as intended for the first few iterations, it tends to gradually drift away from the original intent with each subsequent cycle.
Example of Directional Deviation: "Inappropriate KPI Segmentation"
This deviation in direction arises from various factors.
One problem I frequently observed in processes where "data analysis" and "PDCA for initiatives" were separated was "inappropriate segmentation of KPIs."
Let me illustrate what this looks like using a hypothetical video subscription service.
While this is a fictional example, it's based on real situations I've encountered in the field. You might recognize similar scenarios in your own work.
① Bridging the Gap from the "Analysis Phase" to the "Strategy Planning and Execution Phase"
This is the story of a fictional company offering a subscription service.
Data analysis suggested that "getting a certain customer segment (hereafter Segment A) to use a certain web content (hereafter Content A) would likely lead to continued use of our service."
The natural progression would be to plan and execute initiatives, primarily through digital channels, with the KPI being "increased usage of Content A by Segment A."
Here, we determined that within digital channels, we would identify whether a user belongs to Segment A and then execute special initiatives only for those users who match.
With this groundwork laid, the PDCA cycle during the initiative planning and execution phase should run smoothly.
However, even this seemingly straightforward scenario of linking data analysis and initiatives has pitfalls due to "process fragmentation."
② The PDCA cycle for campaign planning and execution. But there's a pitfall...?
For example, suppose a strategy is planned to change the content of an email newsletter to primarily promote Content A only to customers in Segment A.
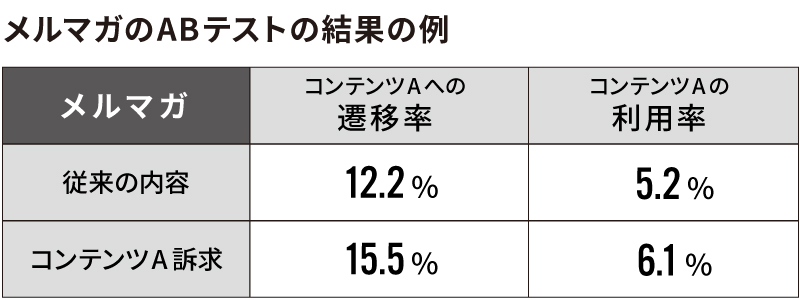
The email newsletter manager consults with a specialized planning and execution company and prepares the creative assets. They conduct an A/B test comparing the click-through rate from the newsletter to Content A and its usage rate.
The results showed that the newly prepared newsletter promoting Content A had higher click-through and usage rates for Content A compared to the previous newsletter, as shown in the table below.
The manager evaluated the results of the new email and decided to refine the creative promoting Content A for further improvement.
At first glance, this appears to be a well-functioning PDCA cycle. However, the KPIs here are already being split inappropriately.
③ Was there an "inappropriate segmentation of KPIs" occurring?
Let's take another close look.
The KPI initially set based on the hypothesis derived from customer analysis was:
Increased usage rate of Content A by Segment A
.
In contrast, the KPI for the email campaign initiative we just reviewed was
the transition rate and usage rate from the email newsletter to Content A
.
To get users to utilize that content, they obviously need to transition to it first, so making "transition rate" a KPI isn't particularly problematic. However, limiting it to "from the email newsletter" is clearly inappropriate.
Why? Because there should be various other paths available for users to reach that content. In other words,
"Users who were originally going to use that content via paths other than the email newsletter simply started reaching it via the newsletter due to new creative content"
(see table below).
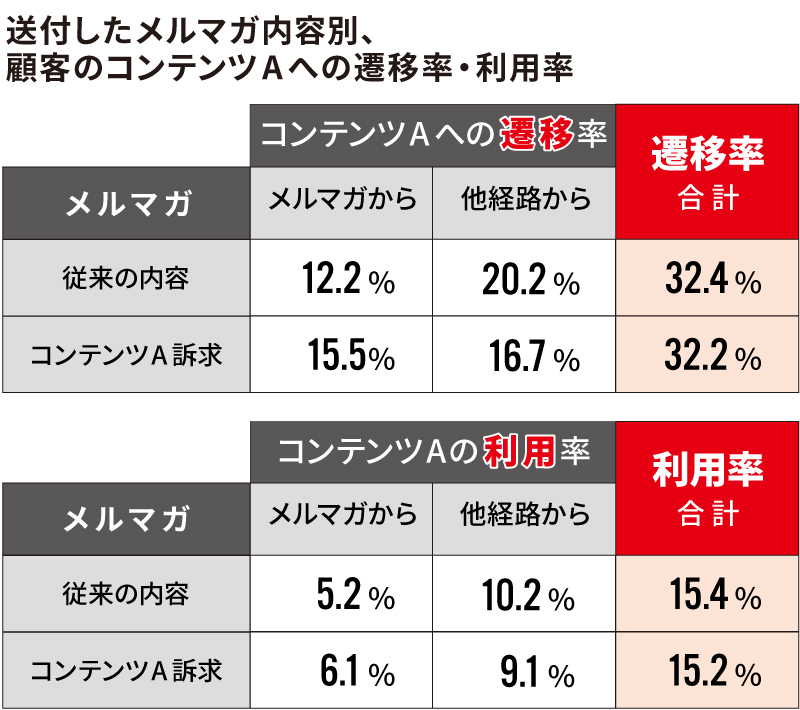
If this is happening, sending more "Content A Promotion Newsletters" will not achieve the original goal: "increasing the usage rate of Content A within Segment A."
This is a classic example of "inappropriate KPI segmentation."
So why does this "inappropriate segmentation of KPIs" occur in the field during PDCA cycles for such initiatives?
I believe a major cause lies in the relationship between "data analysis" and "campaign PDCA," as illustrated earlier.
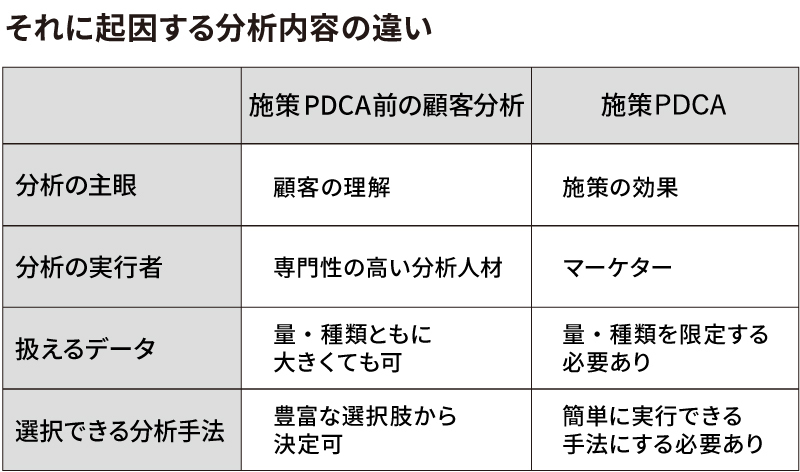
Before entering the measure PDCA cycle, customer data analysis naturally focuses on "understanding customers." Here, highly specialized analysts perform the work, enabling access to a wide variety and large volume of usable data, along with a rich selection of analytical methods.
Conversely, once the action PDCA cycle begins, the primary focus tends to shift to "measuring the effectiveness of actions." Moreover, since highly specialized analysts are rarely present at this stage, the types and volume of data available for analysis become limited, and the analytical methods employed often lean toward standardized processing (see chart below).
Given such a disconnect in the process, it's no surprise that the intended direction of initiatives deviates further with each iteration of the PDCA cycle.
The solution lies in integrating and circulating "two PDCA cycles operating at different speeds."
How can we minimize this drift?
The solution that immediately comes to mind is
- Incorporating highly specialized data analysts into the measure PDCA cycle
- involving highly specialized data analysts
- while keeping the primary focus firmly on customer understanding,
- and perform large-scale, diverse data analysis within the PDCA cycle.
However, securing highly specialized data analysts is difficult, and naturally, the
However, securing highly specialized data analysts is difficult, and naturally, the more meticulous the analysis, the more time it consumes. Therefore, from a speed perspective, this solution may seem impractical.
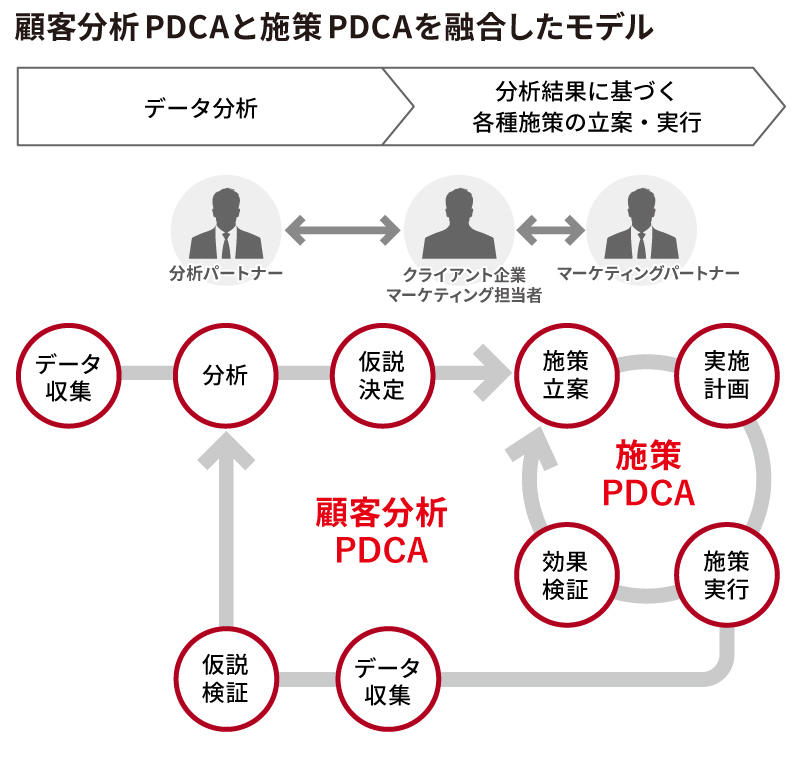
Therefore, what I propose is to integrate and cycle two PDCA loops with different speeds, as shown in the diagram below.
- a model that integrates and cycles two PDCA loops operating at different speeds
.
While the data analysis PDCA cannot cycle as quickly as the initiative PDCA, once it completes one cycle, it becomes possible to correct the discrepancies in the initiative PDCA.
However, even with this model circulating two PDCA cycles, if the organizational structure remains fragmented as before, the burden on the company's marketing personnel—who are central to data utilization—remains heavy, and the high communication costs cannot be resolved.
Furthermore, even if marketing personnel enhance their data analysis knowledge and skills through training to overcome this challenge, applying it to actual work is not easy.
The most realistic solution at this stage is likely to involve collaborating one-on-one with a "Marketing Science Partner"—a team that includes highly specialized data analysts—to drive both PDCA cycles, as illustrated below.
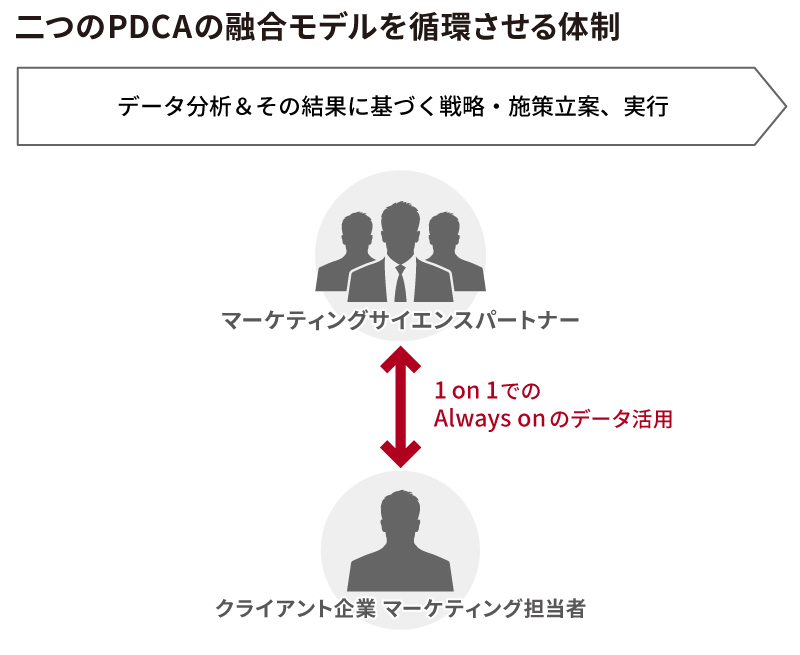
This structure is suitable for companies with many internal generalists who can collaborate with external specialists as needed.
- seems well-suited even for traditional Japanese companies that have many generalists internally and collaborate with external specialists as needed.
seems well-suited even for traditional Japanese companies.
As the pandemic makes it increasingly difficult to observe customers directly, data utilization grows ever more critical. The need to bridge the gap between "data analysis" and "strategy execution," integrating and cycling both PDCA loops, will only intensify.

Always-On Marketing
Data as the Bridge Between Companies and Customers
DENTSU CROSS BRAIN INC.
https://dxb.co.jp/
DENTSU CROSS BRAIN INC. provides services supporting "talent development" and "system building." Our experts work hand-in-hand with clients to establish systems focused on the fundamental goal of "solving marketing challenges."
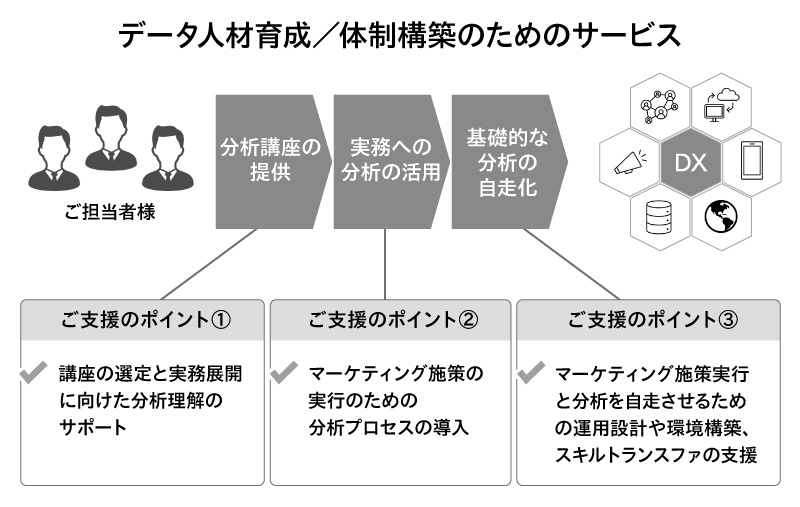
-
Organizing the necessary skill sets required for problem-solving and selecting the courses needed to acquire them
-
Proposing analytical processes for practical marketing implementation
-
Establishing workflows and environments enabling in-house execution from analysis to implementation
-
Skill transfer from DENTSU CROSS BRAIN INC. personnel to clients
Data isn't something you just collect, nor is it enough to simply have data analysts. What's needed is "building a data analysis framework within marketing."
If you're facing challenges, please consult DENTSU CROSS BRAIN INC.
Contact DENTSU CROSS BRAIN INC. here
https://dxb.co.jp/contact/
Was this article helpful?
Share this article
Newsletter registration is here
We select and publish important news every day
For inquiries about this article
Back Numbers


Author

Hiroyuki Sato
DENTSU CROSS BRAIN INC.
Executive Director
Completed graduate studies at Kyushu University (Ph.D. in Agricultural Sciences). Conducted research on remote sensing image analysis during graduate school. Joined Brainpad in 2008. Engaged in a wide range of projects as a Project Manager and Data Scientist. Appointed Director of Qubital Data Science in 2014 (concurrent position). Served as Associate Professor in the Department of Management Information Systems, Faculty of Business Administration, Tama University from 2016 to 2019, later becoming a Visiting Professor. Currently serves as Head of the CrossBrain Promotion Department, Business Management Division at BrainPad. Authored "Data Scientist Training Handbook" (co-authored, Gijutsu-Hyohron Co., Ltd.) and "Decision-Making and Data Science in the AI Era" (solo-authored, Tama University Press).