Note: This website was automatically translated, so some terms or nuances may not be completely accurate.
Don't miss the peak sales period! Predict the start of the season and peak times using big data.
"If only we could know in advance when products start selling or when sales peak, we could maximize the effectiveness of our advertising campaigns!"
Have you ever thought this?
Seasonal products like antiperspirants and sunscreen, which are purchased relatively infrequently throughout the year, experience concentrated demand during specific seasons. However, the timing of the season start and peak fluctuates each year and varies by region due to factors like climate.
Therefore, when designing advertising campaigns for seasonal products, the use of so-called "big data" is becoming increasingly common. By leveraging various big data sources to predict the seasonal start and peak periods for each region in a given year, companies can launch advertising campaigns precisely when products are selling well.
In this article, Tatsuro Ito from DENTSU CROSS BRAIN INC., a team member of the demand forecasting consulting service "Michishiro," introduces how big data is used to predict the optimal sales window.
Press Release:Launch of "Michishiro," a Consulting Service Utilizing Demand Forecasting
<Table of Contents>
▼Missing the Seasonal Start and Peak for Seasonal Products Means Lost Opportunities
▼What Are the 3 Key Points for Predicting the "Selling Window"?
▼Leveraging "Selling Window" Predictions from Pollen Data in Advertising Campaign Design!
▼Not Just Seasonal Products! Capturing Business Opportunities with Big Data
Missing the season start and peak for seasonal products means lost opportunities
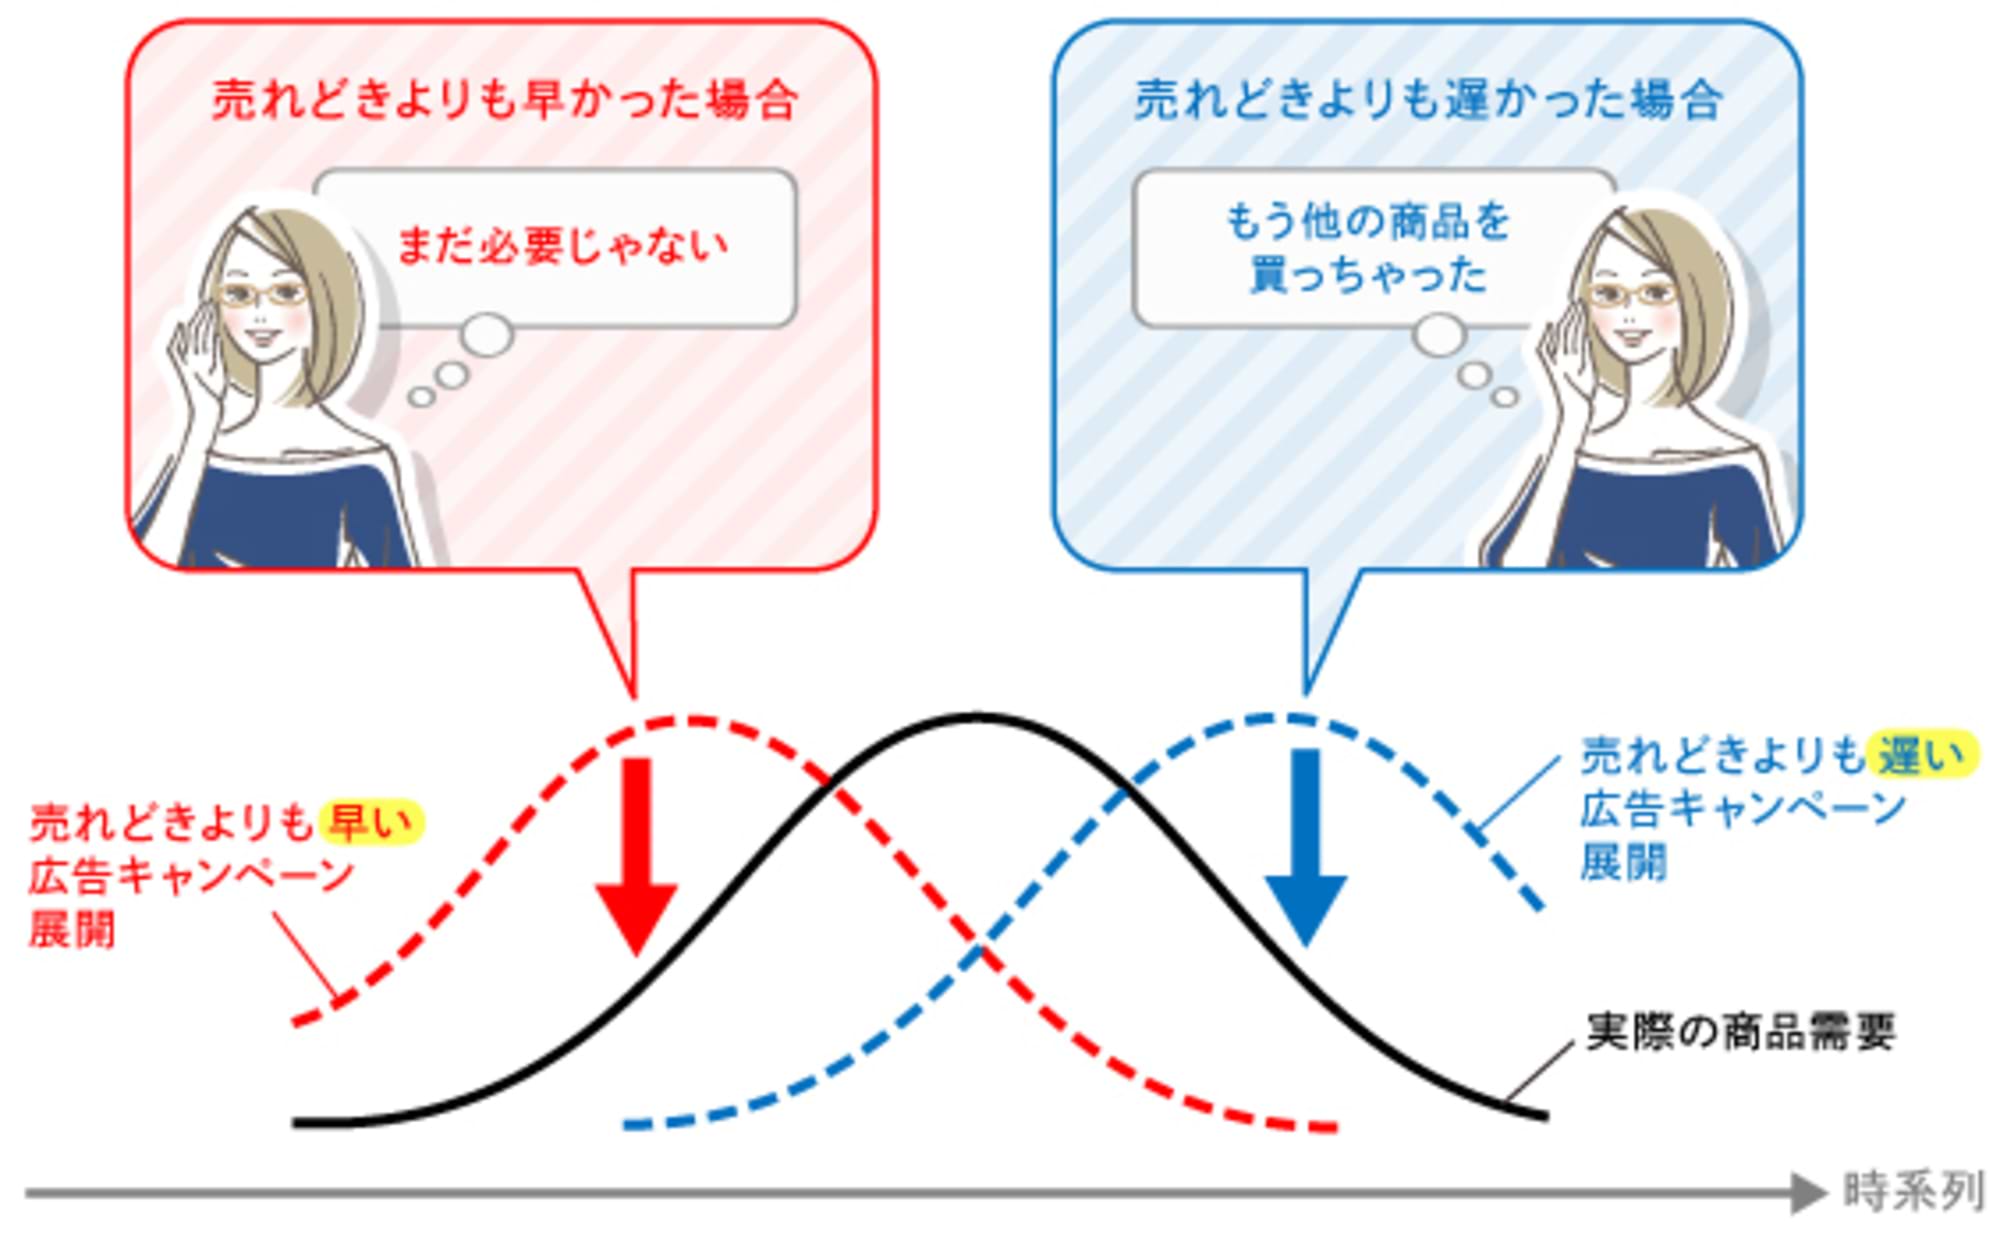
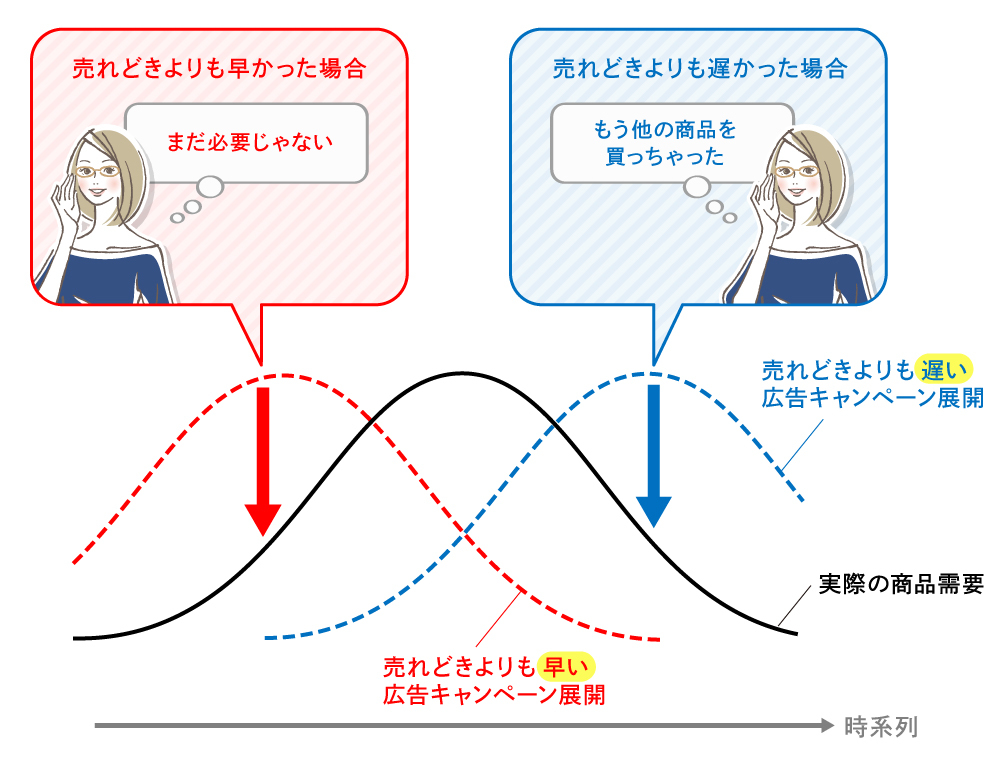
Ideally, advertising campaigns for sales promotions should be launched in sync with rising demand.
Launching campaigns during the "period when products generally start selling and sales increase" allows you to boost mindshare precisely when sales are highest. Combined with in-store displays, this can effectively drive targeted purchasing behavior.
Conversely, launching advertising campaigns outside the period of rising demand fails to shape the desired purchasing behavior, resulting in missed opportunities.
For example, launching a campaign too early means consumers encounter ads before demand has materialized, making the ads more likely to be ignored. Conversely, launching too late risks missing the window to capitalize on demand through advertising.
Furthermore, if competitors launch advertising campaigns during your product's peak sales period, they may capture purchases, making it difficult for your product to be bought during that season.
Seasonal products like over-the-counter allergy medicine, antiperspirants, and sunscreen, in particular, require advertising campaigns timed precisely for the start of the season or its peak (the prime selling period). This is because the annual purchase frequency per person is relatively low.
This is where the utilization of so-called big data becomes crucial.
At Michishiro, we predict the start of the season and the peak sales period by leveraging a wide variety of data, including purchase history, advertising spend, TV programming, social media, and other unique time-series data. In particular, "weather data" is useful for accurately predicting the "peak sales period" for seasonal products.
What are the three key points for predicting the "peak sales period"?
One method to predict the period when demand for seasonal products increases involves analyzing the relationship between the sales data of the "target product" and the "predictive factors" believed to influence sales. This leads to constructing a relationship formula that predicts sales based on these factors.
Building this relationship equation is called "forecasting modeling."
Since 2018, Dentsu Inc. has collaborated with the Japan Meteorological Association to conduct various research and development projects aimed at utilizing meteorological data for marketing decision-making.
The meteorological data held by the Japan Meteorological Association allows access to various elements such as weather, temperature, humidity, precipitation, snowfall, wind direction, and wind speed. This data is available at resolutions ranging from 1 km to area-wide coverage, and with time granularity from hourly to weekly intervals.
By utilizing this vast meteorological data for modeling, we can achieve predictive models that enable highly accurate decision-making in marketing.
Through these efforts, three key innovations and know-how are becoming increasingly practical.
● Point 1: Reflecting Market Impact (Market Size)
Consider predicting product sales across five distinct areas (districts) using weather data.
Using either "weather data from a single representative location within the area" or "a simple average of weather data across the five areas" for demand forecasting can lead to errors in the relationship between factors and results, as it fails to account for each district's "market size."
Therefore, to accurately gauge demand size, we utilize "population-weighted weather data" that incorporates the market size within the target area. This is "weather data averaged across the five areas, weighted by urban population."
"Population-weighted weather data" shows a higher correlation with sales than representative location data or simple average data, enabling a clearer relationship between the forecast target (expected sales volume) and the forecast factor (weather data).
By using weather data that incorporates market impact to gauge demand size, we can more accurately detect and predict the optimal sales timing.
●Point 2: Granularity of the Forecast Area
To predict the "optimal sales timing" more accurately, setting the granularity—i.e., the area unit size for demand forecasting—is also crucial.
Generally, the finer the forecast area, the greater the expected improvement in campaign effectiveness; however, this requires sufficient data to support such granularity.
Therefore, we utilize weather information and related meteorological data from approximately 1,800 forecast locations nationwide provided by the Japan Weather Association to perform forecasts at more granular area units tailored to specific objectives.
By subdividing the forecast area, we can reflect the differences in the start of the season and peak timing for each area in our strategies and determine the timing for launching advertising campaigns.
For example, when determining the run period for TV commercials, we forecast the "peak sales period" for each broadcaster's coverage area and schedule TV commercials to coincide with the peak sales period for each specific area.
●Point 3: Timing of Predictions
When planning TV commercials, ad slots are typically booked several months in advance. Therefore, to launch TV commercials aligned with peak sales periods, it is necessary to predict the "peak sales periods several months ahead" at the time of booking.
Dentsu Inc. utilizes weekly weather forecast data from the Japan Weather Association to make weekly forecasts up to 15 weeks in advance. This allows us to capture seasonal demand trends for each area, supporting the implementation of advertising campaigns that hit the "peak sales period" without fail.
We set the TV commercial run period based on the forecasted peak sales period. Then, in collaboration with broadcasters, we adjust ad placements and volumes in response to actual weather changes during the campaign period. This provides operational support ( ) to help achieve the most effective results.
Leveraging pollen dispersion data to predict "peak sales periods" for advertising campaign design!
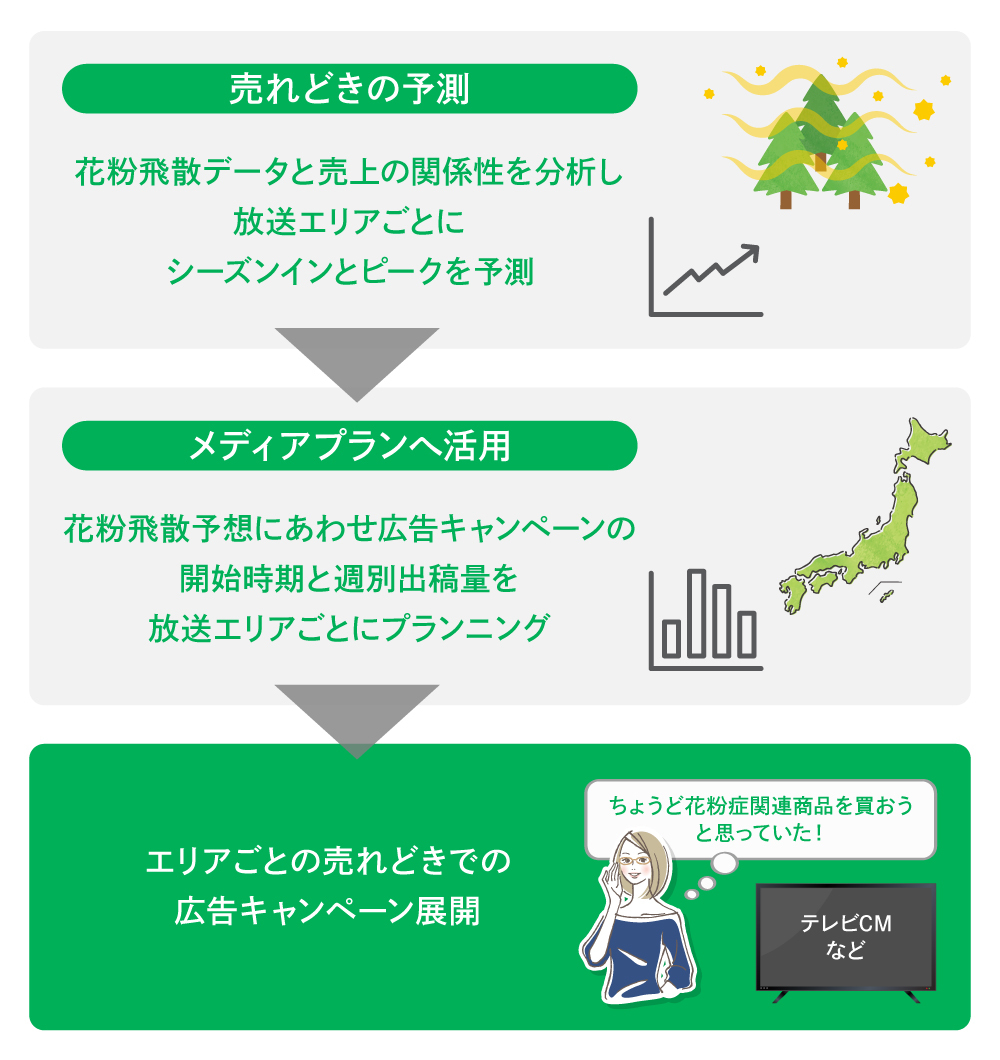
Here's a case study of a hay fever-related product where we used actual weather data to predict "peak sales periods" by area and launched advertising campaigns aligned with those periods.
Originally, campaign periods for this product were designed using "historical pollen dispersion trends" (assuming uniformity nationwide). However, subsequent analysis revealed that differing pollen dispersion conditions across regions significantly impacted sales.
Therefore, to launch advertising campaigns during the periods when consumers in each area were most likely to purchase the product based on pollen dispersal conditions, we collaborated with the Japan Meteorological Association to create a model predicting the optimal sales timing and pollen dispersal levels for each specific area.
By inputting the latest weather forecast data into this prediction model, we forecast weekly pollen dispersal levels for each area. This enabled us to design the duration and volume of advertising campaigns.
Typically, TV ads are ordered several months in advance of the broadcast period. Ordering based on daily forecasts at that stage is impractical due to accuracy limitations. By shifting the forecast frequency from daily to weekly, we improved prediction accuracy to a practical level. Aligning the campaign period closer to the actual "peak sales window" drove increased sales.
Not limited to seasonal products! Capturing business opportunities using big data
Being able to predict a product's "peak sales period" like this not only enables the deployment of TV commercials and promotional campaigns aligned with rising demand, but also opens possibilities for application beyond advertising campaigns, such as in production planning and staffing plans.
Furthermore, beyond seasonal products, even for year-round items, there is a growing trend of concentrating advertising spending on "specific weather conditions where advertising campaigns significantly boost sales contribution."
To maximize the effectiveness of initiatives using predictive models, it is crucial to carefully design the volume, type, and granularity of the data used according to the specific objective.
While predicting the "optimal selling moment" with 100% accuracy remains challenging, we believe there is value in using data to get closer to the right answer, thereby capturing purchasing opportunities that might otherwise be missed.
Identifying meaningful data from vast amounts and seizing business opportunities (i.e., not missing them) will become one of the key sources of competitive advantage going forward.

Was this article helpful?
Share this article
Newsletter registration is here
We select and publish important news every day
For inquiries about this article
Author

Tatsuro Ito
DENTSU CROSS BRAIN INC.
analyst
We drive end-to-end marketing strategy planning and implementation—from identifying challenges through data-driven insights to solution development and effectiveness verification—while advancing marketing sophistication through the use of Data Clean Rooms and demand forecasting.