Note: This website was automatically translated, so some terms or nuances may not be completely accurate.
Pricing Strategy in an Era of Price Increases. The Key is "The Price in the Consumer's Mind"
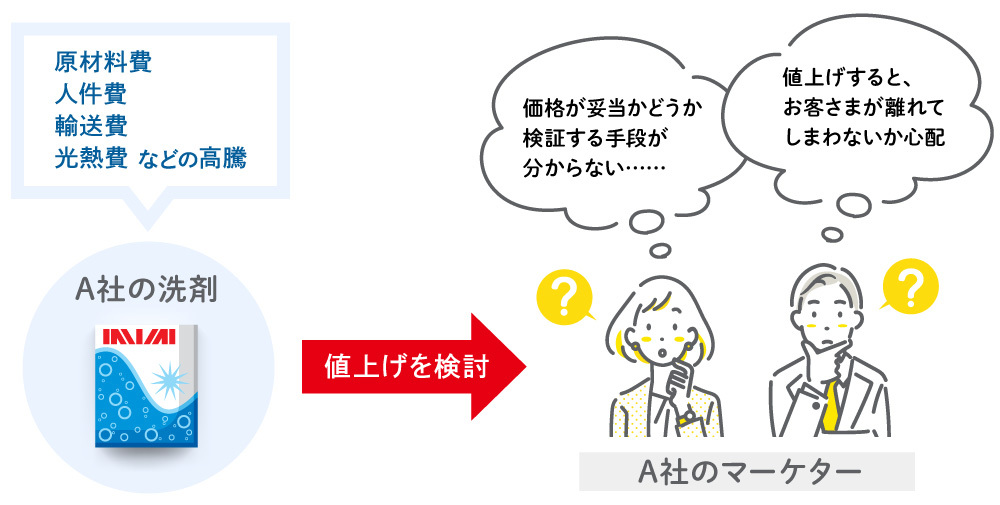
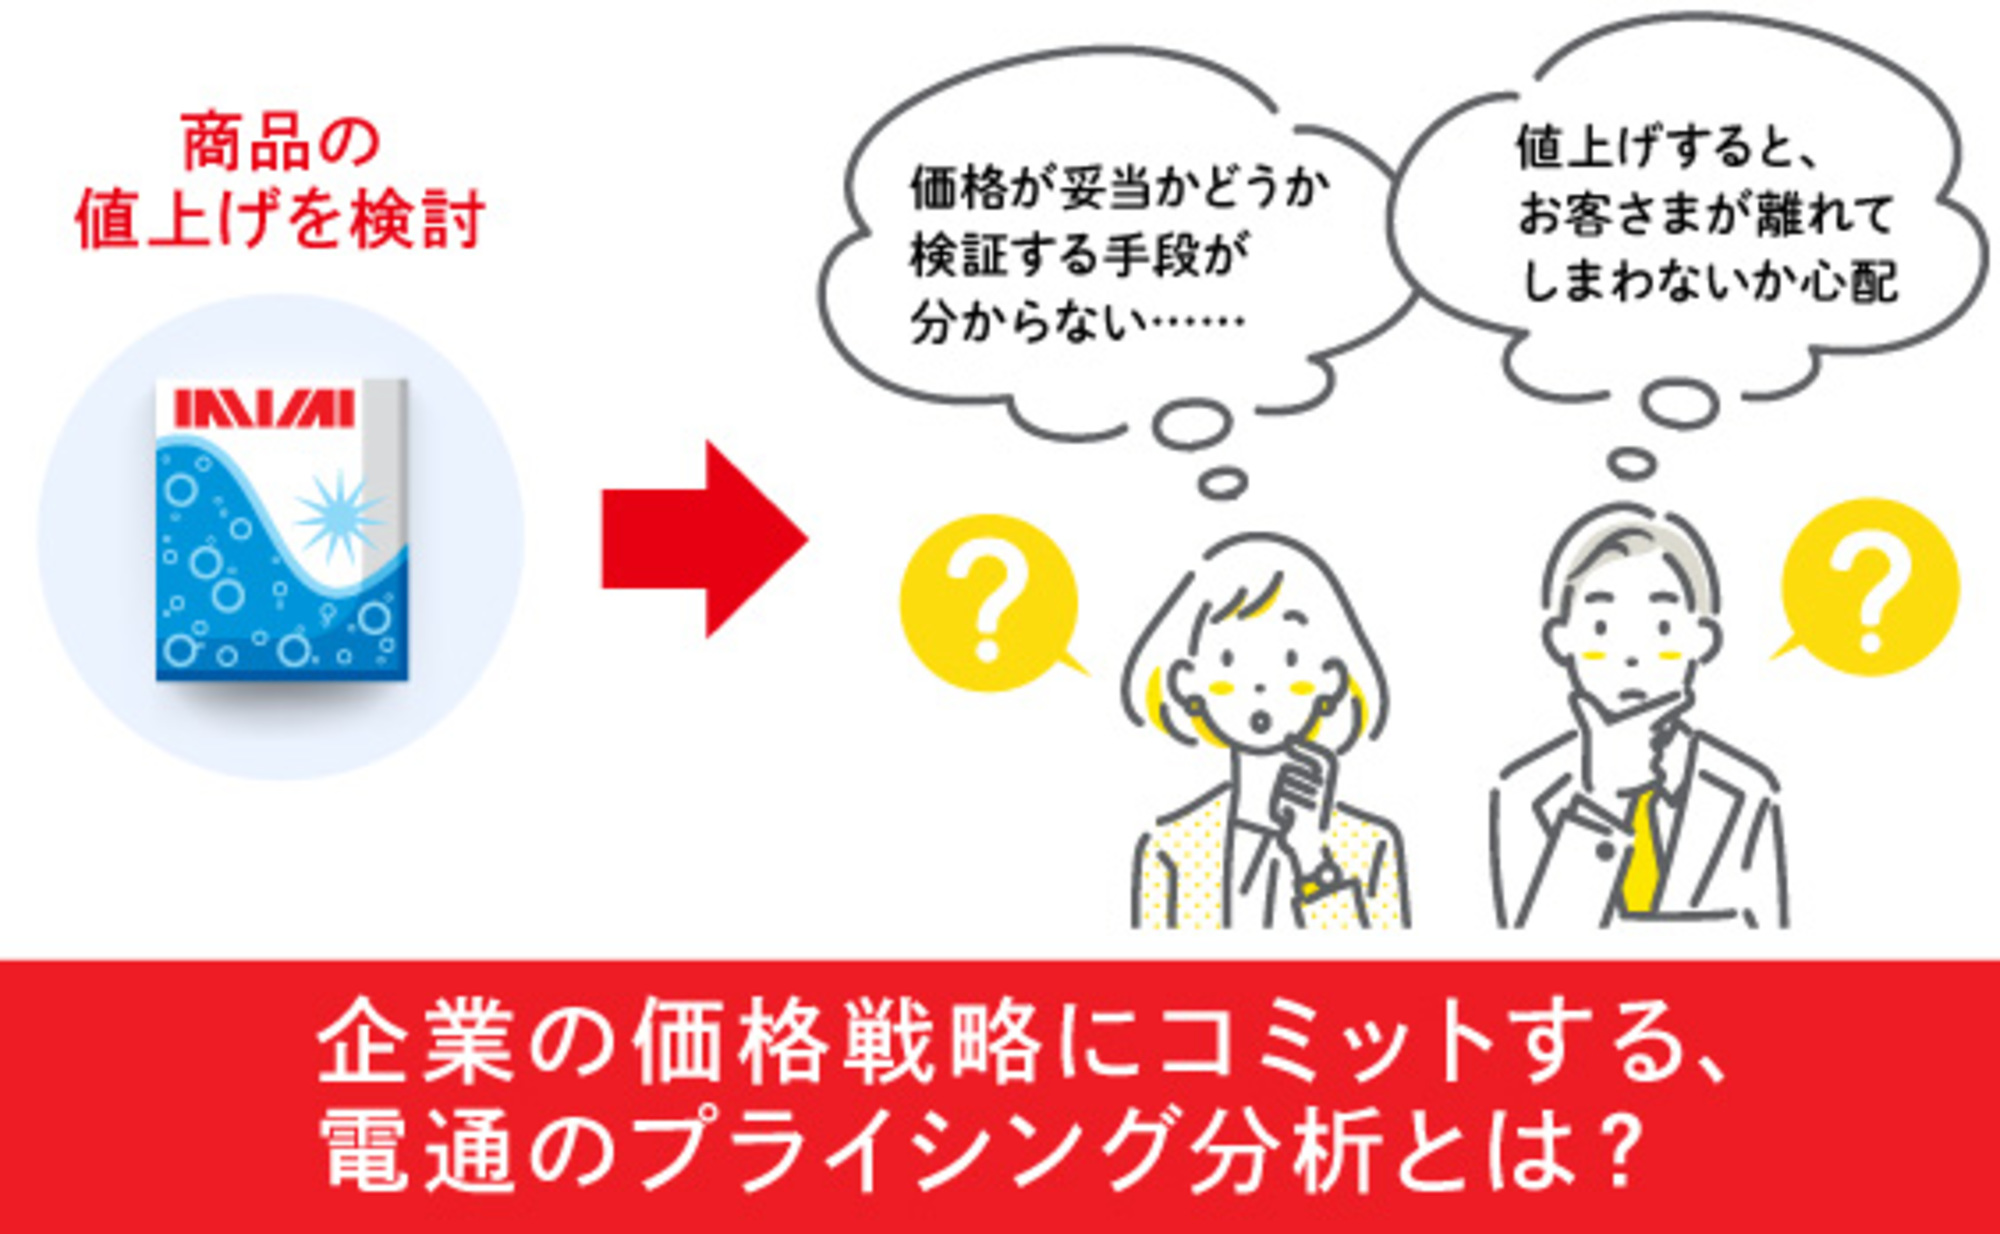
Against a backdrop of rising raw material and labor costs, many companies are considering or implementing price increases for their products and services. This has brought increased focus on "Price," one of the four marketing elements (Product, Place, Promotion, Price).
In January 2025, Dentsu Inc. launched "Marketing For Growth With Pricing" (MGP), a service that analyzes and scientifically approaches pricing ( see release here ).
In short, MGP focuses on "the price consumers envision for a product or service" and "analyzes how much a company should sell its products for."
This article explains three key points about the MGP service.
<Table of Contents>
▼Key Point 1 of New Pricing Analysis: "RP" and "LP"
▼Key Point 2 of New Pricing Analysis: Analyzing the Impact of RP and LP on Demand
▼Key Point 3 of New Pricing Analysis: Visualizing the Value Contributing to RP
Key Point 1 of New Pricing Analysis: "RP" and "LP"
MGP supports pricing decisions that satisfy both companies and consumers—something traditional pricing analysis struggled to achieve—by designing prices that factor in competitor trends and visualizing the value of the products/services that make up the price.
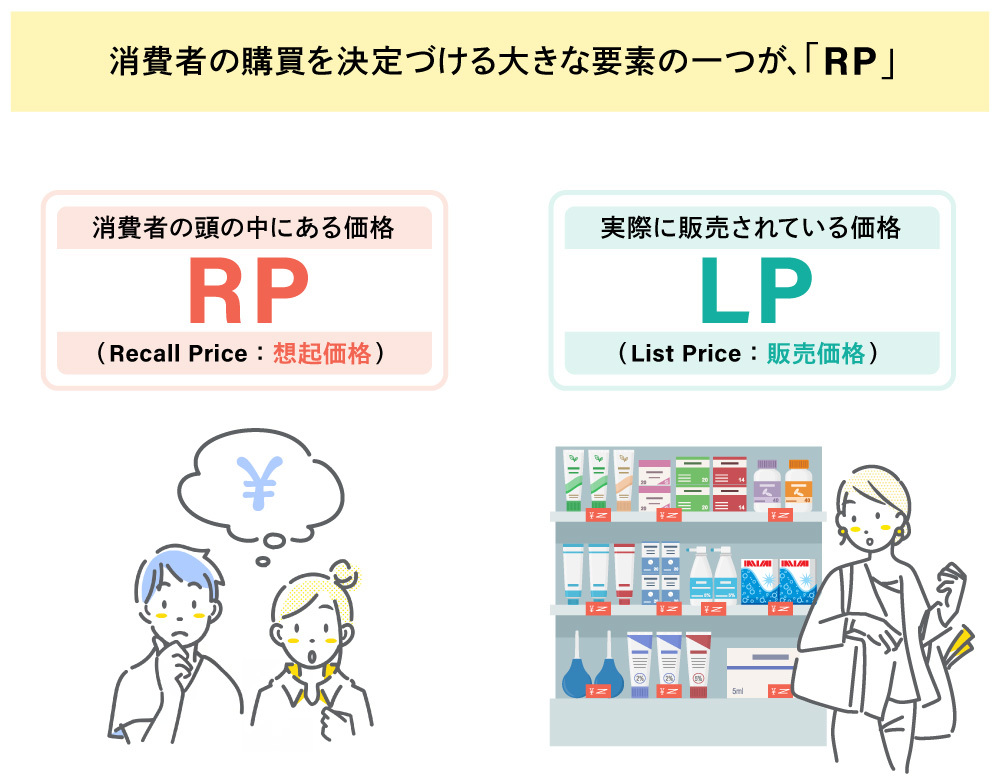
MGP conducts analysis using two metrics: "RP" and "LP". RP stands for Recall Price, which is "the price customers recall in their minds for a given product". LP stands for List Price, which is "the actual price at which a product is sold in stores".
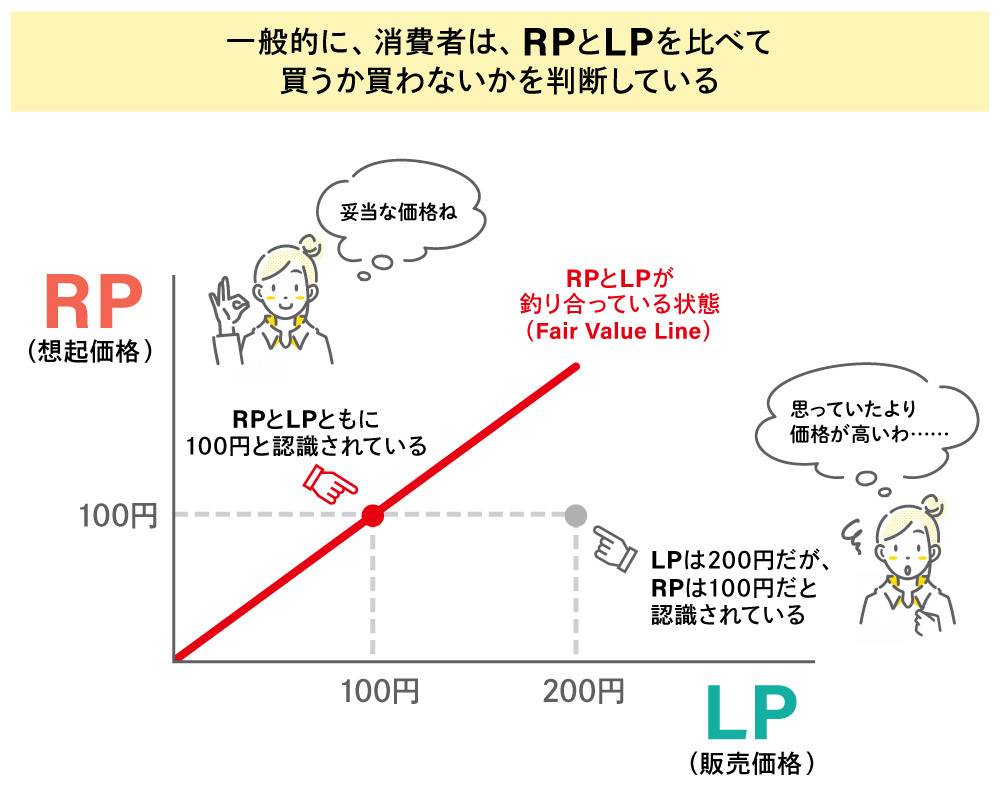
The state where RP and LP are balanced is called the Fair Value Line (FVL), represented by the red line in the graph below. By determining where your product stands relative to the FVL, you can infer how the LP is perceived by consumers. For example, if a product is sold at a price significantly higher than the consumer's imagined price (RP: ¥100), such as an LP of ¥200, it becomes more likely to drive customer churn.
New Pricing Analysis Point ②: Analyzing the Impact of RP and LP on Demand
So, how much do RP and LP influence demand? Dentsu Inc. conducted its own research across the categories of "Detergent & Fabric Softener," "Hair Care," "Ice Cream," and "Beer." Here, using the detergent/fabric softener category as an example, we present the results of analyzing the impact of RP and LP on demand using the MGP methodology (see figure below).
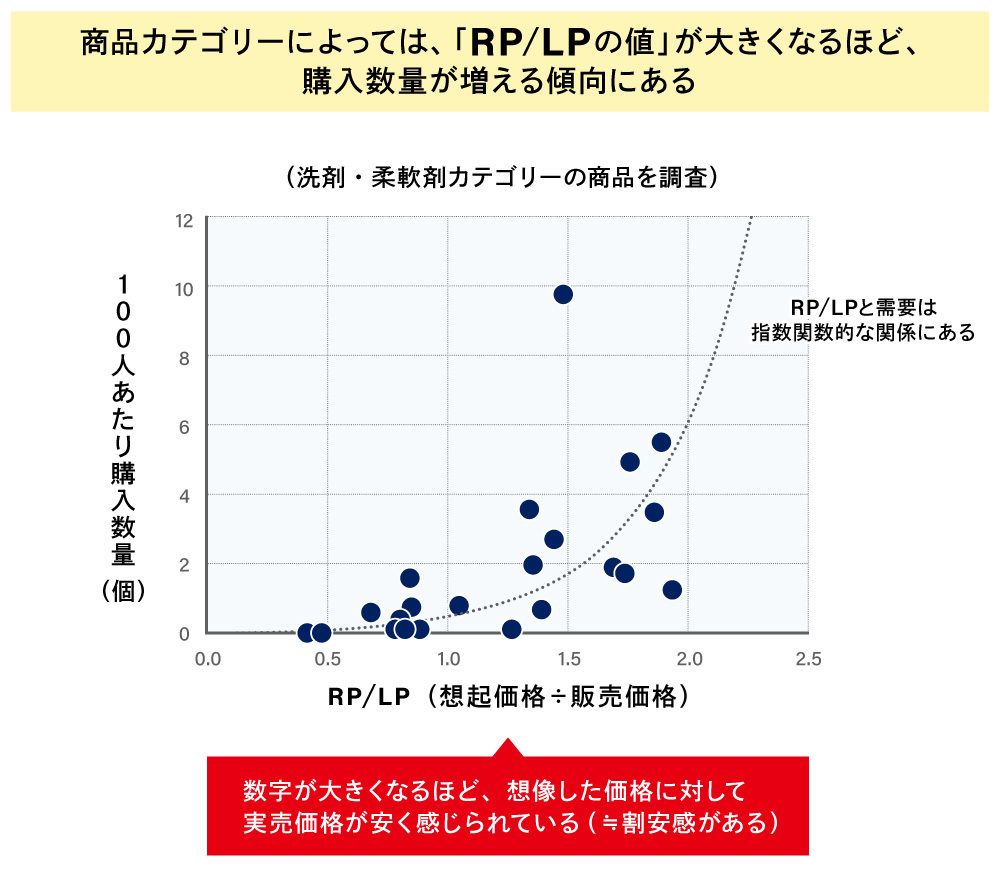
The horizontal axis of the graph represents RP/LP (higher numbers indicate that the actual selling price is perceived as cheaper relative to the imagined price ≒ greater perceived bargain). The vertical axis represents demand (purchase quantity per 100 people).
Analysis of various detergents and fabric softeners revealed that as RP/LP increases, demand grows exponentially (essentially following an equation). This enables predicting the impact on demand and sales when LP is changed.
For example, increasing LP lowers RP/LP, allowing us to estimate the expected decline in demand based on the magnitude of that decrease. We can also multiply demand by LP to calculate projected sales.
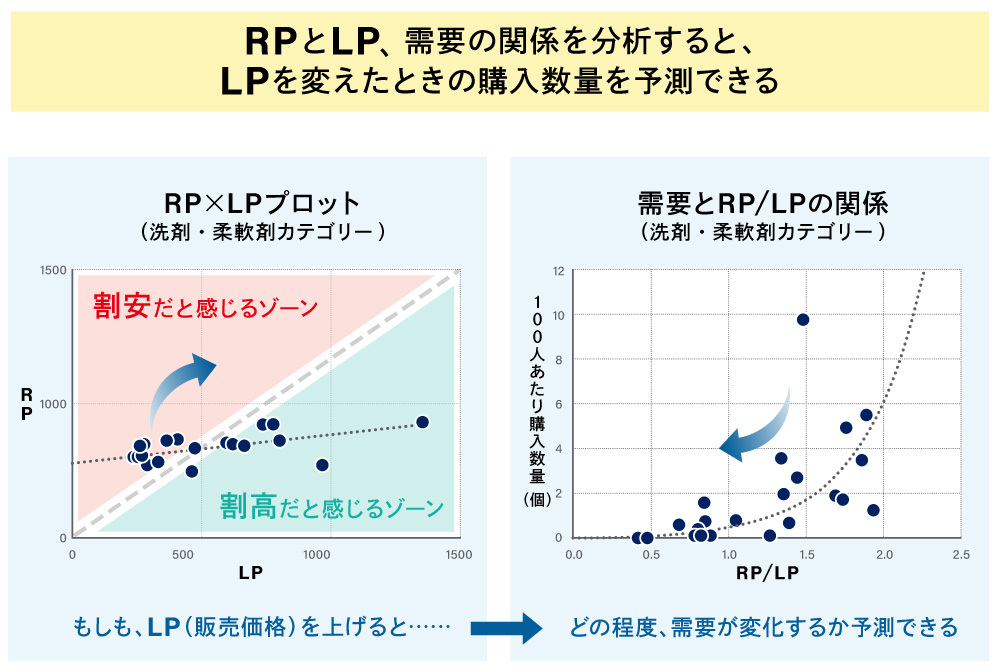
This analysis enables the "price design considering competitor trends" mentioned at the beginning, potentially leading to more valid pricing decisions ( ).
Key Point 3 of New Pricing Analysis: Visualizing Value Contributing to RP
How is RP determined in the first place? MGP identified the emotional and functional evaluation value consumers hold for a brand as a determining factor for RP and verified its correlation with RP (*).
*Verification method: Hierarchical Bayesian modeling was implemented to calculate regression equations and contribution levels for each evaluation value. Hierarchical Bayesian Modeling: A modeling technique that captures both common trends and group/sample-specific characteristics when data varies across groups or samples. Parameters and their prior settings are expressed probabilistically, enabling estimation that accounts for data uncertainty, thereby improving accuracy and preventing overfitting.
Analysis revealed the extent to which "emotional value" and "functional value" influence RP. For example, in the detergent/fabric softener category, RP is composed of 6 emotional value items and 2 functional value items.
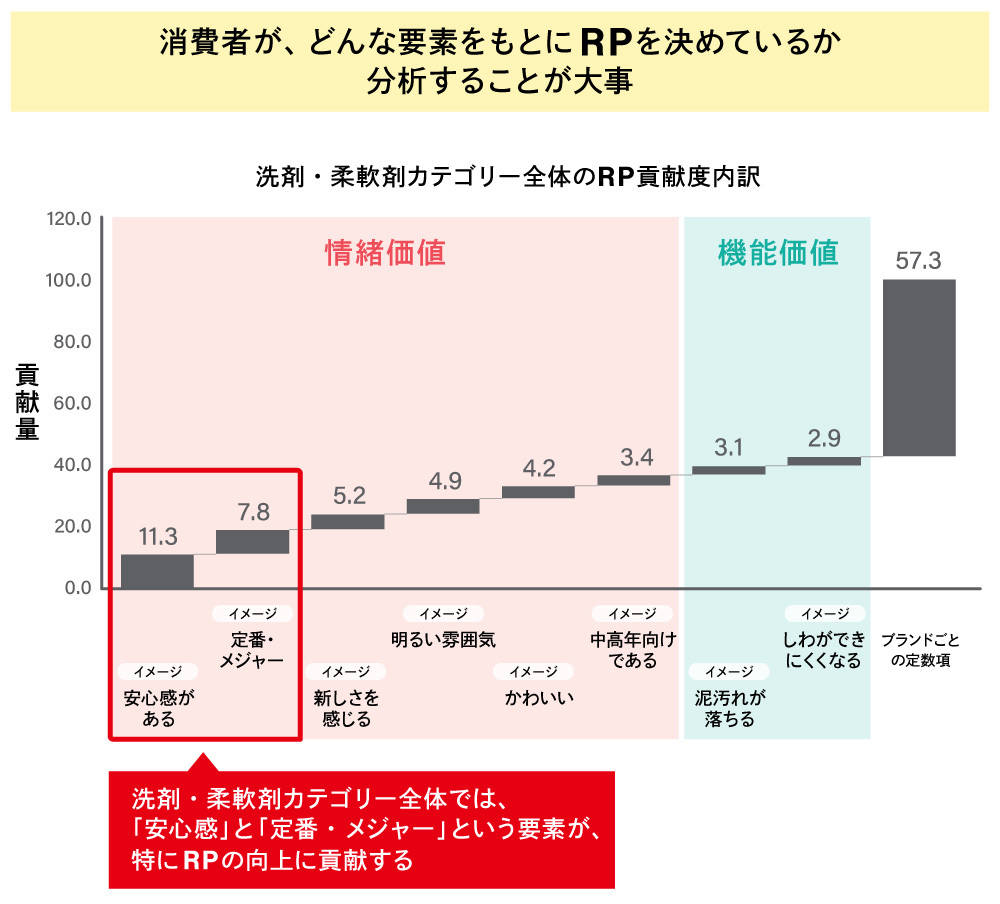
Among these, the emotional value items "Sense of Security" and "Standard/Major" showed a high contribution to RP for the category as a whole. This suggests that effectively appealing to these items in the detergent and fabric softener category is likely to lead to improved RP.
Furthermore, even within the same category, the contribution level per value differs depending on the product brand. The graph below summarizes the differences in value-specific contribution between Products A and B.
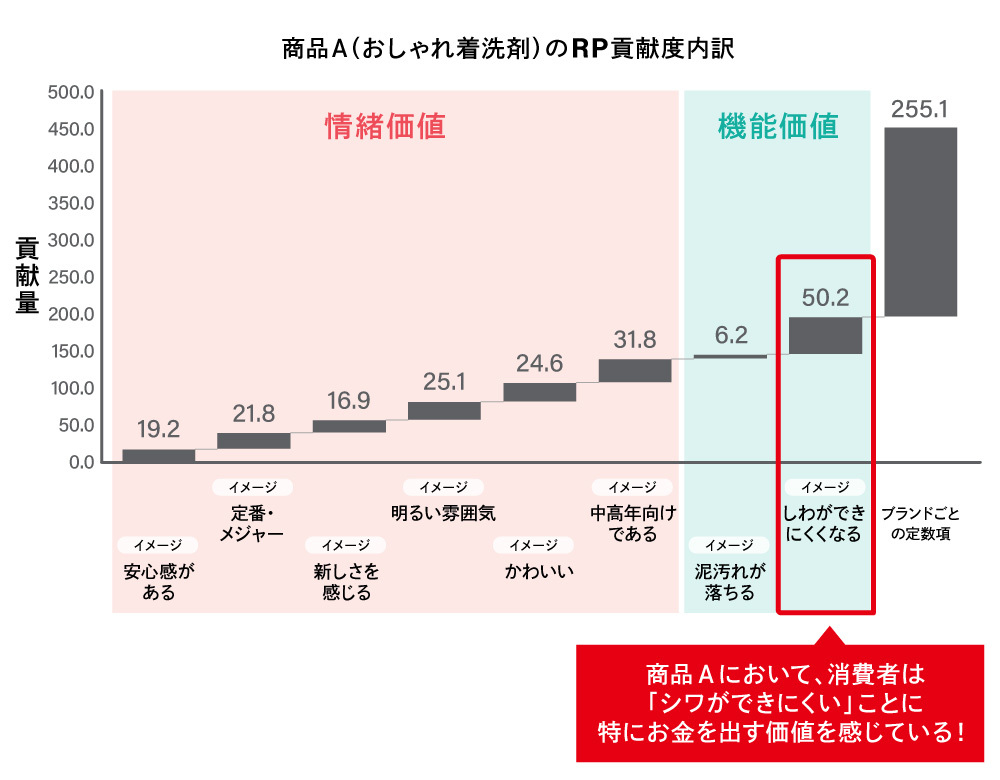
Product A shows a high contribution to RP from the functional value "reduces wrinkles." While A is a detergent for delicate clothing, it is inferred that consumers particularly perceive value in paying for the "reduced wrinkles" benefit.
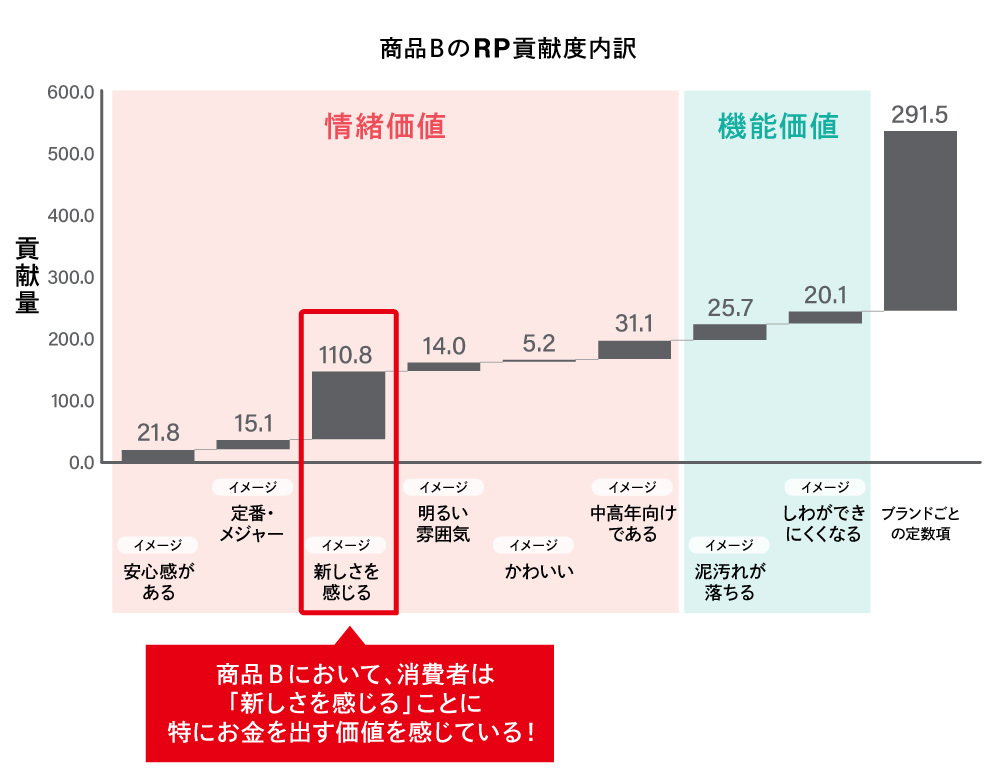
Conversely, for Product B, the emotional value "feeling newness" significantly contributes to RP.
Thus, we observe cases where the key points for boosting RP differ by product brand. Therefore, in addition to category-wide trends, it is necessary to identify the unique characteristics of each product brand and advance initiatives aimed at raising RP.
For concrete actions to raise RP, for example, with Product A, consistently emphasizing "reduced wrinkling" through advertising and in-store promotions could further strengthen its contribution to RP. When considering such messaging, it's also necessary to evaluate whether it compromises important category-wide elements like reassurance or being a staple.
"Visualizing the value of products and services that constitute the price" appears valuable not only when considering ways to raise RP but also during price revisions. For instance, when announcing a price increase, simply stating "We are raising prices due to rising raw material costs" versus communicating "We are raising prices to protect the value that contributes to RP" can significantly alter consumer perception.
In this way, leveraging this analysis to deliver consistent value propositions within communication efforts helps build brands that consumers love and are willing to pay for with conviction.
Pricing is an area where companies have long engaged in trial and error, yet the formalization of these efforts remains limited. Consequently, many businesses likely struggle with validating the appropriateness of their prices. As one solution to this challenge, we encourage you to consider "Marketing For Growth With Pricing." This approach unravels the prices in consumers' minds and provides accompanying support for communication that elevates those perceptions.
【Contact for "Marketing For Growth With Pricing"】
Email: dentsu-pricing@dentsu.co.jp
【Survey Overview】
・Purpose: Using RP as an indicator to understand the positioning of products/services and their competitive advantage within the same price range
・Content: Investigate the relationship between the price consumers recall (RP) for products/services they intend to purchase and the factors influencing it, while considering emotional and functional evaluation values toward the brand as components. ・Target Area: Nationwide, Japan
・Subject Criteria: Ages 20–69
・Sample Size: 30,000 (※)
・Survey Method: Online survey
・Survey Period: June 19–30, 2024
・Survey Agency: Dentsu Macromill Insight, Inc.
*Weighted back to match the sex and age composition ratio of the population (R2 Census). Total survey sample size: 30,000. Purchasers were extracted from each category, and then respondents were surveyed among those aware of each brand. 1,200 samples per category × 4 categories = 4,800 samples collected.

Was this article helpful?
Share this article
Newsletter registration is here
We select and publish important news every day
For inquiries about this article
Author

Yosuke Kitajima
Dentsu Inc.
Marketing Division 4
Planning Director
As a planner, I develop communication strategies to address various social issues in Japan, particularly for government projects. Additionally, I contribute to new product and service development in sectors such as inbound tourism, automotive, beverages, home appliances, and housing.


Takumi Katori
Dentsu Inc.
Marketing Division 8
Marketing Consultant
At my previous employer, a theme park operator, I mastered on-site operational optimization techniques and, as a business analyst in the operations department, built sales forecasting and labor control models. Subsequently, in the marketing department, I led detailed target analysis and research for ticket pricing strategies, attendance forecasting, and event promotion to achieve attendance and revenue goals before joining Dentsu Inc.


Yusuke Tsuji
Dentsu Inc.
Data Marketing Division
Senior Planner
After joining ADK in 2016, he worked as a digital marketing planner primarily on direct marketing projects, focusing on improving ROI beyond traditional advertising boundaries. In 2022, he transitioned to a consulting firm specializing in pricing. As a consultant supporting pricing decisions for products and services, he worked on pricing strategies for industries including consumer goods and sports. He later became CMO before joining Dentsu Inc.
Articles by this person

Mayu Kawashima
Dentsu Inc.
Marketing Division 3
Planner
Since joining the company, I have been involved in strategic planning across a wide range of industries, including consumer goods manufacturers, food manufacturers, fashion e-commerce, and SaaS services, working with both B2B and B2C clients. I have extensive experience developing concepts for product brands and advertising communications. I specialize in formulating strategies based on social trend analysis and target audience insights.