Note: This website was automatically translated, so some terms or nuances may not be completely accurate.
Blue Bottle Coffee Through Location Data: Part 1
I'm Akimoto, a researcher at Dentsu Inc. Human Flow Lab. I'm a newbie coffee fan who's jumped on the third wave coffee trend and enjoys drip coffee.
Speaking of third-wave coffee, Blue Bottle Coffee opened its first Japanese store in Kiyosumi-Shirakawa, Koto Ward, Tokyo, this past February. Its commitment to grinding beans upon order and brewing coffee right before your eyes has gained popularity, with the long lines—reportedly requiring hours of waiting—becoming a hot topic.
Starting this time, we'll examine the customer traffic at Blue Bottle Coffee's Kiyosumi-Shirakawa store over a three-part series, utilizing big data from mobile phone location information.
This series was created in collaboration with NewsPicks, who are serializing "Coffee 3.0." You can view NewsPicks' related articles here.
[Data in Slides] Where Did Blue Bottle Draw Its Customers From?
https://newspicks.com/news/1036877
[Data in Slides] Which age groups responded to Blue Bottle?
https://newspicks.com/news/1034236
[Data in Slides] Is Blue Bottle's Popularity Real?
https://newspicks.com/news/1033380
In this first installment, we'll examine visitor trends over the first two months since opening to identify the peak of excitement and gauge its lasting appeal.
Setting conditions for aggregating location-based big data
First, let's explain how the location-based big data was aggregated. For this analysis, we utilized Mobile Spatial Statistics data with the cooperation of Docomo Insight Marketing, Inc.
Mobile Spatial Statistics is statistical information on estimated population, broken down by gender, age group, and residence, collected 24 hours a day, 365 days a year, using NTT DOCOMO's mobile phone network infrastructure. With a sample size of approximately 65 million contracts nationwide, it is one of Japan's largest location-based big data sources. It provides hourly population counts (people per hour) and enables analysis that considers dwell time (passers-by and those who stayed are not counted identically).
Setting the aggregation area to the vicinity of Blue Bottle Coffee Kiyosumi Shirakawa (hereafter, the Blue Bottle Coffee area), we examine the number of visitors per hour.
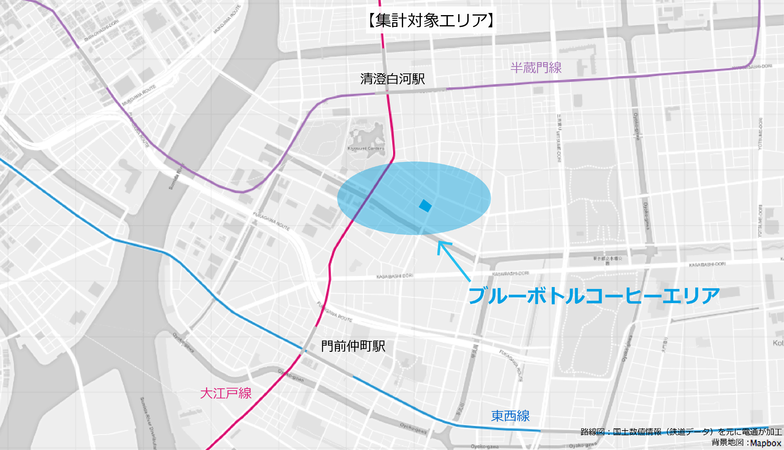
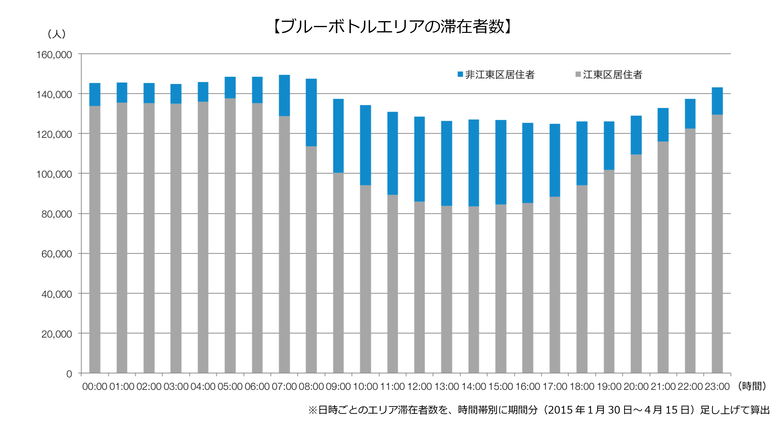
Lacking large commercial facilities nearby, the Blue Bottle Coffee area exhibits residential characteristics.
Most visitors are local residents of Koto Ward, creating a pattern where people leave during the daytime and return at night.
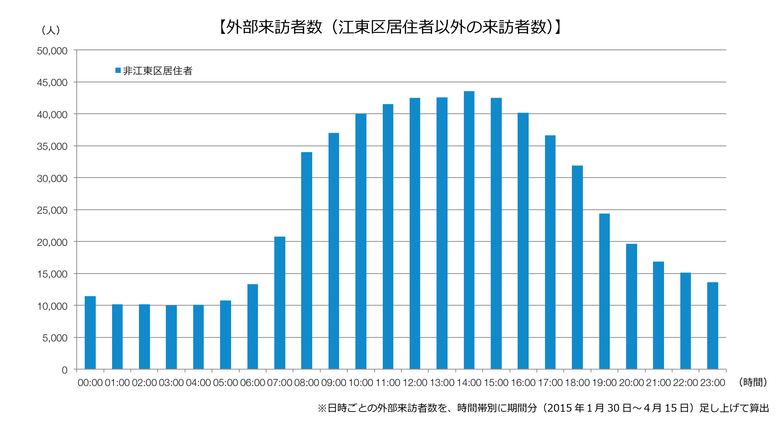
Here is a graph showing the number of visitors in the area minus Koto Ward residents.
This makes the external inflow trend easier to see.
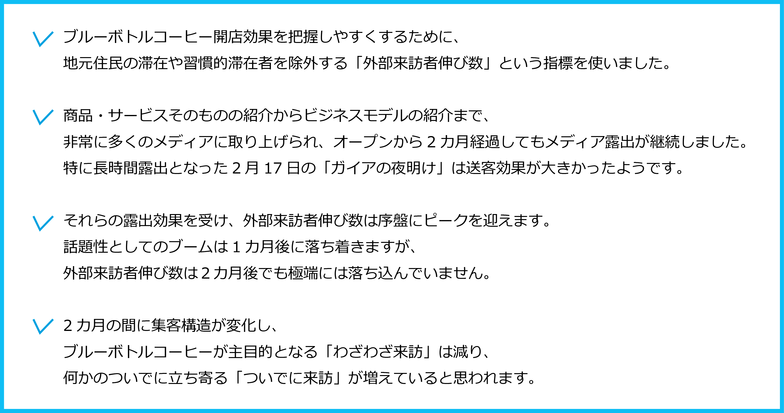
To better understand the Blue Bottle Coffee opening effect, we will exclude local Koto Ward residents from the count and examine how many non-local visitors (i.e., external visitors) were attracted.
Note that external visitors include people who "have no connection to Blue Bottle Coffee and habitually visit the area for work or other reasons."
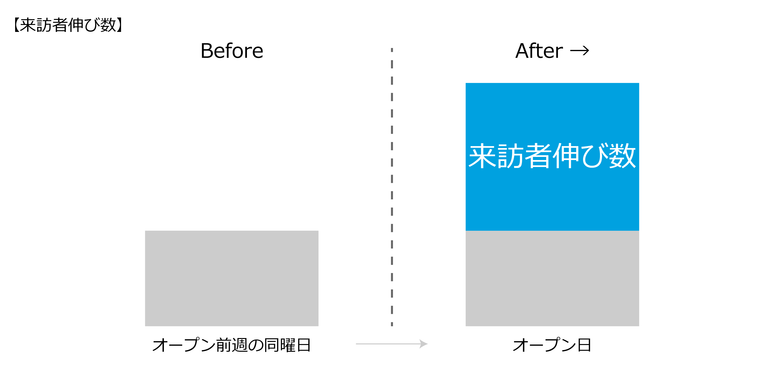
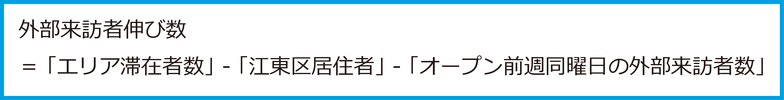
To exclude these individuals, we will calculate the difference between the same day of the week before opening and the same day after opening, measuring the Blue Bottle Coffee effect as the net increase in visitors.
Maintaining strong customer attraction even after two months
Now, let's examine the trend in the growth rate of external visitors every Friday from the opening day, February 6 (Friday), to two months later, April 10 (Friday).
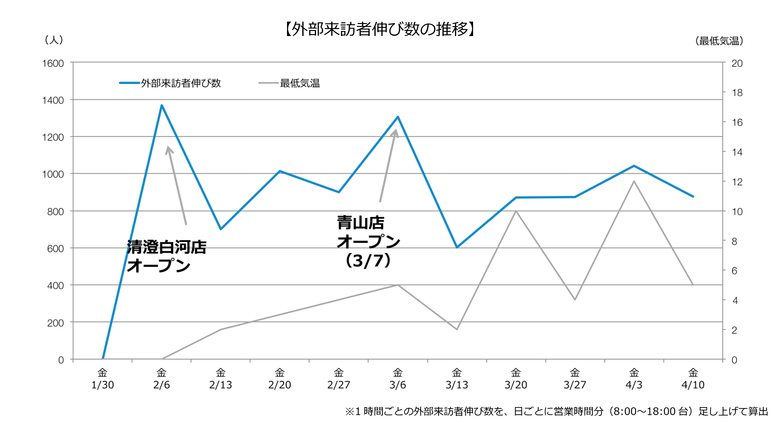
Significant peaks occurred on February 6 (the opening day of the Kiyosumi-Shirakawa store) and March 6 (the day before the Aoyama store opened). While showing a gradual downward trend, even two months later, it maintained over 60% of the opening day's level.
The increase in external visitor growth after March 20th is likely influenced by improved weather.
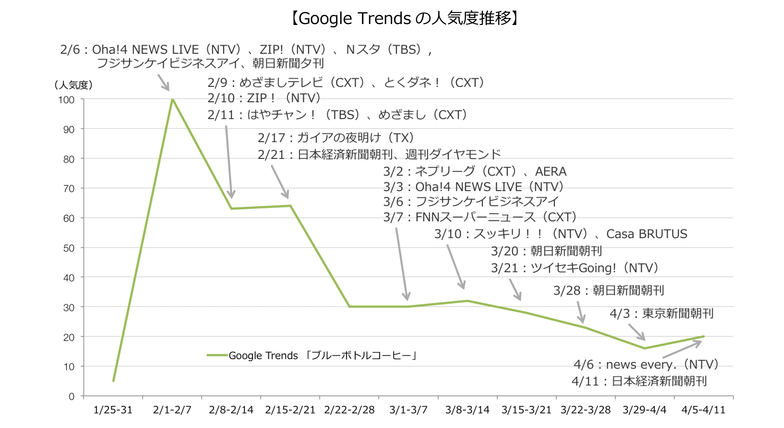
The graph above shows the popularity trend for "Blue Bottle Coffee" on Google Trends. We also plotted major Blue Bottle Coffee-related exposures (TV, newspapers, magazines).
While a concentration of exposure early on is a common trend, a distinctive feature here is the sustained coverage from a very large number of media outlets. These media exposures served as sources, leading to numerous related posts being shared online.
Beyond information about the service itself, such as "huge lines," "a cup made with meticulous care," and "stylish interior," many articles also covered business aspects like "the Apple of the coffee industry," "a strategy contrasting with Starbucks," and "the owner was influenced by Japanese culture." This focus on business elements likely contributed to the sustained exposure.
Google Trends popularity measures "how frequently it was searched," with search volume at the end of February reaching about 30% of its peak. While exposure continued afterward, it seems the frenzied boom subsided roughly one month after opening.
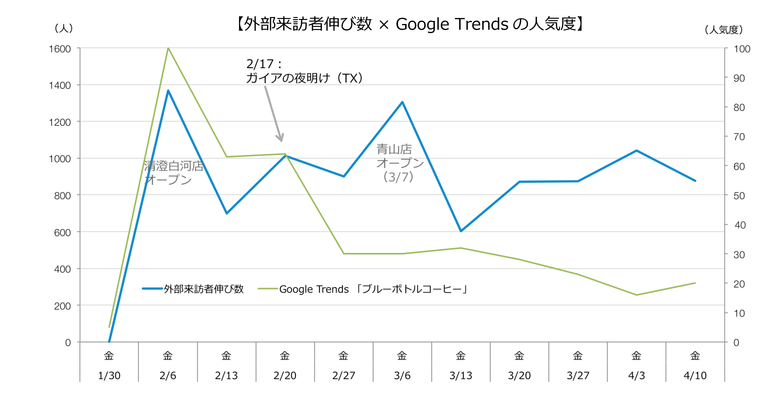
Overlaying external visitor growth with Google Trends data reveals that external visitor growth did not decline as sharply as the Google Trends downtrend. It appears that the segment waiting for the initial frenzy to subside began visiting, coinciding with rising temperatures.
Furthermore, on February 17th, Blue Bottle Coffee was featured for nearly 20 minutes on the TV program "Gaia no Yoake," generating numerous tweets. External visitor numbers saw a significant increase on February 20th, indicating a substantial effect.
Shift from "Deliberate Visits" to "Incidental Visits"

This graph shows the trend of the maximum (highest) and minimum (lowest) external visitor counts during operating hours (8:00 AM to 6:00 PM). While the maximum count shows a downward trend, the minimum count shows an upward trend, suggesting a gradual increase in the fan base.
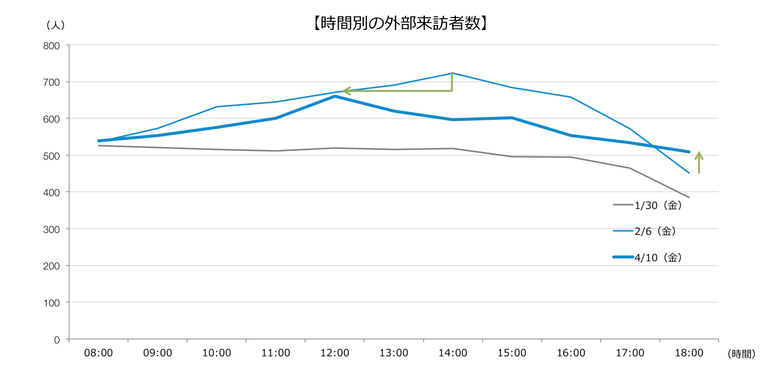
Regarding the maximum value, it's not just decreased; the time slot has shifted from the 2:00 PM range to the 12:00 PM range. Furthermore, the number of visitors during the minimum value period, just before closing at 6:00 PM, has increased. This suggests a decrease in "dedicated visits" from far away specifically for Blue Bottle Coffee, and an increase in "impromptu visits" during lunch or on the way home.
Summary
What did you think of this look at Blue Bottle Coffee through location-based big data?
Below is a summary of this analysis.
Next time, we'll delve deeper into how the customer acquisition structure evolved by examining the gender, age, and residential attributes of external visitors.
NewsPicks NewsPicks offers original articles created by Japan's top infographic editors, providing business-relevant information in an easy-to-understand format.
Mobile Spatial Statistics are population statistics created using NTT DOCOMO's mobile phone network infrastructure. "Mobile Spatial Statistics" is a trademark of NTT DOCOMO.

Contact: Dentsu Inc. Human Flow Lab
contact@hitononagarelab.jp

Was this article helpful?
Share this article
Newsletter registration is here
We select and publish important news every day
For inquiries about this article
Author

Ken Akimoto
Dentsu Inc.
Data Technology Center Geodata Solutions Department
After working at a major automaker's marketing subsidiary, joined the company in 2001. Expanding domains: Sales → New Business Development → Creative → Data Business. In 2018, launched a department solving client marketing challenges using location data, providing data-driven marketing services with "Data × Communication Design" as its strength. Awarded at ADFEST / Spikes Asia / D&AD / OneShow / JAA Consumer-Selected Advertising Contest / ACC Tokyo Creative Awards.