Note: This website was automatically translated, so some terms or nuances may not be completely accurate.
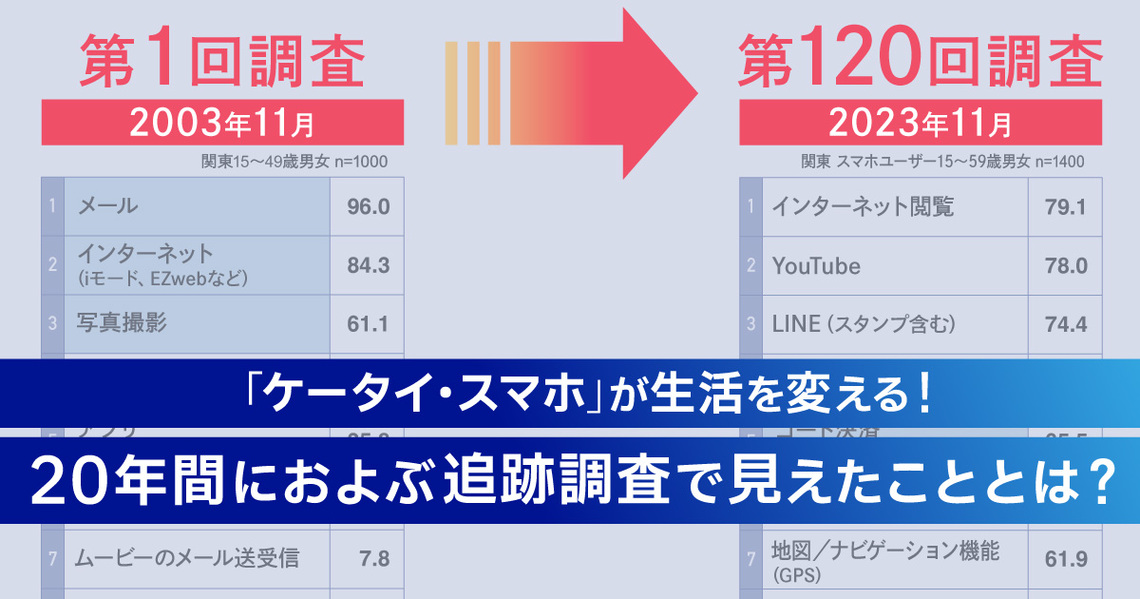
Mobile Phones and Smartphones in Daily Life: Insights from a 20-Year Tracking Study
I am Kentaro Yoshida, founder of the Future Business Research Institute(※) and leader of the Dentsu Inc. Mobile Project.
※Future Business Creation Lab: A cross-organizational group within the Dentsu Group that supports corporate business creation and transformation by visualizing the future. https://dentsumirai.com/
This series introduces Dentsu Inc.'s mobile market tracking survey, conducted over 20 years and totaling 120 times, and the resulting insights into changes in consumer attitudes and behaviors.
Dentsu Inc.'s tracking survey, which captures the realities of the mobile phone (here referring to legacy mobile phones, not smartphones) market and the smartphone market, began in November 2003. It has been conducted six times annually without fail, reaching its 20th anniversary in the fall of 2023. Through these 120 surveys, we have observed not only trends in the mobile market but also changes in consumers' lives driven by the proliferation of mobile phones and smartphones.
This time, we look back at how the shift from feature phones to smartphones progressed and how people's lives changed, starting from the situation in November 2003 when the survey began.
*Unless otherwise noted, figures in this article are based on the Dentsu Inc. Mobile Project tracking survey.
<Table of Contents>
▼How Mobile Phones and Smartphones Transformed Daily Life
▼Have Monthly Communication Fees Truly Become Cheaper by 2023?
▼How Have Mobile Device Functions and Services Changed Over 20 Years?
▼LINE's Emergence Accelerated Smartphone Adoption Among Younger Generations, Ushering in the SNS Era
▼ "Payment" Usage Becomes a Core Function of Mobile Devices
▼For Widespread Adoption and Establishment, "Meaning" Matters More Than "Convenience"
Mobile phones and smartphones that changed people's lives
Dentsu Inc.'s tracking survey began in November 2003, initially named the "3G Tracking Survey."
Its purpose was to understand how the evolution and spread of mobile phone features and services, alongside the proliferation of 3G-compatible devices, would change consumers' attitudes and behaviors.
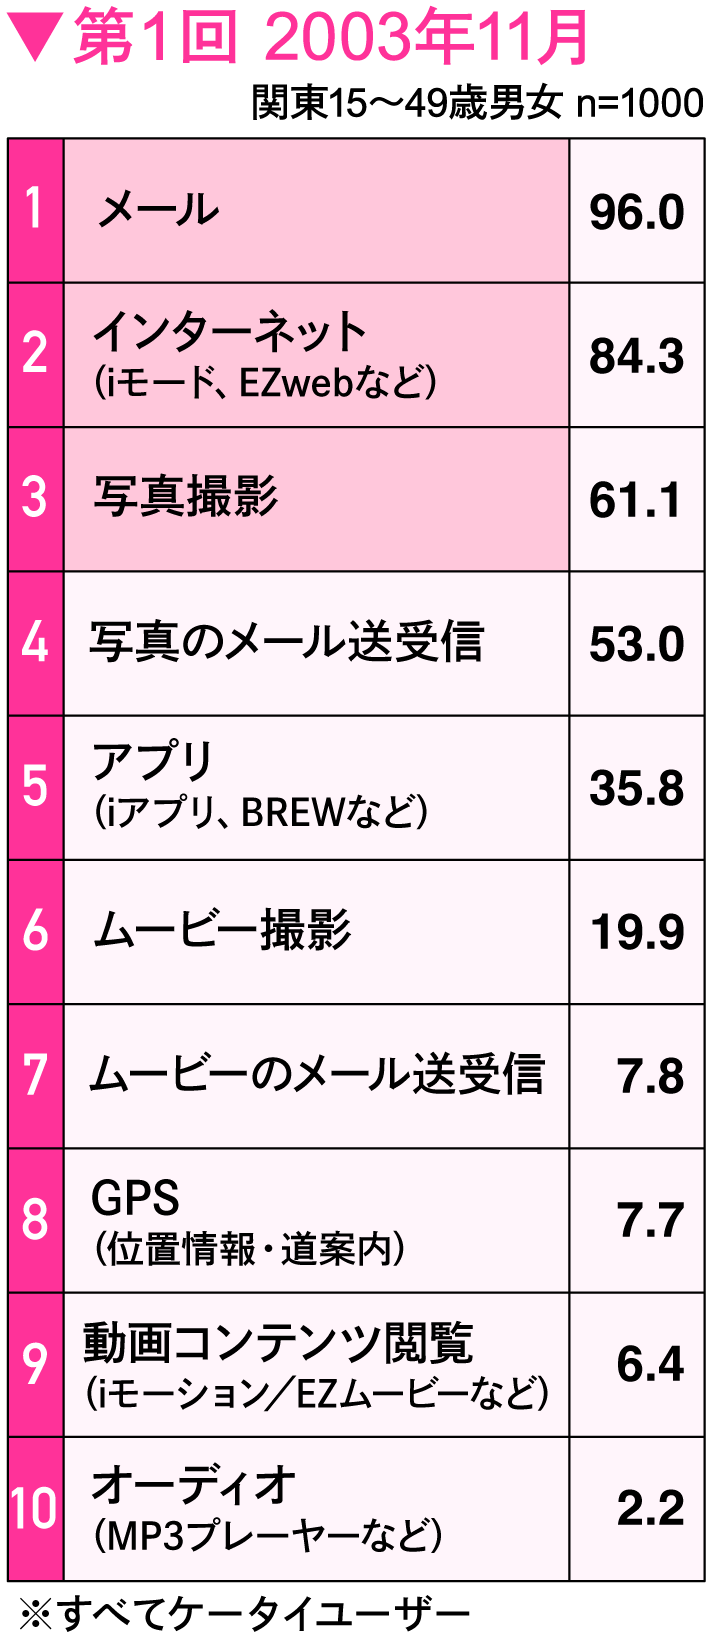
Regarding the penetration status 20 years ago, the 2003 survey found that about 24% of users had 3G mobile phones, while more than three-quarters used 2G or 2.5G models.
At that time, besides NTT DoCoMo and KDDI (au), Vodafone and TU-KA existed as mobile carriers, with KDDI (au) holding a slight lead in 3G.
Some may find this nostalgic, while others might think, "Huh? I've never heard of them!"
From here, we'll examine the changes over time using a unique five-point comparison from this tracking survey: 2003, 2008, 2013, 2018, and 2023.
First, here are some key points to note.
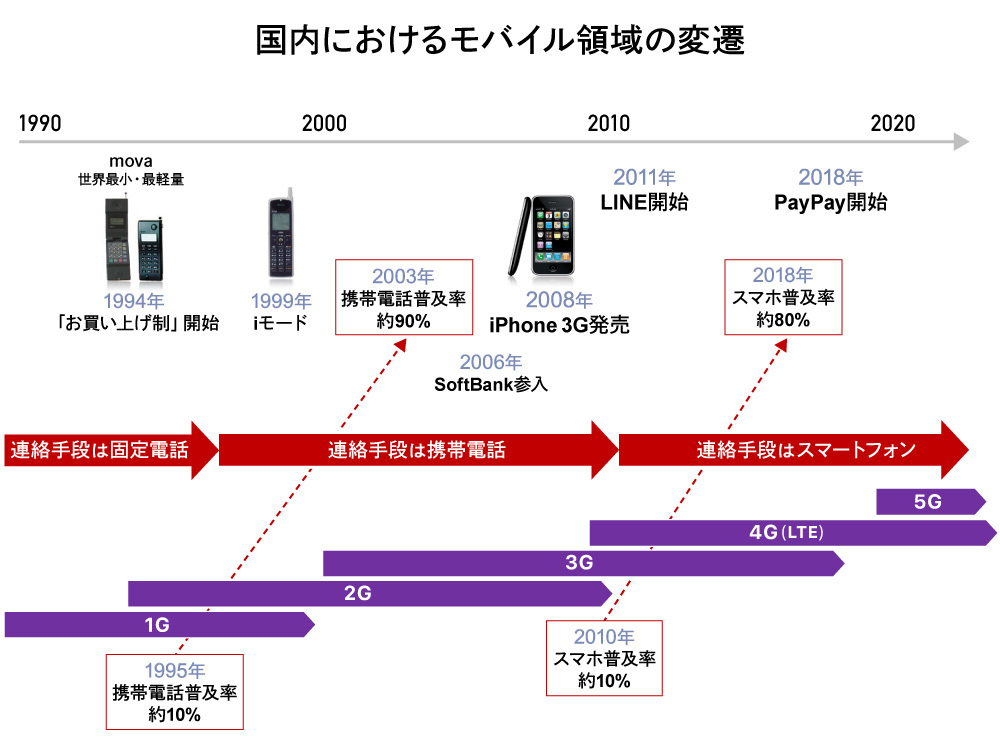
"2003" marked the start of flat-rate packet plans, finally providing a means to freely use mobile internet without worrying about costs. From there, diverse mobile services began to proliferate. However, mobile internet via cell phones remained confined to a closed space, unable to access the same internet as PCs.
Amidst the maturity of feature phones and a sense of stagnation in mobile internet potential, the iPhone 3G arrived in July 2008. While smartphones existed before this, they remained niche products. Looking back now, this year is widely recognized as the true beginning of the smartphone era.
The year 2013 marked the rise of budget SIM cards. Simultaneously, the expansion of 4G (LTE) coverage and the proliferation of compatible devices accelerated, leading to a rapid increase in data communication usage.
However, around 2013, rich game apps using 3D graphics and SNS platforms for sharing videos hadn't yet become widespread. The game market expanded rapidly with the 2012 release of "Puzzle & Dragons (Puzzle & Dragons)" and the 2013 launch of "Monster Strike (Monster Strike)".
Further boosted by faster connection speeds and smartphone model advancements, enjoying videos, games, manga, music, and entertainment services on smartphones became commonplace within the five years starting from 2013. This trend also led to increased spending on smartphones, such as app in-app purchases and online shopping.
Then, in 2018, a year when budget smartphones and sub-brands became widespread, the code payment service "PayPay" appeared. This made paying with smartphones not just in apps and online, but also in real life, a commonplace occurrence.
By 2023, have monthly communication fees really become cheaper?
First, let's examine the changes in "communication fees" over the past 20 years based on survey results.
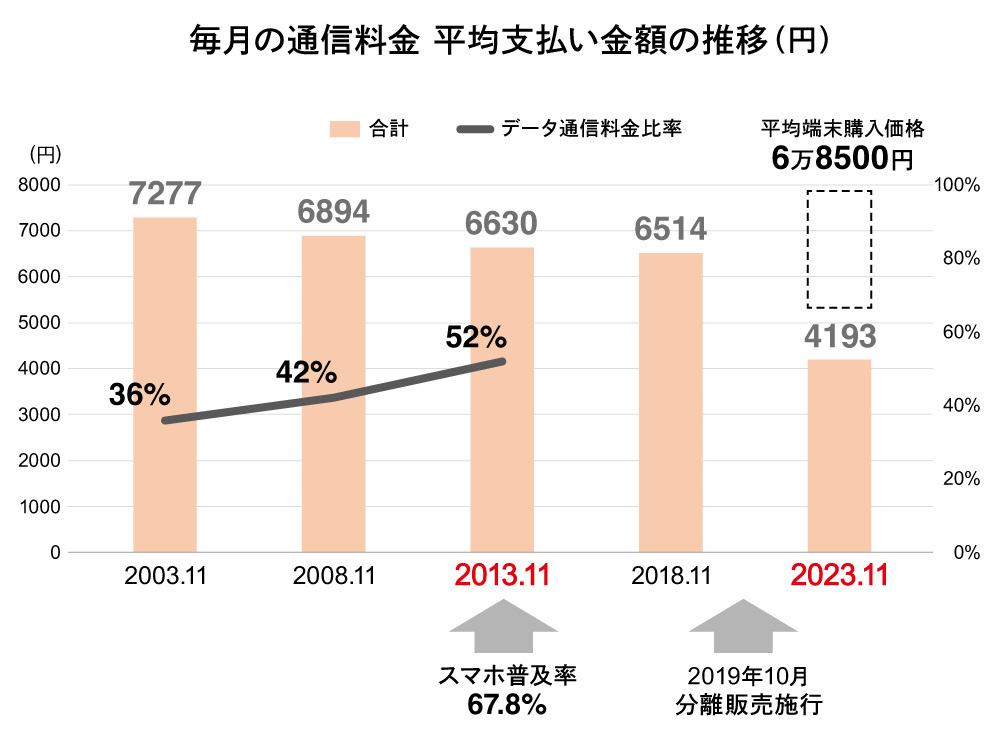
Looking at monthly communication fees in 2003, the average amount for survey respondents was about 7,300 yen. Of that, "data communication fees" accounted for less than half, just 2,600 yen. "Basic fees" and "call charges" totaled 4,700 yen, making up over 60% of the total payment.
The background here is that in 2003, flat-rate packet plans had just started, and the main uses for mobile phones were "calls" and "text messages." People often didn't understand data communication costs, accidentally used too much, and sometimes faced unexpectedly high bills. Consequently, many users were careful about data usage (then measured by packet volume), leading to this overall average.
Subsequently, with the spread of flat-rate packet plans and 3G phones, the proportion of "data communication charges" within monthly communication fees increased. Furthermore, with the advent of the smartphone era, flat-rate packet plans gradually disappeared, reverting to usage-based pricing. While the unit cost of data communication had become considerably cheaper, the amount of data used changed significantly with smartphones, which, unlike feature phones, offered full internet access.
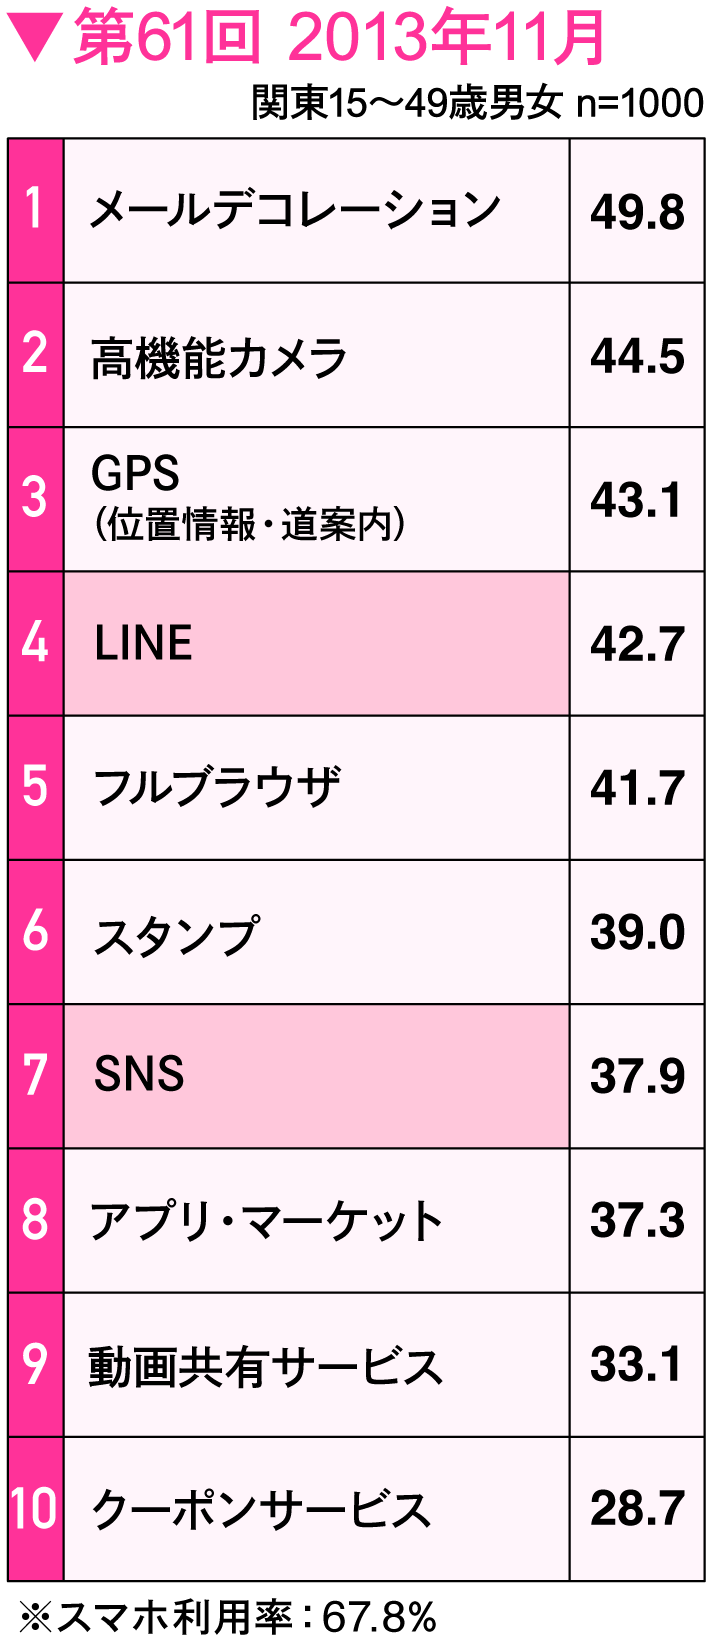
Then, in 2013, when our research showed smartphone penetration exceeded two-thirds of the total population, the proportion of "data communication fees" within total communication costs finally surpassed 50%.
However, after smartphones became mainstream in 2013, calls increasingly shifted from standard phone calls to IP-based services like LINE, meaning "calls" also began to be handled via data communication. This moved away from the simple pricing structure of the feature phone era—a "basic fee" and "data communication fee"—toward a system where both calls and data communication are selected under diverse conditions.
Consequently, Dentsu Inc.'s survey also shifted away from separately asking about "data communication charges." Instead, it now focuses on asking about the total monthly amount paid for communication services and inquiring about optional services and discount plans.
The period showing the most significant change in communication fee payments was the five years from 2018 to 2023. Communication fees were approximately ¥6,500 in 2018, but the 2023 survey showed they had dropped to about ¥4,200, marking the largest change in the past 20 years.
One factor contributing to this decrease was the "decoupling of device costs from service fees" implemented in 2019. The fact that over 50% of respondents in 2018 reported their monthly communication fees "included device costs" indicates that separating device costs led to lower monthly bills.
Additionally, more affordable plans targeting users who don't heavily utilize data services have become available. Factors like the increase in subscribers to sub-brands such as Y!mobile and UQ mobile, along with the introduction of Docomo's ahamo—which offers simple, necessary specifications for under ¥3,000 per month—likely had a significant impact.
To summarize, while device costs were previously included in monthly communication fees, the implementation of "separate sales" in 2019 led to a decrease in the total communication fee amount.
On the other hand, the latest 2023 survey shows the average purchase price for a smartphone device is approximately 68,500 yen. Converting this amount into a two-year monthly payment equates to about 2,850 yen per month. Adding this to the communication fee of 4,200 yen results in a total monthly cost of approximately 7,000 yen.
Looking solely at these figures, it might seem that consumers' financial burden hasn't changed significantly over the past 20 years. However, it's also true that more options exist to reduce the monthly cost. Not only have more affordable rate plans increased, but there are also more inexpensive handsets available, and we've entered an era where used smartphones are also a viable choice.
For example, a 2023 survey found that about 40% of people paid less than 3,000 yen per month for communication fees, and nearly 40% also paid less than 50,000 yen for their device. This indicates that users can now actively reduce their financial burden through their own choices.
However, even in this era of affordable choices, gathering and understanding information is essential. Abundant options also create confusion and difficulty for people. The more they research, the more uncertain they become about what's best, leading some to become indecisive. The ability to process information also plays a role.
An "information gap" exists between those who can select a plan, device, and purchase method they are satisfied with from the many options, and those who cannot.
How have mobile device features and services changed over 20 years?
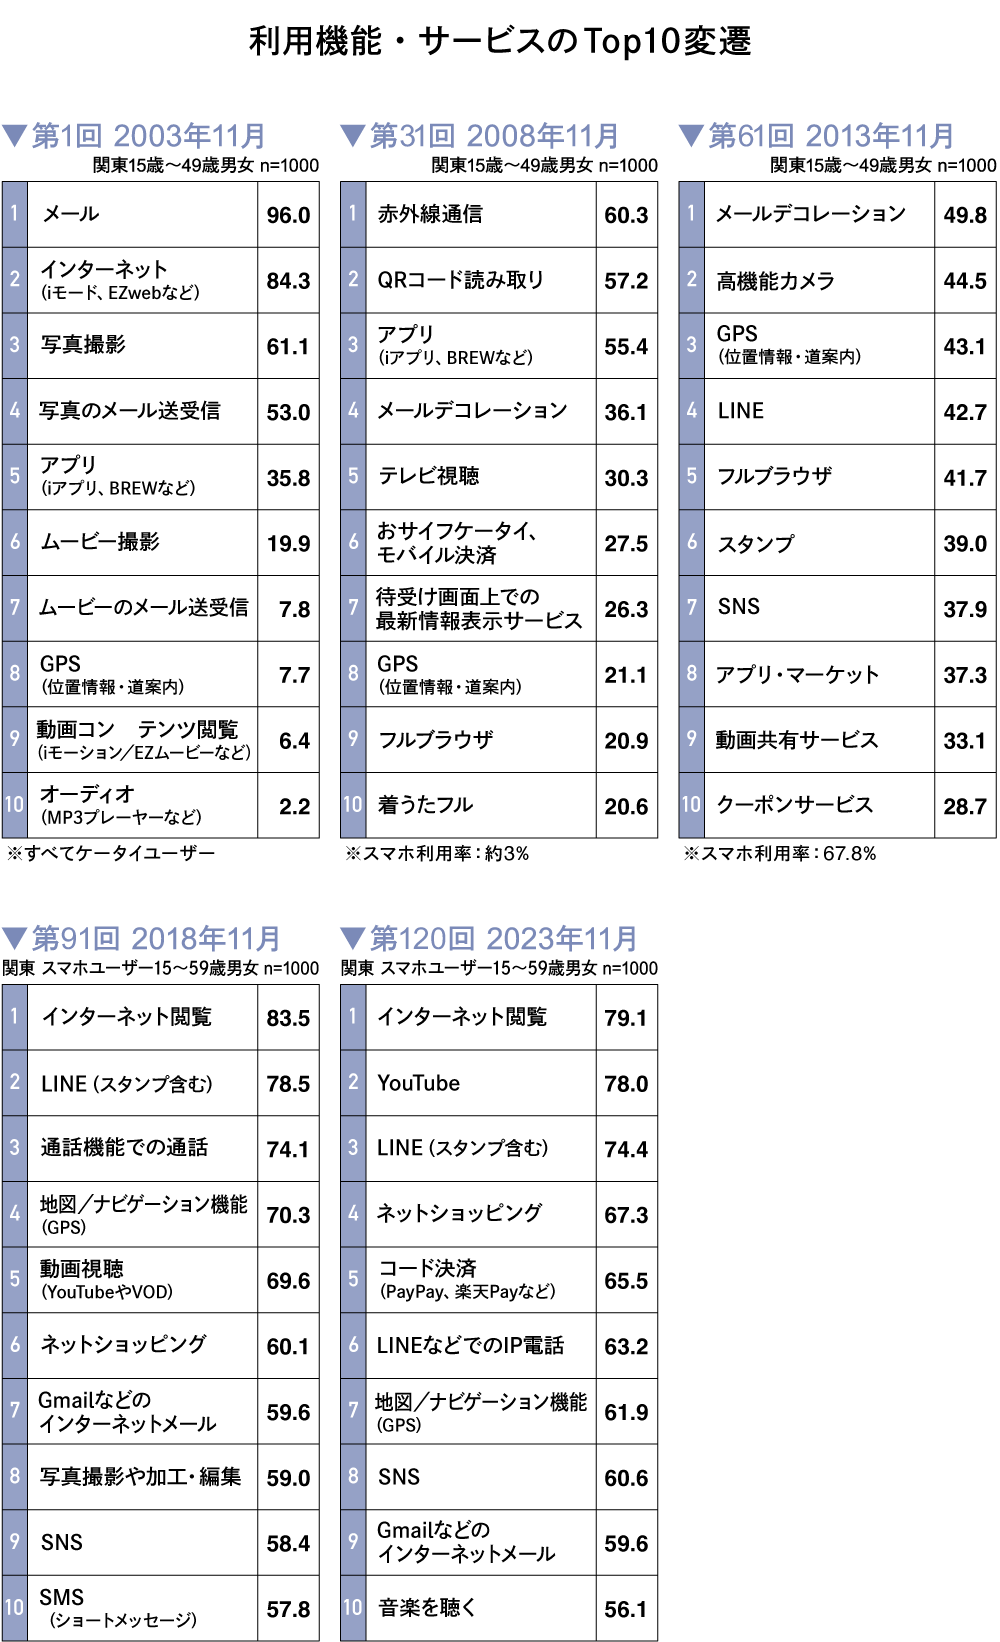
Next, let's examine the evolution of features and services over these past 20 years. Alongside the evolution and widespread adoption of mobile phones and smartphones, the features and services used by consumers have also changed.
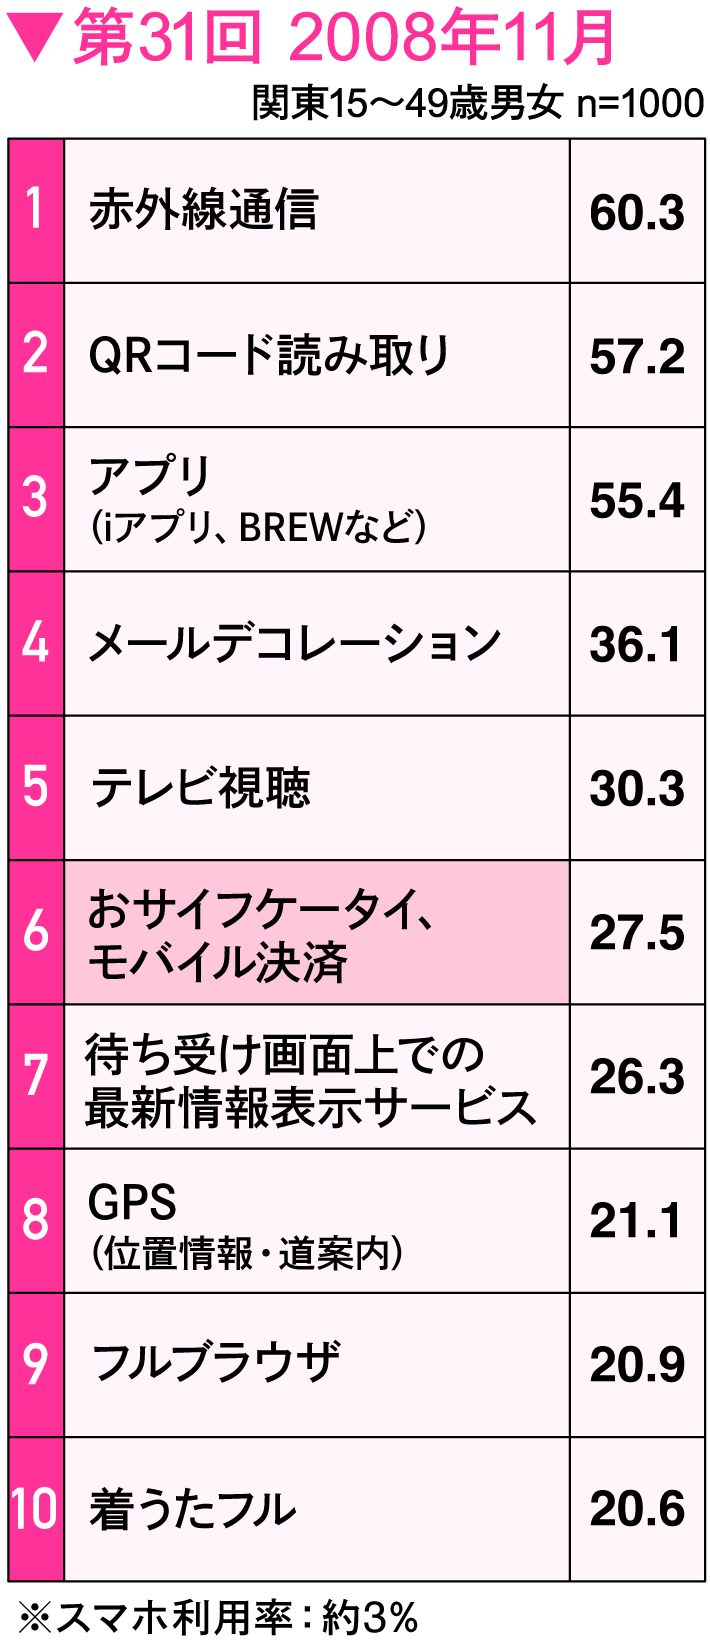
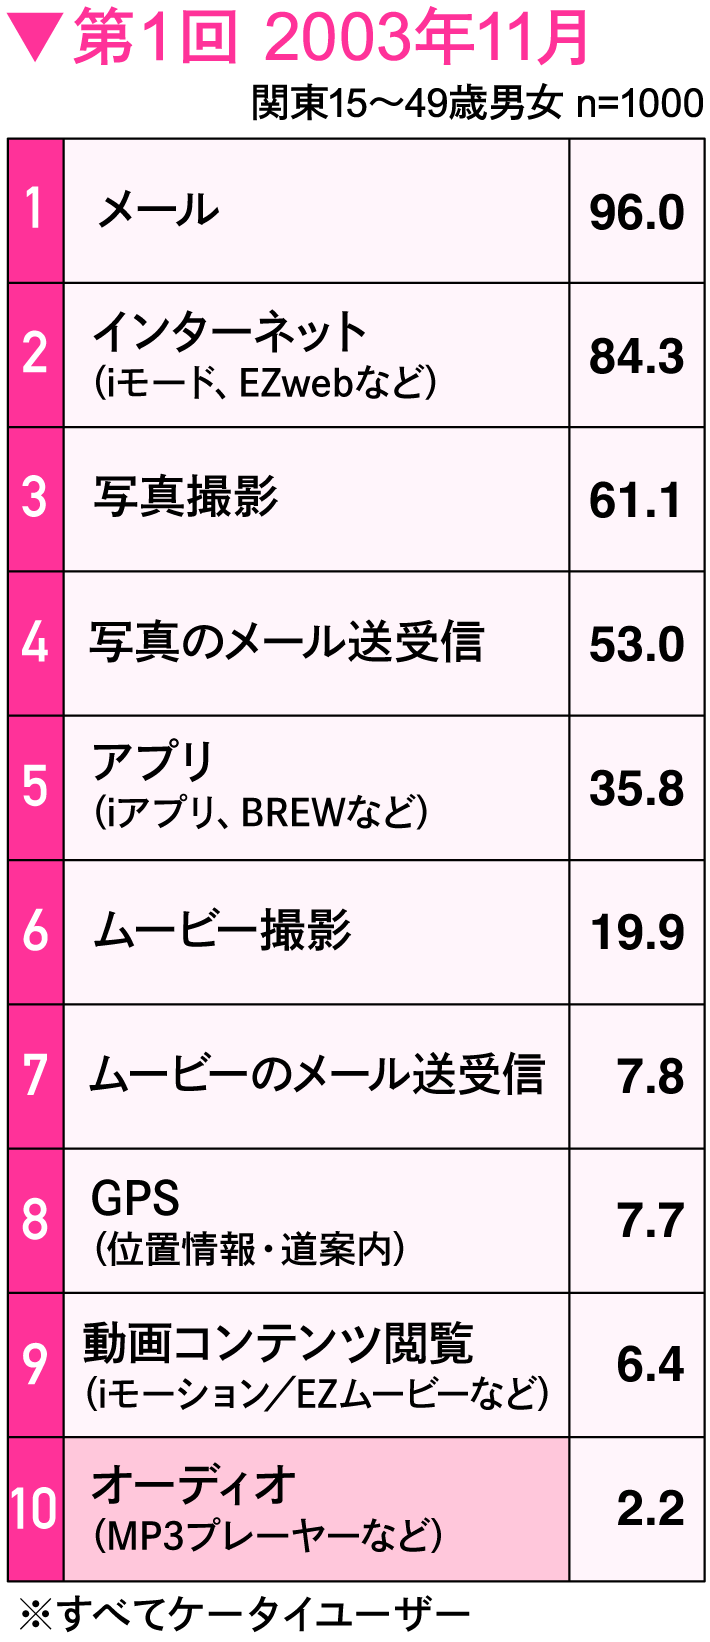
The top three functions in the 2003 survey—"email," "internet," and "photo capture"—were excluded from the options starting in 2008 because they had become standard features used by almost everyone.
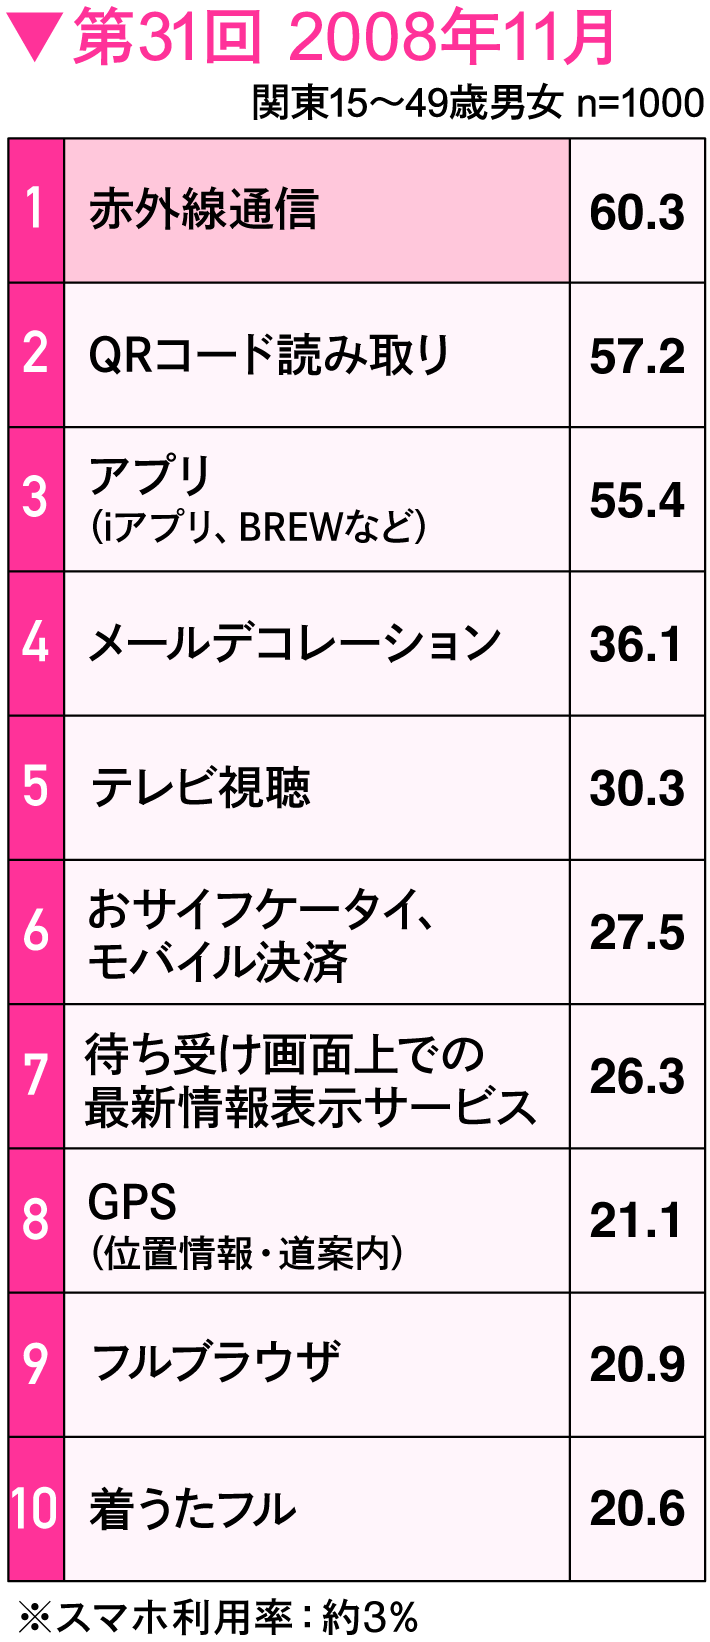
In 2008, "infrared communication" took the top spot, but it is scarcely used today. One contributing factor is that apps like LINE now use QR codes for exchanging contact information between users.
Furthermore, as connecting via LINE and SNS became commonplace, opportunities to exchange phone numbers or email addresses with someone privately have likely decreased.
LINE's emergence accelerated the shift to smartphones among younger users. Suddenly, we entered the SNS era.
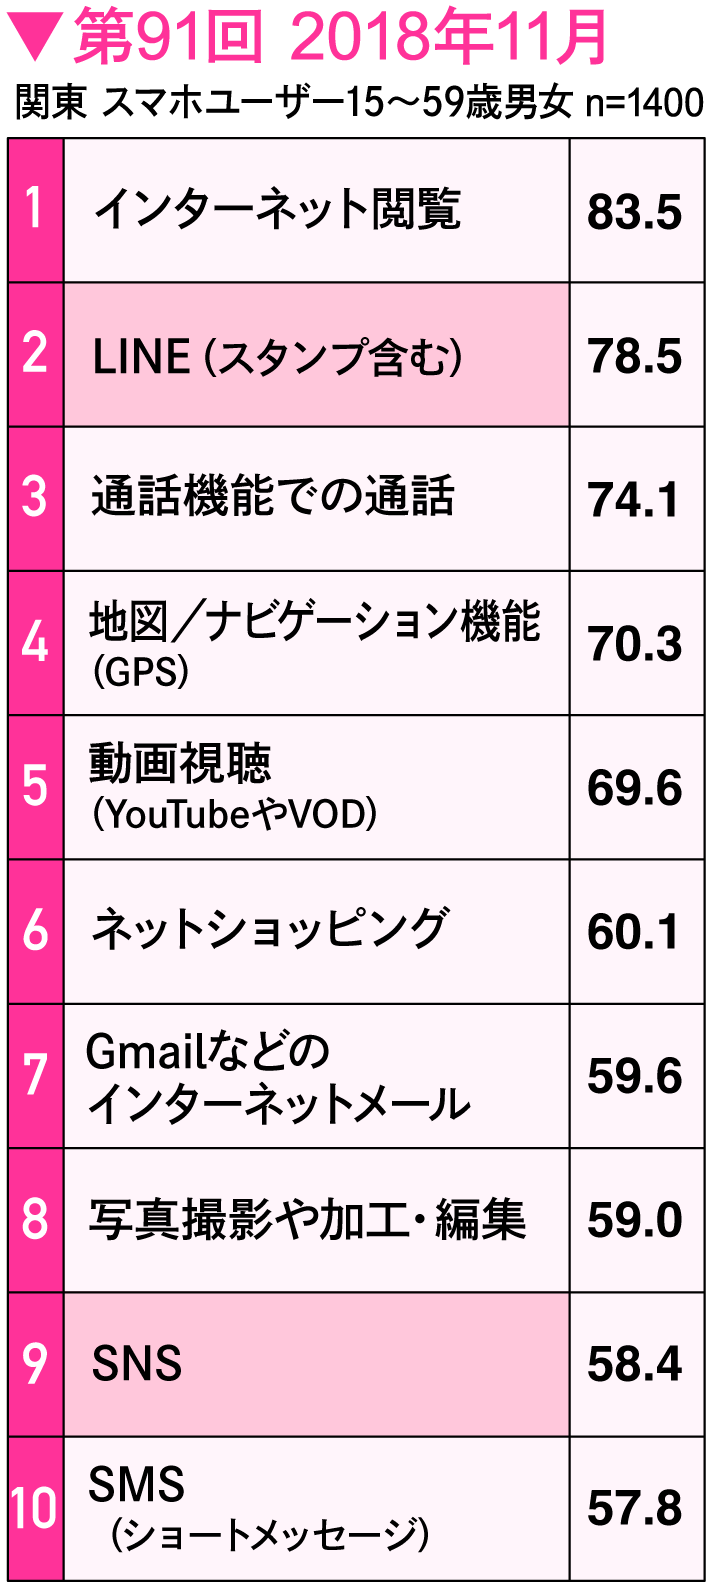
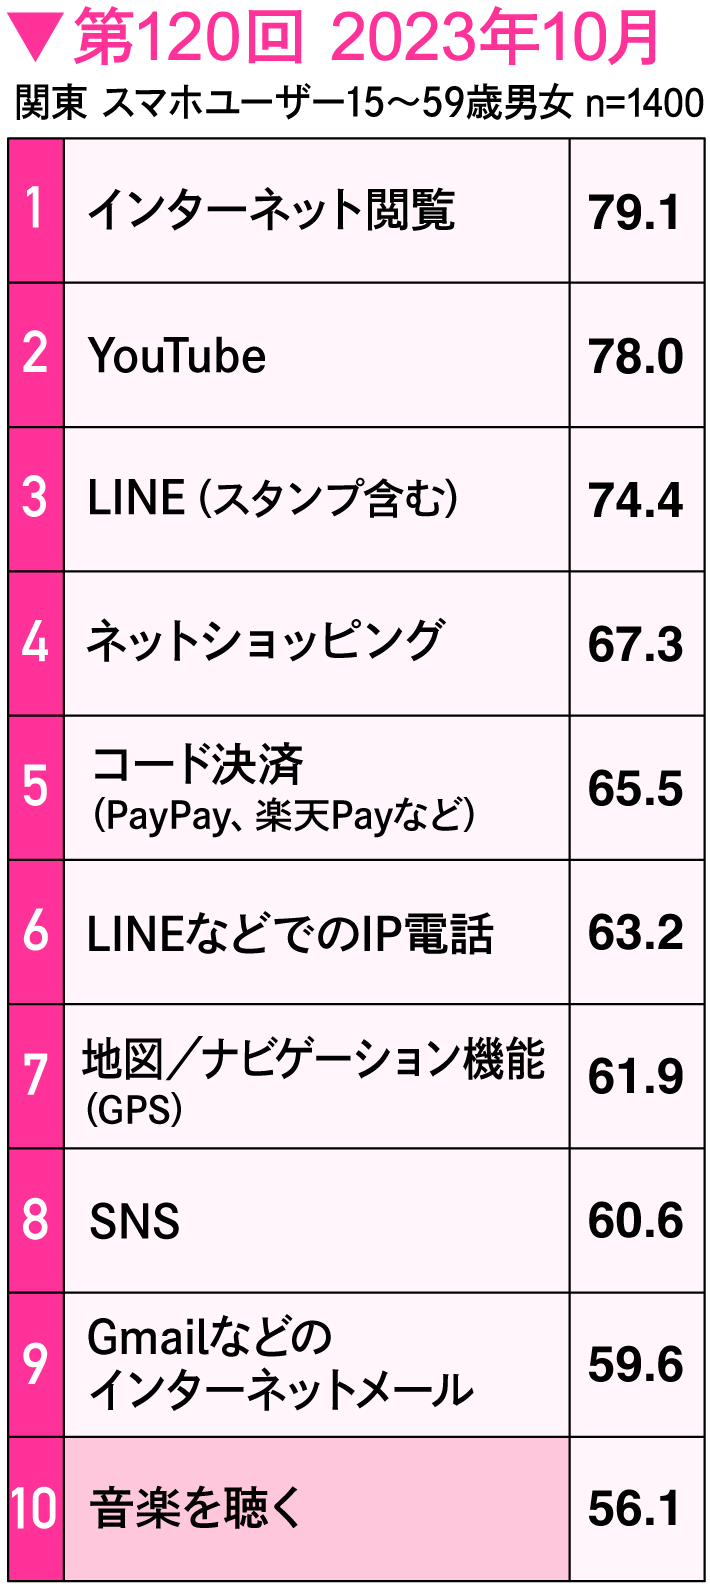
Amidst this trend, the usage rate of "call functions" underwent a significant change. While the usage rate for call functions was 74.1% until 2018, it fell out of the top 10 by 2023. The usage rate dropped sharply, falling to around 50%.
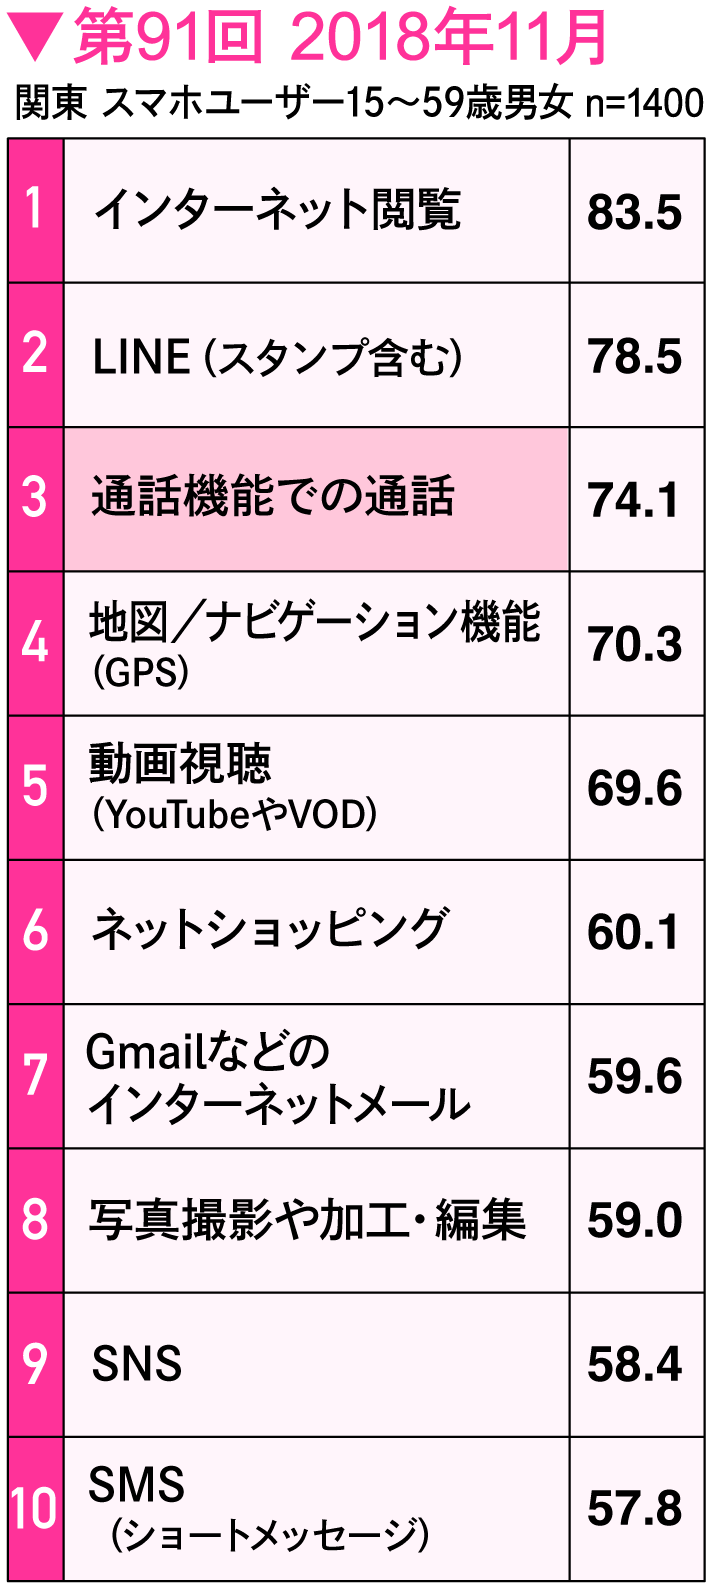
Perhaps influenced by the stay-at-home trend, people across generations have largely stopped using the call function, instead opting for IP-based calling via apps like LINE or Skype.
This trend extends beyond personal use to business settings as well. The rise of web conferencing tools accompanying the increase in remote meetings is another factor contributing to the decline in voice call usage. Considering the changes in how we exchange contact information, this shift feels inevitable.
In other words, it's now becoming "normal" not to know someone's phone number or to have friends' numbers unregistered in your phone book.
While LINE is now a common communication tool across all generations, it was released in June 2011, just three years after the iPhone 3G debuted.
In 2008, the first buyers of the iPhone 3G were primarily Apple fans in their 40s and early adopters who loved digital devices. This tracking survey shows smartphone usage crossed the so-called chasm (exceeding 16%) and began reaching the majority starting with the March 2011 survey. Simultaneously, we confirmed that teens started owning smartphones around 2011.
It was precisely at this moment that LINE emerged, popularizing communication via stickers as a quintessentially smartphone-like experience. Younger users then accelerated their shift to smartphones in a chain reaction, essentially to connect with friends on LINE.
While LINE undoubtedly offered a novel communication experience, its launch timing was also impeccable.
Furthermore, we see the widespread adoption of various SNS platforms, now established as communication tools, as truly taking hold with the proliferation of smartphones. X (formerly Twitter) launched its Japanese version in April 2008, and the iPhone 3G went on sale just three months later.
Subsequently, SNS usage rates, which were around 30% in 2013, expanded with the arrival of the Japanese version of Instagram in 2014, reaching approximately 60% usage by 2018—a rate close to current levels.
Furthermore, during this five-year period from 2013 to 2018, it's important to note that users began to differentiate their use of individual SNS platforms ( ) and that the practice of managing multiple accounts also became commonplace.
The shift toward mobile devices as the central role in "payment"
We will also examine the evolution of payment methods over the past 20 years.
In 2004, "Osaifu-Keitai" (mobile wallet phones) appeared, enabling touch payments for transit e-money and credit cards. This marked the beginning of widespread payment usage on mobile devices.
While switching from feature phones to smartphones generally meant upward compatibility for most functions, the situation was slightly different for touch payments. iPhone support began with the iPhone 7 released in 2016; before that, iPhones couldn't perform touch payments. Many people inserted their transit e-money cards into iPhone cases – a practice still fresh in our memories.
With iPhone's touch payment support, it seemed touch payments via smartphones would become mainstream. However, the landscape changed in 2018 with the arrival of the code-based payment service PayPay. While promotional campaigns contributed to its image as a more advantageous option compared to other payment methods, its core value for users seemed to be the ability to see the contents of their "wallet" (payment balance) confirmed with every transaction.
Comparing the effort required at checkout, contactless payments are easier since you just tap. Code payments, on the other hand, require logging into your phone, launching the app, and sometimes even scanning a QR code and entering the payment amount.
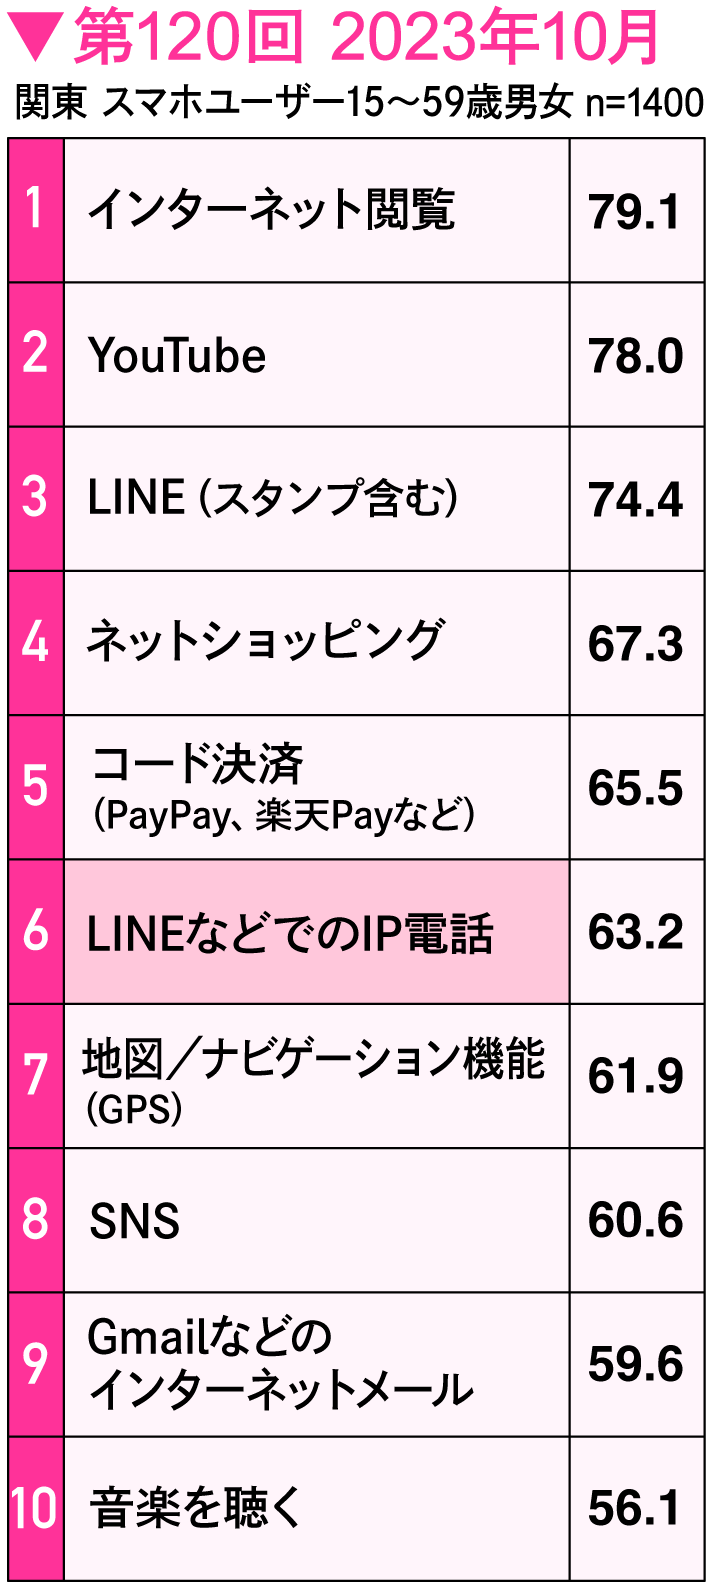
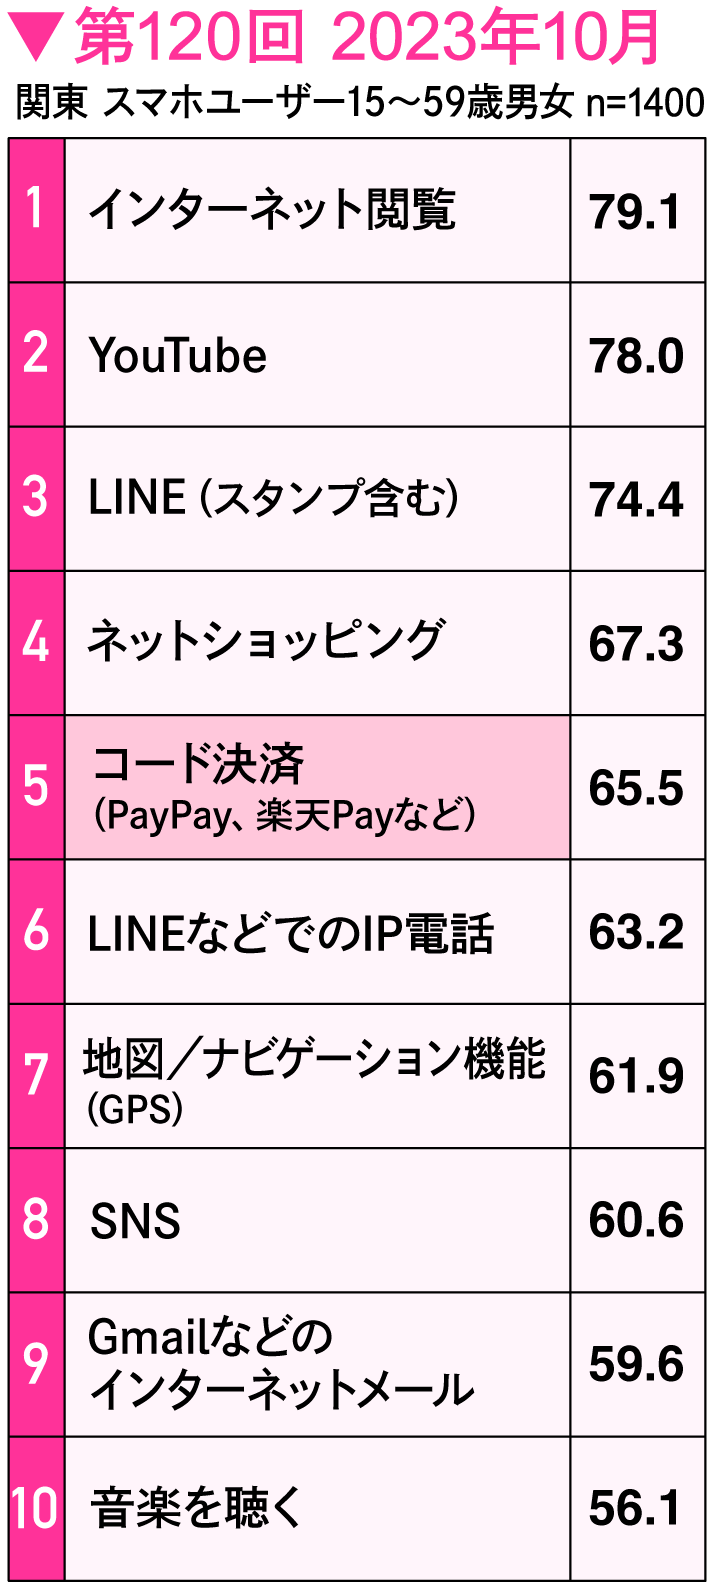
While this might sound slightly cumbersome, mobile survey results show code payment usage is surging at an astonishing rate. By 2023, code payment usage reached 65%, surpassing social media usage rates, and it has become the most selected payment method at convenience stores.
A Dentsu Inc. survey asked users why they choose code payments. The most common reason cited was "point rebates." Unlike traditional point services offering 1% or 2%, these rebates range from 10% to 20%, making them a significant incentive. But that's not all. Users also mentioned reasons like "seeing their remaining balance every time they pay" and "the convenience of having it linked to their bank account, eliminating the need for later billing."
Furthermore, many respondents cited the convenience of "easily sending money to friends for splitting bills or buying something for them." Previously, splitting bills with cash often led to problems like not having exact change or not having enough cash on hand. Conversations like "They have your favorite snacks that aren't usually in stock—should I grab some for you?" are also commonplace. In such situations, saying "I'll pay you back later" could lead to delays in handing over money due to lack of exact change or cash, or even forgetting altogether, potentially straining friendships.
These issues have been resolved, making it easier now to ask friends to buy things for you or to pay on your behalf. The spread of cashless services seems to be helping reduce factors that can strain relationships.
That aside, What does it suggest that code payments, which involve more steps, are more widespread than the convenient touch payments?
For widespread adoption and acceptance, "meaning" matters more than "convenience"
Similar to social media, while some argue that having one method handle everything is ideal, the reality is that most people now value using multiple methods depending on the purpose or person.
In other words, while we tend to think that "convenience" – meaning low effort – is required for the spread of services and apps, what is actually demanded even more is the "meaning" behind their use.
This trend holds true for content services like music as well. Since this falls under the realm of personal interests, it generates even more diverse "meaning."
In 2003, only about 2% of people listened to music on their mobile phones. Twenty years later, in 2023, over 50% of people listen to music on their smartphones. While the proliferation of subscription services is a key factor, it's precisely because music has become so conveniently accessible that a different "meaning" has emerged in purchasing CDs.
When CDs first appeared in the 1980s, their value lay in "better sound quality." Today, CDs exist as "proof of being a true fan." There are degrees to one's "liking" of an artist. Simply having songs you listen to often or like is the entry point. Next comes going to live shows or festivals. Then, for true fans, owning the CD becomes the next level.
Reviewing two decades of data reveals not only shifts in communication and payment methods, but also how the "meaning" behind actions evolves with the times and environment.
From these shifts, three key points emerged for interpreting or predicting changes in the times.
① Insights from changes in communication costs
- When choices are limited, information gaps are less likely to emerge.
- When diverse options become available, information gaps become apparent.
② Insights from changes in communication tools
- Communication tools change based on who you connect with.
- The choice of tool is determined more by who you connect with and how, rather than your preferred method.
③ What we learn from changes in payment methods
- Convenience alone does not create value.
- Simplicity is crucial, but it requires value beyond what was previously "taken for granted."
Digital solutions are often seen as tools for solving immediate problems, but from a macro perspective, proposing "meaning" is more important than just solving problems.
Through 20 years of research, the author has observed numerous instances where "what was taken for granted" has changed. This led to the conviction that current norms can also evolve into happier, more desirable ones. With this belief, the author established the organization "Future Business Creation Research."
Look around you and find areas where the "norm" has changed due to the spread of smartphones and the internet. Explore the background behind these changes. In most cases, you will likely discover that the new "norm" holds meaning.
Companies interested in the "Dentsu Mobile Project Tracking Survey" are encouraged to contact Dentsu Inc.!
<Survey Overview>
Dentsu Inc. Mobile Project Tracking Survey
Survey Method: Internet survey
Survey Period: November 2003 to present (120 surveys conducted total)
Surveys 1–65: November 2003–July 2014
Survey Subjects: 1,000 men and women aged 15–49 who use mobile phones or smartphones
Survey Area: Kanto Region
<Surveys 66–120> September 2014–November 2023
Survey Subjects: 1,400 men and women aged 15–59 who use smartphones
Survey Area: Kanto

Was this article helpful?
Share this article
Newsletter registration is here
We select and publish important news every day
For inquiries about this article
Author

Kentaro Yoshida
Dentsu Inc.
Solution Creation Center / Future Business Creation Research Founder
Chief Director, Marketing Division 4
Engaged in market analysis, strategic planning, and consulting primarily focused on the mobile business and smartphone app sector. As Dentsu Inc.'s Mobile Project Leader, attended CES/MWC annually since 2011 to grasp tech trends. Established the Dentsu Group cross-organizational "Future Business Creation Lab" in 2021. Specializes in business development through backcasting from visualizing future lifestyles. Fellow of the Consumer Affairs Agency's New Future Vision Forum; Master of Business Administration (MBA).
Articles by this person

Deepening discussions about the future through 'Dentsu Inc. Future Mandala 2025.' What kind of future will be woven by the diversifying concepts of 'connection' and 'abundance'?