Note: This website was automatically translated, so some terms or nuances may not be completely accurate.
Is the Information You Receive "Biased"? How to Approach Information Bias Through Data
Dentsu Inc. Desire Design (DDD) is an organization that develops various solutions and disseminates information based on the relationship between consumption and desire.
Starting with the 21st installment, we analyze DDD's "Heart-Moving Consumption Survey," sharing insights and findings derived from the survey results.
This time, based on the results of the 10th survey conducted in May 2025, Takashi Chiba of DDD examines the findings with a focus on perceptions and behaviors regarding information acquisition.
Unraveling Reiwa-era Consumer Awareness Through Awareness and Action Regarding "Information Bias"
In today's era long described as one of information explosion, the information we encounter in daily life is personalized for each individual, primarily through smartphones. It has become commonplace for the information one encounters in a day to be entirely different from that of the person next to them, and "things everyone knows" have become fewer compared to the past.
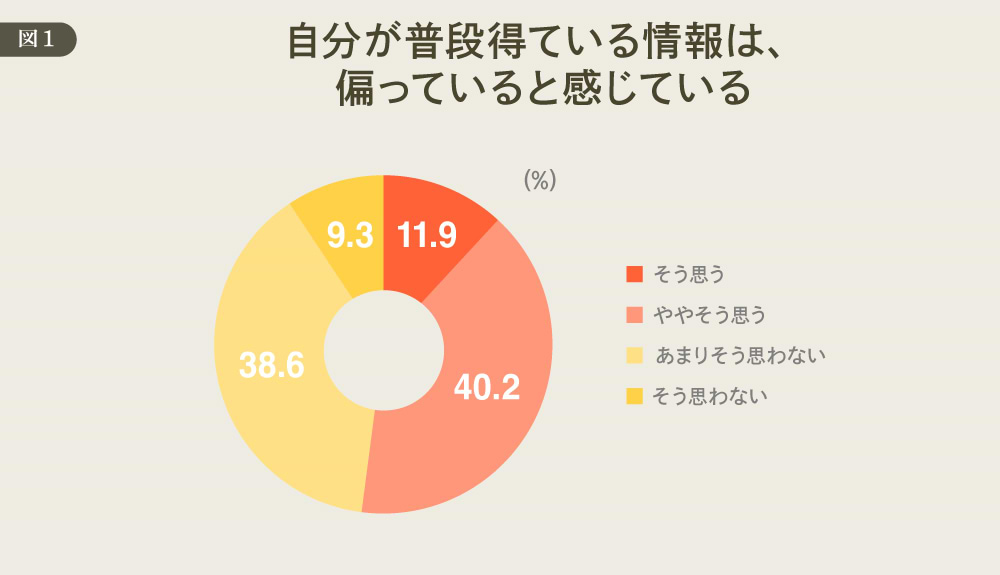
However, when asked whether they believe "the information they normally obtain is biased," 52.1% responded "I think so" or "Somewhat so," while 47.9% answered "I don't think so" or "Not really," revealing that nearly half of people believe their information is unbiased.
So, what about actions taken to obtain information? The results of asking whether people "take action to learn the opinions, thoughts, and information of people with different perspectives" are shown in the graph below.
"Agree" or "Somewhat agree" accounted for 46.0%, while "Disagree" or "Somewhat disagree" accounted for 54.0%. Here, "Disagree" or "Somewhat disagree" responses were slightly more numerous.

Therefore, this time, we will examine how Reiwa-era consumers approach information by combining two axes: "awareness of bias" and "actions to learn different opinions or information."
Approaches to information show significant differences by age group
First, let's examine the proportions when classified into four quadrants. The largest group is "No awareness of information bias × No proactive information-seeking behavior regarding differing opinions or perspectives" (hereafter, "No proactive information-seeking behavior"), at 29.0%. Next largest is "Awareness of information bias × Proactive information-seeking behavior" at 27.1%.
The smallest group was "No recognition of information bias × Active information-seeking behavior," yet it still accounted for 18.9%. While there are some differences, overall, consumers are distributed across each quadrant in significant numbers.

However, examining the age composition by quadrant reveals significant differences.
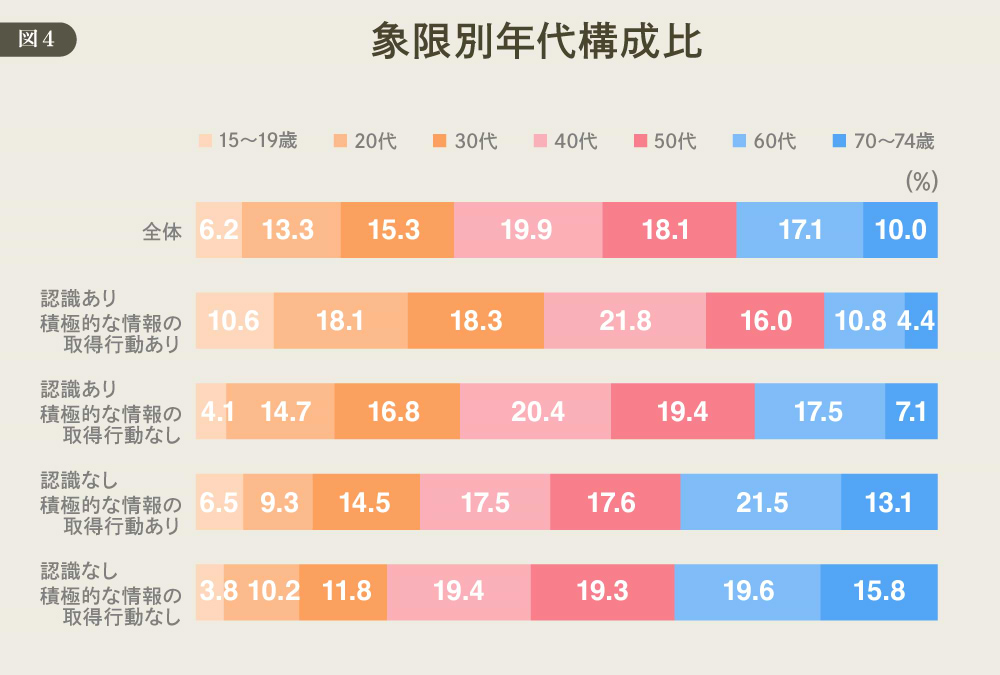
For example, the segment "Recognizes information bias × Engages in proactive information-seeking actions" accounts for 47.0% among those aged 39 and under, representing nearly half of this group. However, this segment drops to only 31.2% among those aged 50 and over.
Conversely, the "No awareness of information bias × No proactive information-seeking actions" group comprises only 25.8% (roughly one-quarter) of those aged 30 and under, while it accounts for 54.8% (over half) of those aged 50 and above.
This situation clearly indicates that there are distinct age-related differences regarding the perception of information bias and the actions taken to actively seek information.
Do the "desires" modern consumers hold influence their awareness of information bias and their actions?
Next, let's examine differences among people who most strongly possess each desire, based on DDD's defined "11 Desires"* within the same four quadrants.
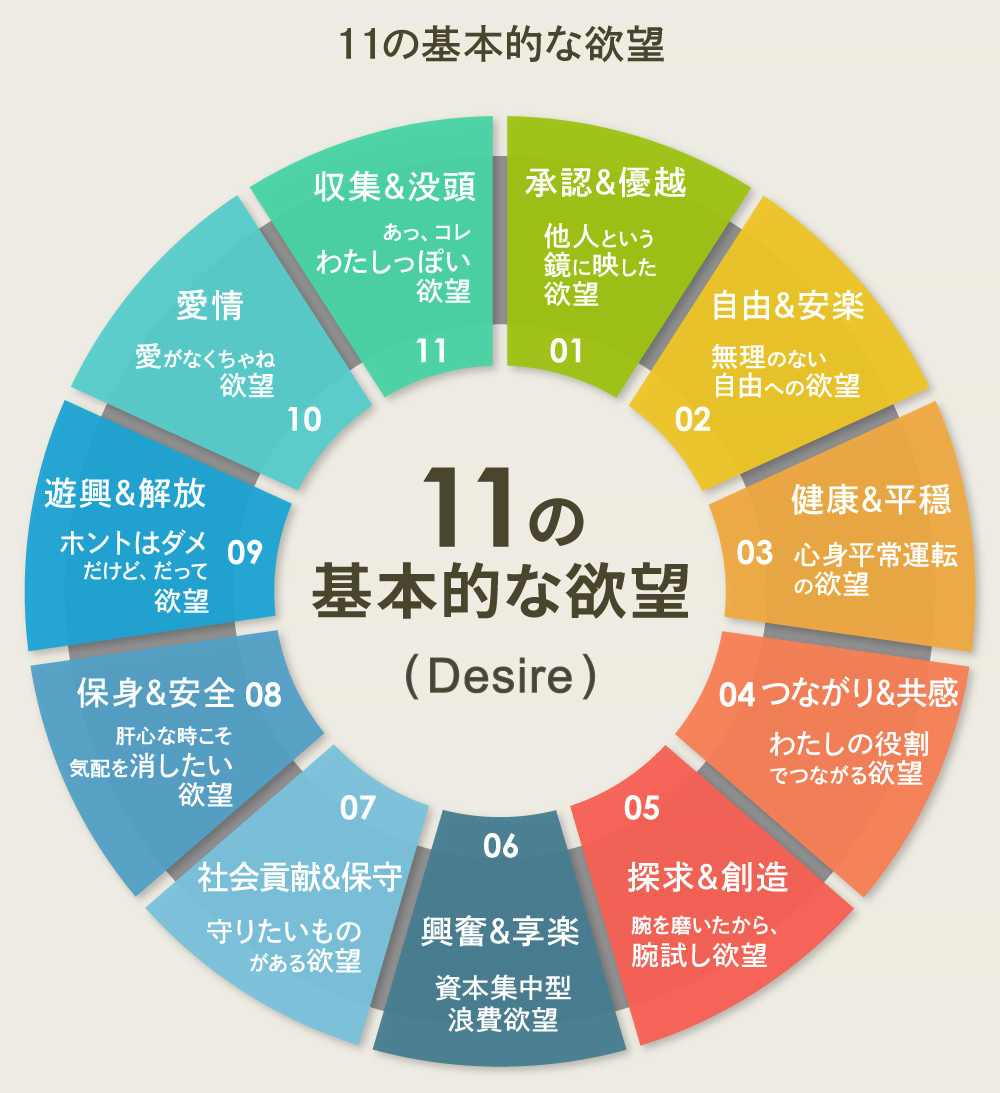

*For details on the "11 Desires," please see here.
・ "We'll give new desires names." (Web Dentsu-ho)
・ DENTSU DESIRE DESIGN Announces 2024 Edition of "11 Desires" Influencing Human Consumption Behavior
Looking at the radar chart, the trends in each quadrant are similar across nearly all desire factors. Within this, the "Recognizes information bias × Engages in proactive information seeking" segment (light blue) shows stronger desires across all categories compared to other quadrants. Conversely, the "Does not recognize information bias × Does not engage in proactive information seeking" segment (light orange) appears weaker across all items.
This suggests that self-awareness of information bias and the presence of proactive information-seeking behavior correlate with an individual's "overall desire intensity."
Furthermore, even among charts showing broadly similar patterns, the three desires relatively more likely to lead to consumption—"Recognition & Superiority," "Excitement & Hedonism," and "Collection & Immersion"—show relatively significant numerical differences across the quadrants. Considering this, it can be inferred that each quadrant not only has differences in overall desire strength but also exhibits some degree of bias or variation in values and consumption behavior.
Which Type Feels Happiest? The Relationship Between How People Engage with Information and "Values"
Next, we examine the values associated with each quadrant. The graph below shows the results of asking whether respondents "think they are happy."
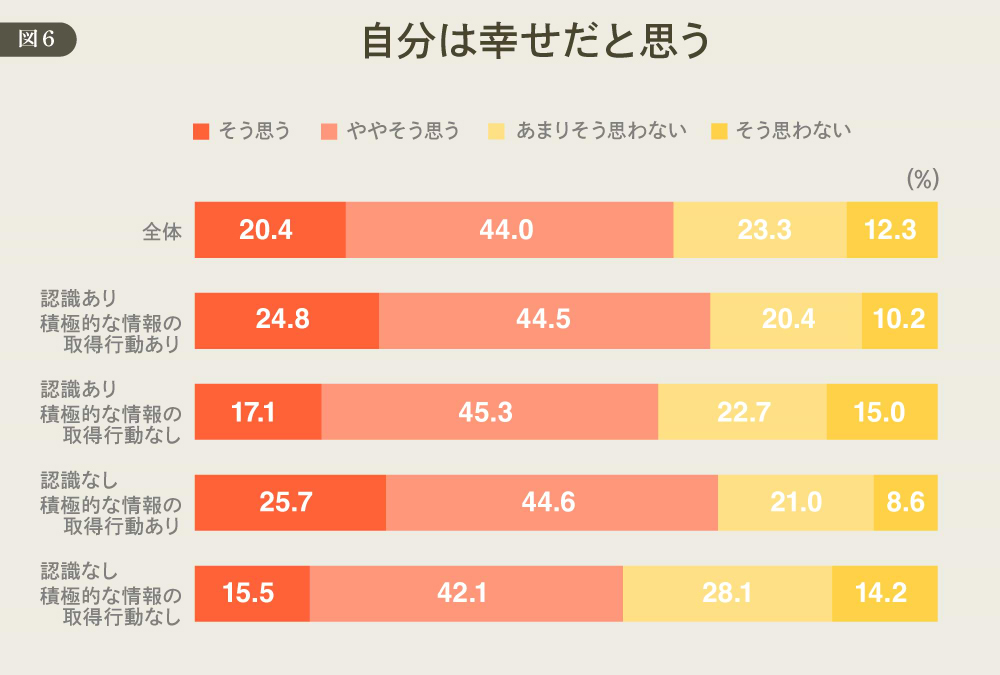
The groups that reported "taking action to learn opinions, thoughts, and information from people with different perspectives" – specifically the "Awareness of information bias × Active information-seeking behavior" group and the "No awareness of information bias × Active information-seeking behavior" group – showed a higher percentage of people who consider themselves "happy" compared to the two groups that did not take such action.
In a society overflowing with information, it may be fair to say that one's approach to information is not unrelated to their sense of happiness.
Let's examine other value items as well.

Let's examine some notable points in detail.
The proportion of people who answered "I trust information from major media outlets like TV stations and newspapers more than information on the internet" was 56.7% on average overall. However, the "No awareness of information bias × No active information-seeking behavior" group showed a higher level of trust in major media at 60.3% compared to other groups. This is likely significantly influenced by the age composition shown in Figure 4.
Regarding the item "When I watch recommended video content on video-sharing services like YouTube, I feel like my interests are broadening," the "No Perception of Information Bias × Active Information Seeking" group scored 63.3%, higher than other groups.
Recommendations typically function by deepening exploration of topics close to a user's interests, based on their search history or viewing patterns. However, individuals in this group, who perceive their information intake as unbiased, likely view recommendations not as "deepening their interests" but as an opportunity for "broadening their interests."
When combining the items "I want opportunities to learn about someone's hardships or unhappiness hidden in daily life" and "I think it's enough if I'm happy myself," the "Recognizes information bias × Engages in proactive information acquisition" group showed the highest results for both. The fact that many people express a desire to "learn about someone else's struggles or unhappiness" while also answering that "as long as I'm happy, that's all that matters" suggests that seeing "someone else's struggles or unhappiness" might also serve as a way to relatively confirm their own happiness.
We found that information bias is not merely about a decrease in "what everyone knows" in society, but is also linked to differences in happiness and various values. Both as individuals and as a society, we need to consider what constitutes "the future we should strive for in terms of information space and information intake" while engaging with the information surrounding us.
[Survey Overview]
10th "Heart-Moving Consumption Survey"
・Target Area: Nationwide, Japan
・Subject Criteria: Men and women aged 15–74
・Sample Size: Total 3,000 samples (allocated according to population ratios across 7 age groups: 15-19, 20s-60s, 70-74, and 2 gender categories)
・Survey Method: Internet survey
・Survey Period: Tuesday, May 13, 2025 – Friday, May 16, 2025
・Survey Sponsor: Dentsu Inc. DENTSU DESIRE DESIGN
・Survey Agency: Dentsu Macromill Insight, Inc.
The information published at this time is as follows.
Was this article helpful?
Share this article
Newsletter registration is here
We select and publish important news every day
For inquiries about this article
Back Numbers

Author
Takashi Chiba
Dentsu Inc.
第4マーケティング局
Producer
After gaining experience in sales, digital, and television divisions, he was seconded to DENTSU SOKEN INC., where he handled overall social research and studied the health of the information space. He returned to Dentsu Inc. in 2022 and joined the Future Business Creation Research / Consumer Research Project DENTSU DESIRE DESIGN, which creates future corporate value for clients. He handles diverse business development across industries and sectors, from new ventures to daily necessities, anchored in the future and desire.He is also a joint researcher at the Keio University X Dignity Center.