"2025 Japan Advertising Expenditures Analysis"──Exceeding 8 Trillion Yen for a Record High. Internet Advertising Expenditures Surpass 50% of Total Composition
On March 5, 2026, " 2025 Japan Advertising Expenditures " was announced. Rikichiro Morinaga of Dentsu Inc. Media Innovation Lab and Mikio Takamatsu of CARTA HOLDINGS, INC explain the changes in the advertising markets for the Internet, the four mass media outlets, and promotional media.
*Regarding figures in the article: Since the numerical values for each item in the composition ratio are rounded to the nearest whole number, the sum of the breakdowns may not match the total value in the total column.
<Video> Want a quick overview? Check out this simple explanation!
▼Understand Japan's Advertising Expenditures 2025 in about 1 minute!
Overall Overview──Advertising Demand Expands Against the Backdrop of "Digital" and "Real" Needs
──First, please provide an overview of "Japan's Advertising Expenditures in 2025."
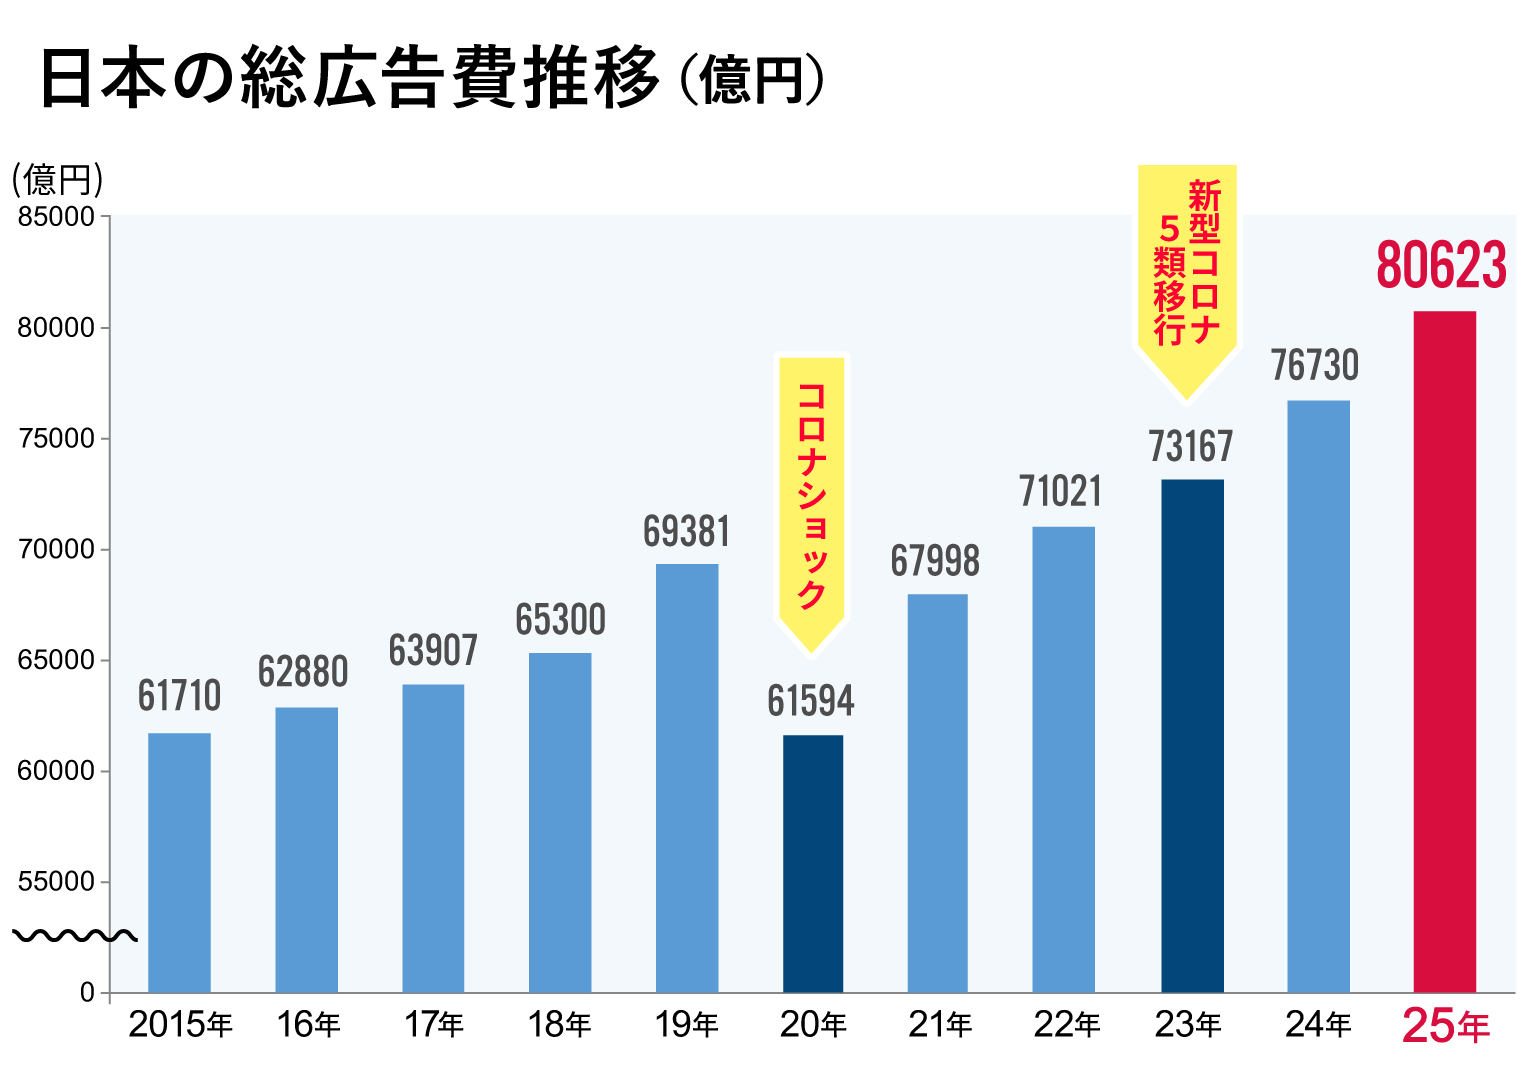
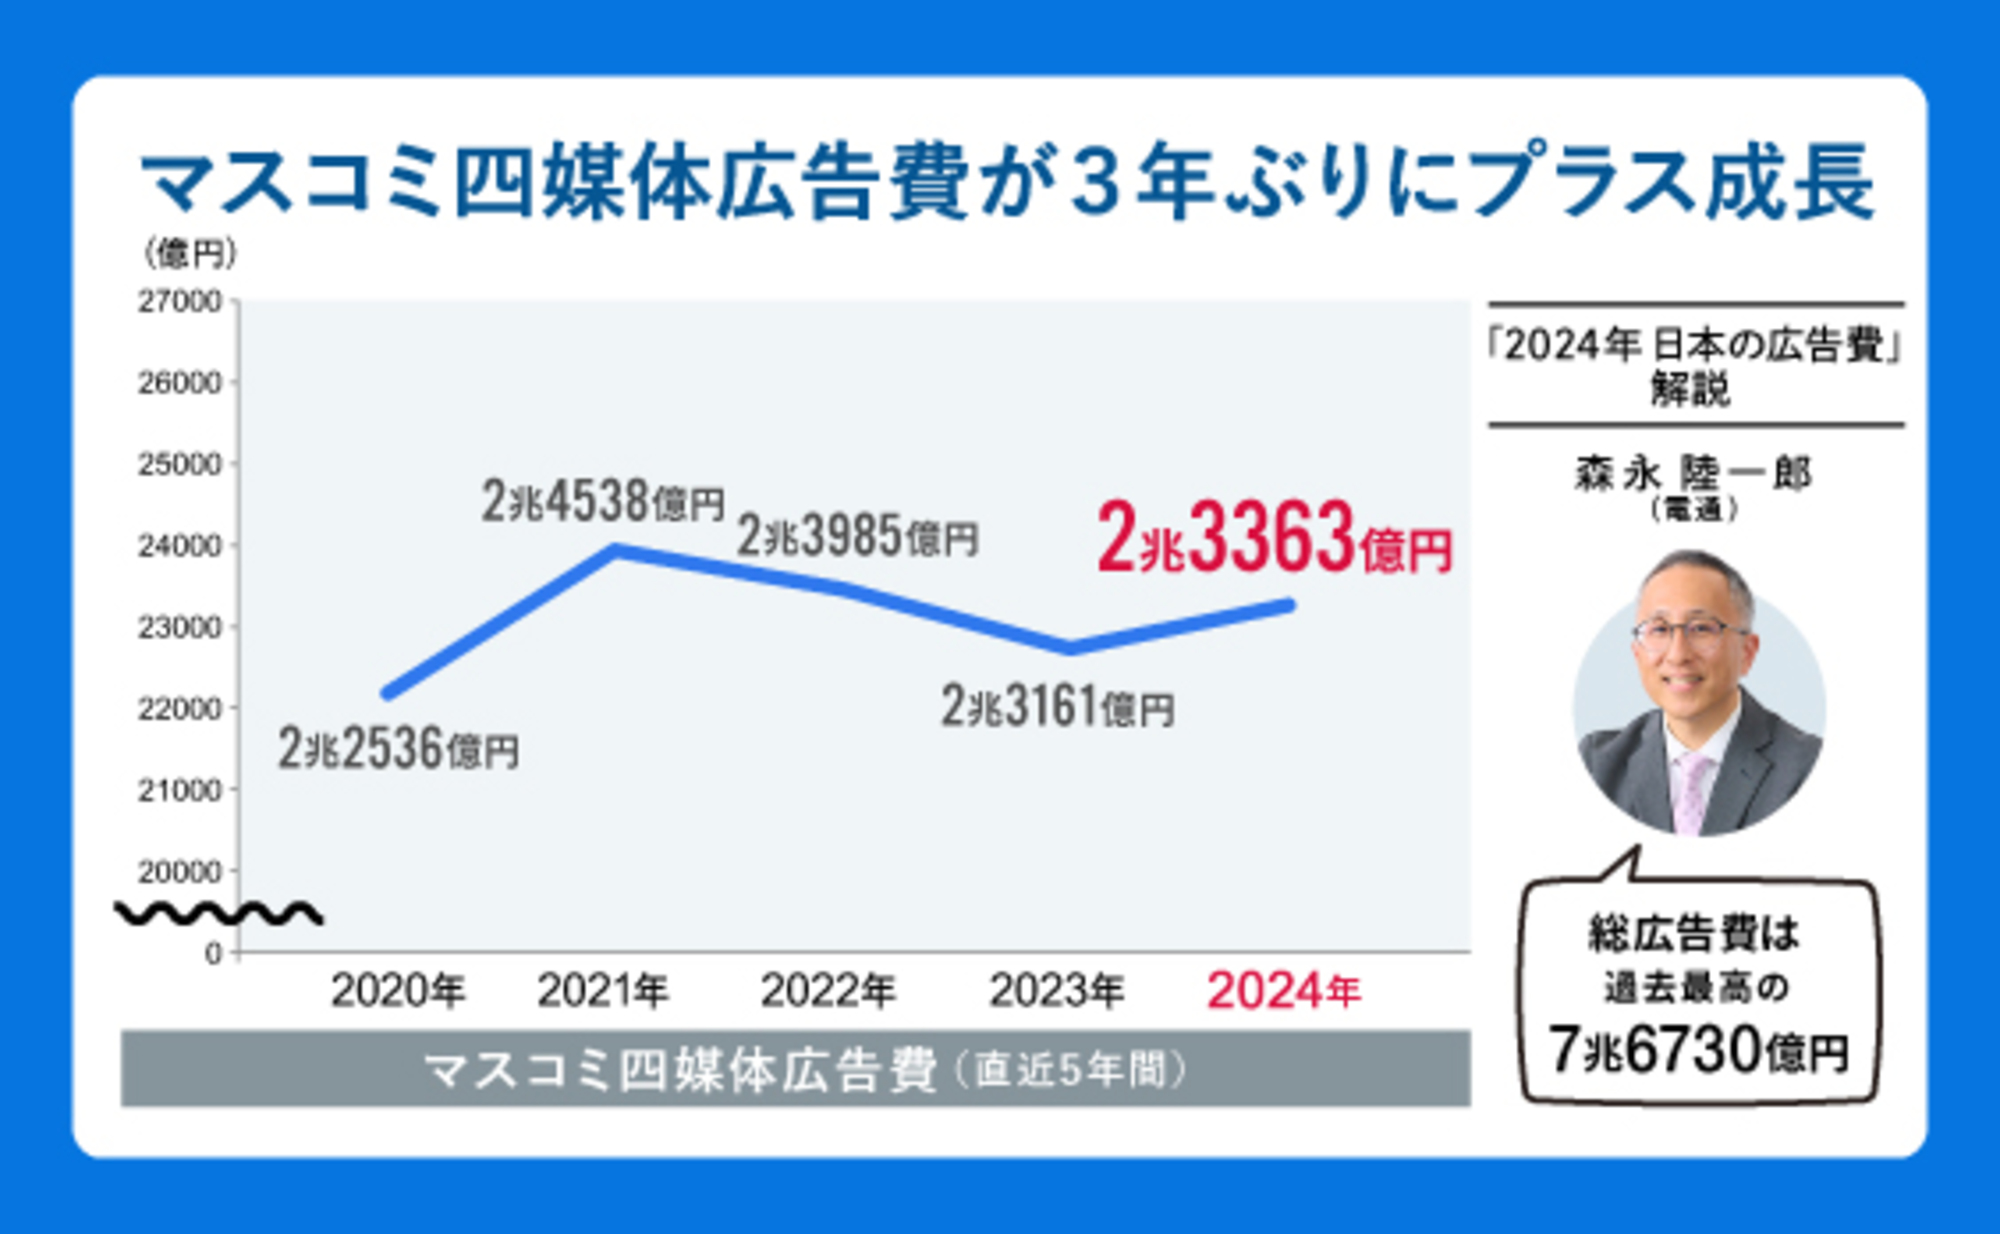
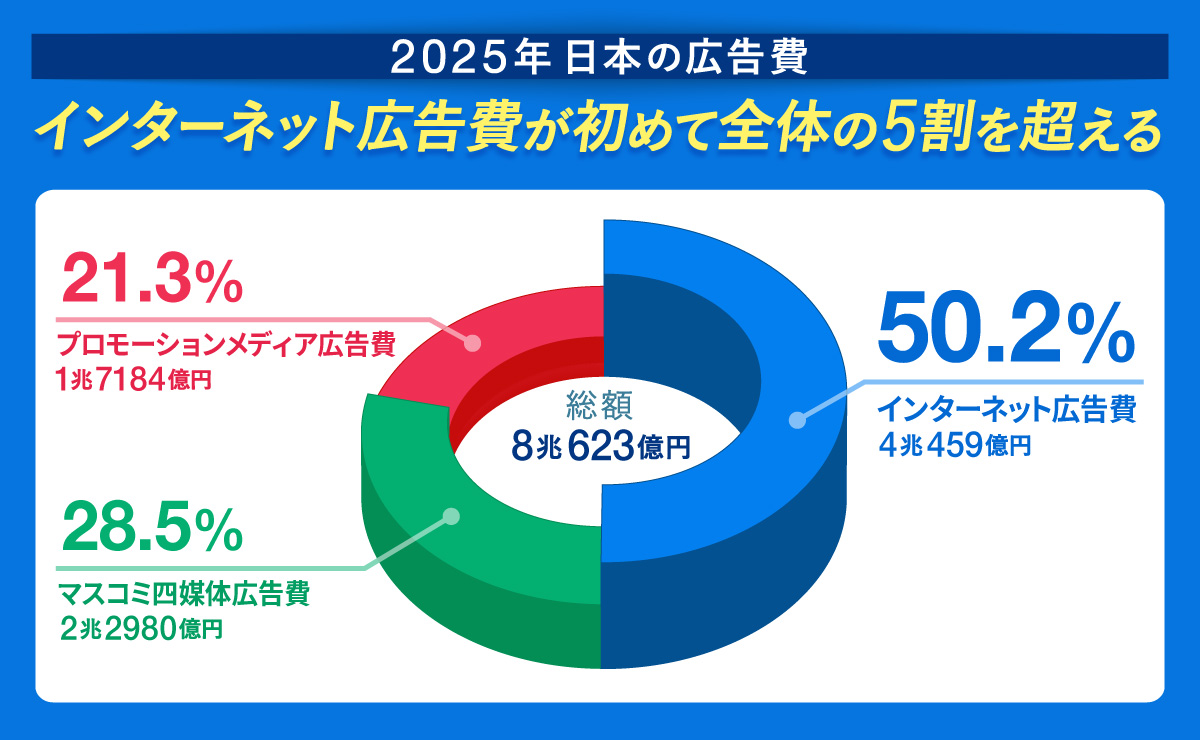
Morinaga: Japan's total advertising expenditure for 2025 (January to December) reached ¥8.0623 trillion, a 5.1% increase year-on-year. This marks the fourth consecutive year of record highs since 2022.
Growth was driven by the expansion of video and social advertising, accelerated digital investment due to strong corporate performance, and the hosting of major events.
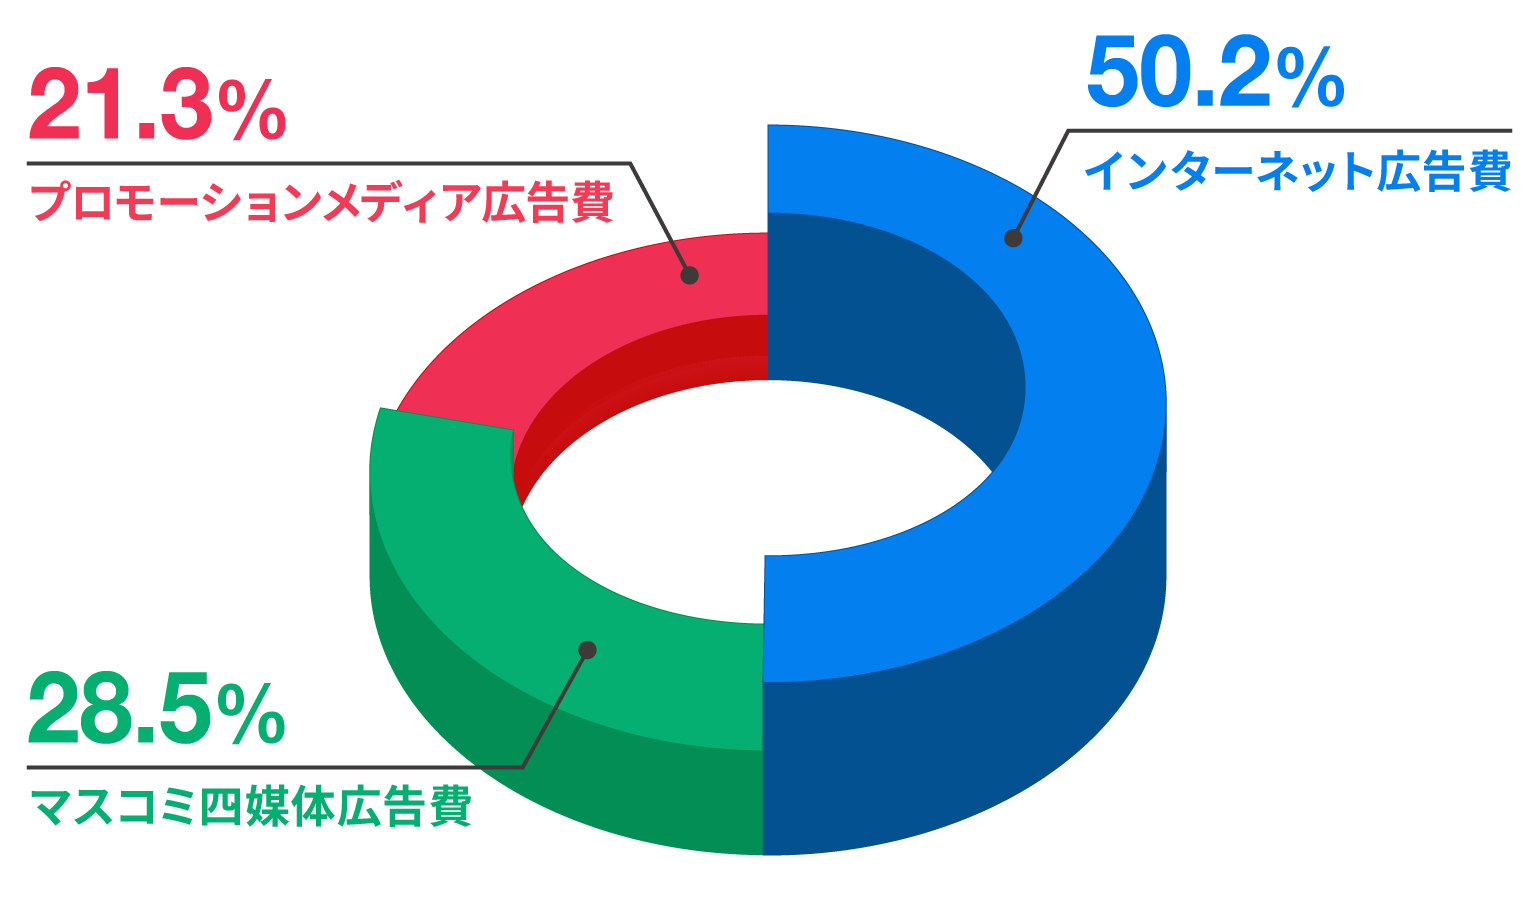
Particularly noteworthy is "Internet Advertising Expenditures," which accounted for 50.2% of total advertising expenditures, exceeding 50% for the first time.
*Since 2019, Japan's advertising expenditure estimates have included "e-commerce platform advertising" and "event advertising," but no retrospective adjustments have been made for 2018 or earlier. For details, please refer to Japan's Advertising Expenditure Knowledge & Data.
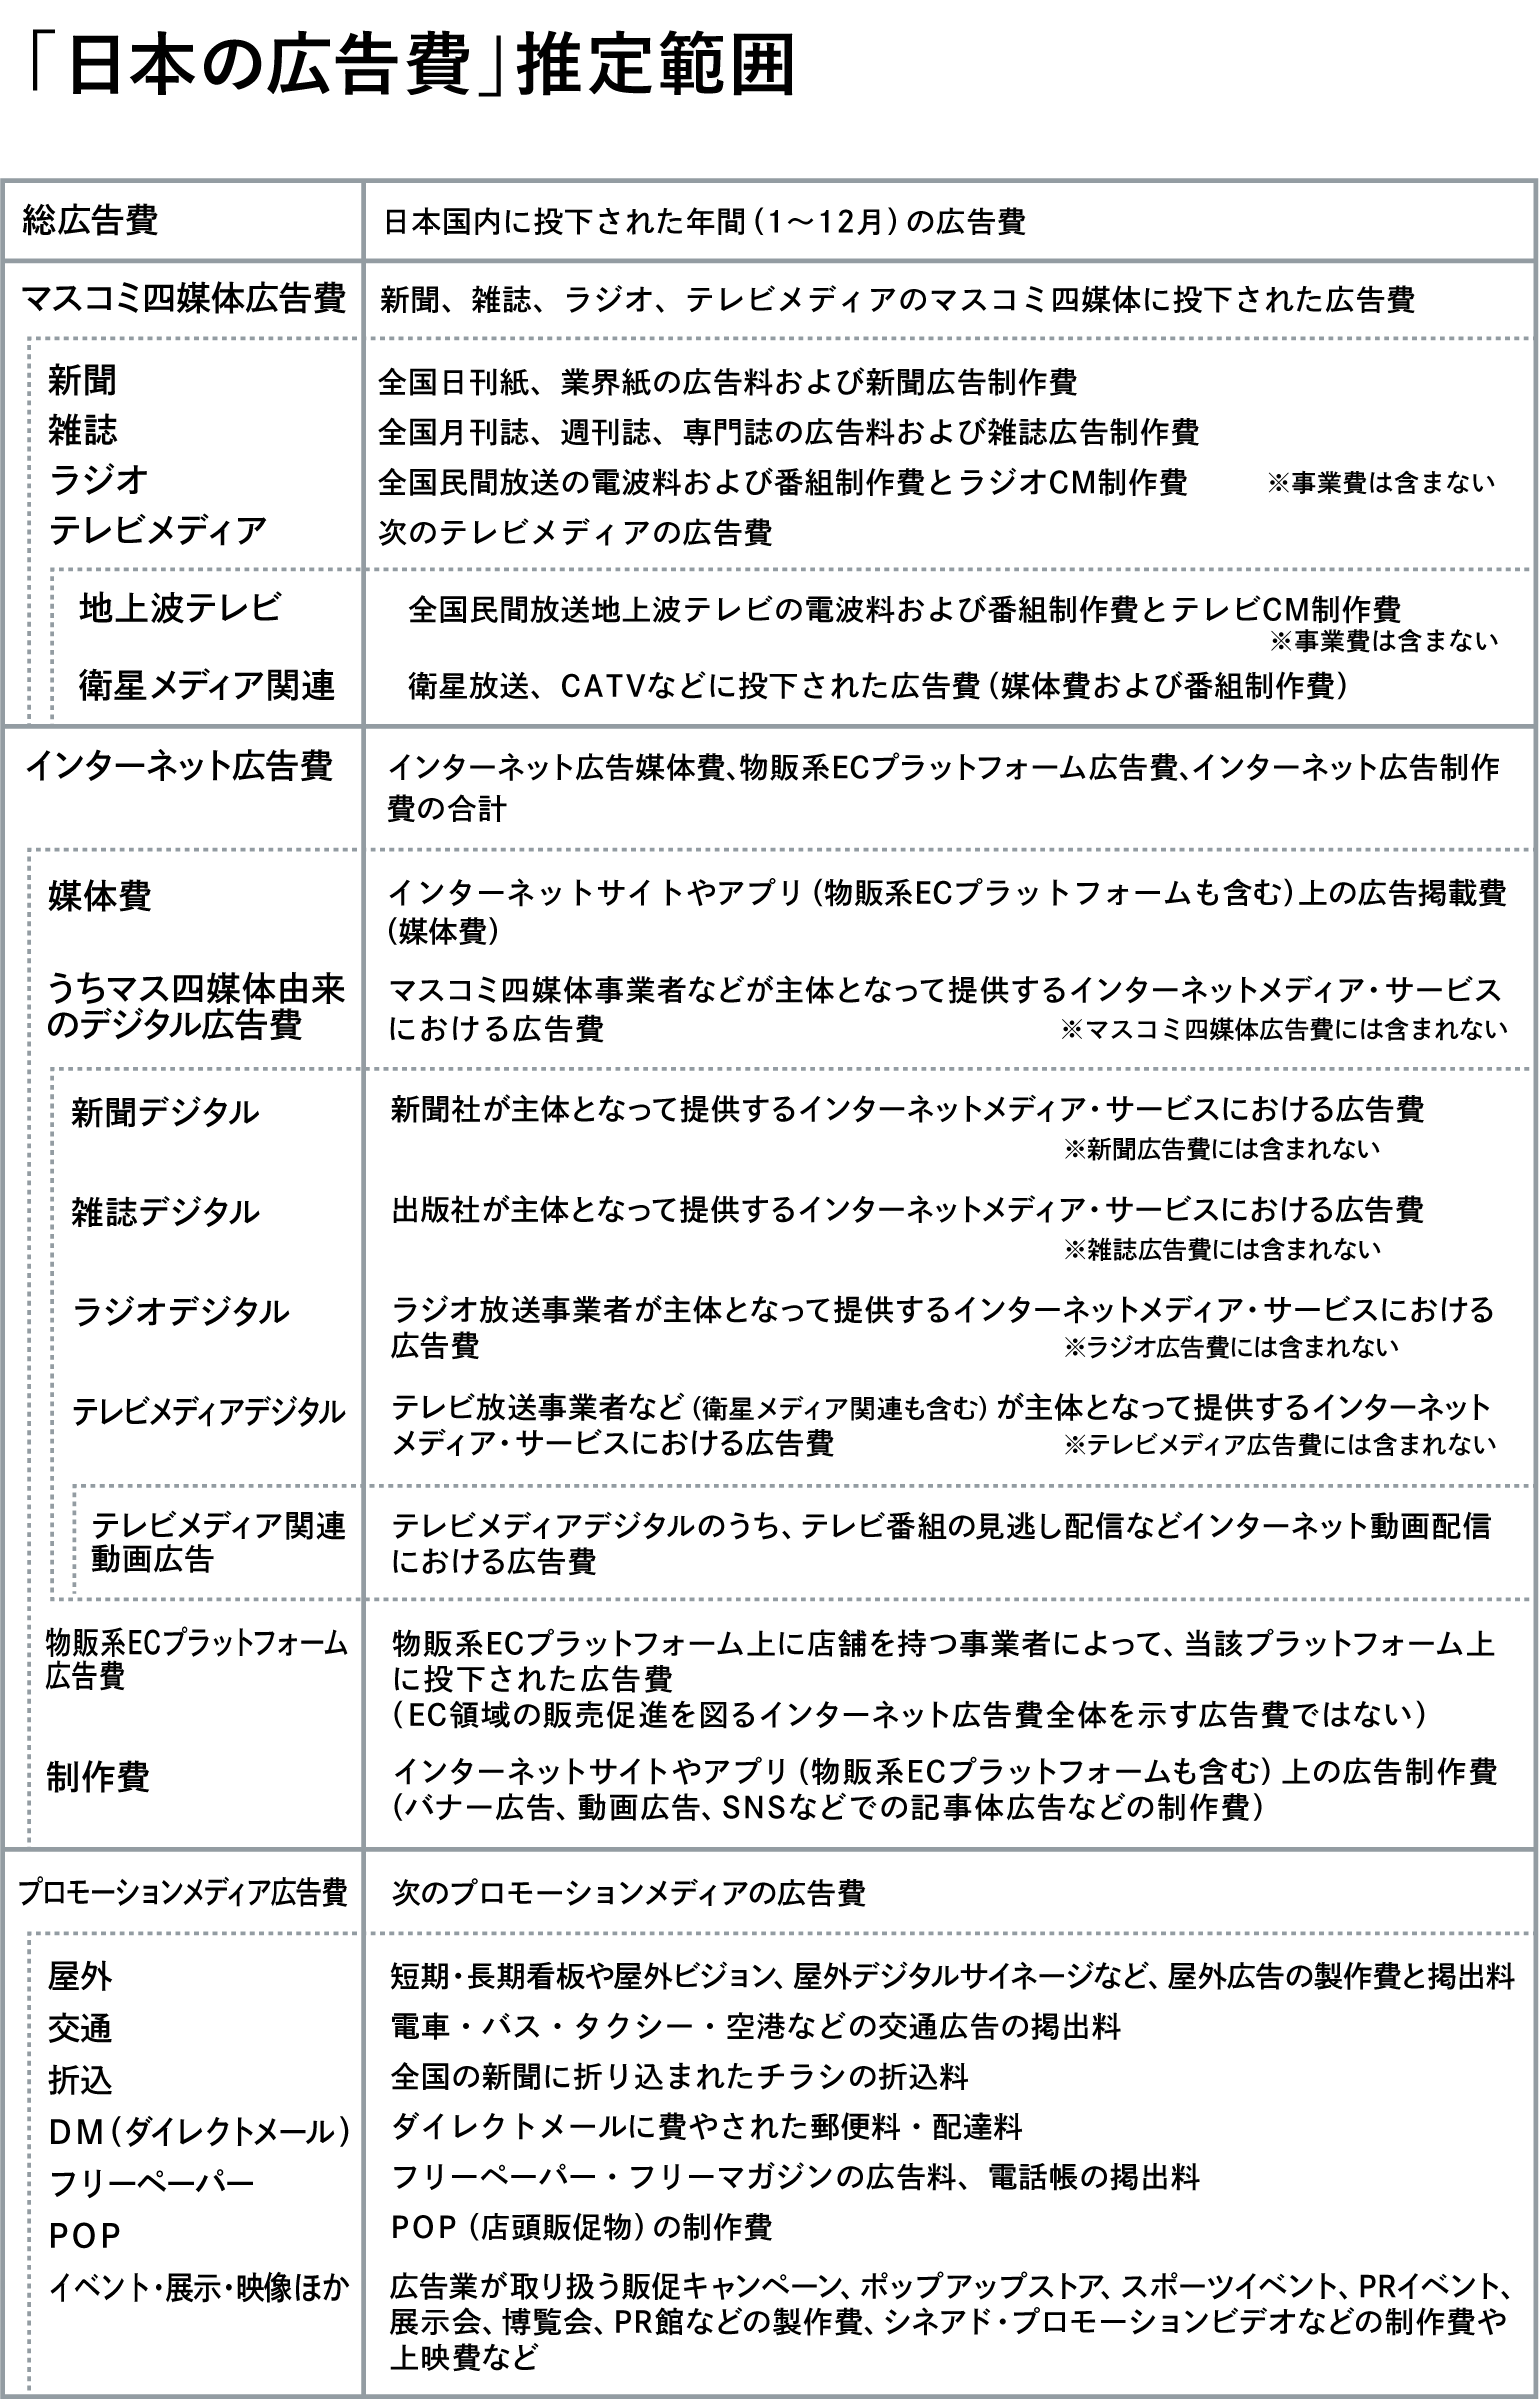
Morinaga: Japan's advertising expenditure is broadly categorized into the following three categories.
"Internet Advertising Expenditures" "Mass Media Advertising Expenditures" "Promotional Media Advertising Expenditures"
Internet advertising expenditure continued to grow steadily this year. Promotion media advertising expenditure also increased significantly, particularly in outdoor advertising, transit advertising, POP, and especially "events, exhibitions, video, and others." Advertising expenditure for the four mass media remained flat.
By 2025, the "structural shift" in Japan's advertising spending will have progressed further and become established. Digital investment accelerated, driven by factors like AI penetration, leading to significant growth in Internet Advertising Expenditures. Simultaneously, the recovery of post-COVID foot traffic enhanced the value of real-world experiences, and large-scale events contributed to the growth in Promotional Media Advertising Expenditures.
① "Internet advertising" exceeds 50% for the first time. "Video" and "Social" lead the way
──Next, please provide an overview of internet advertising spending.
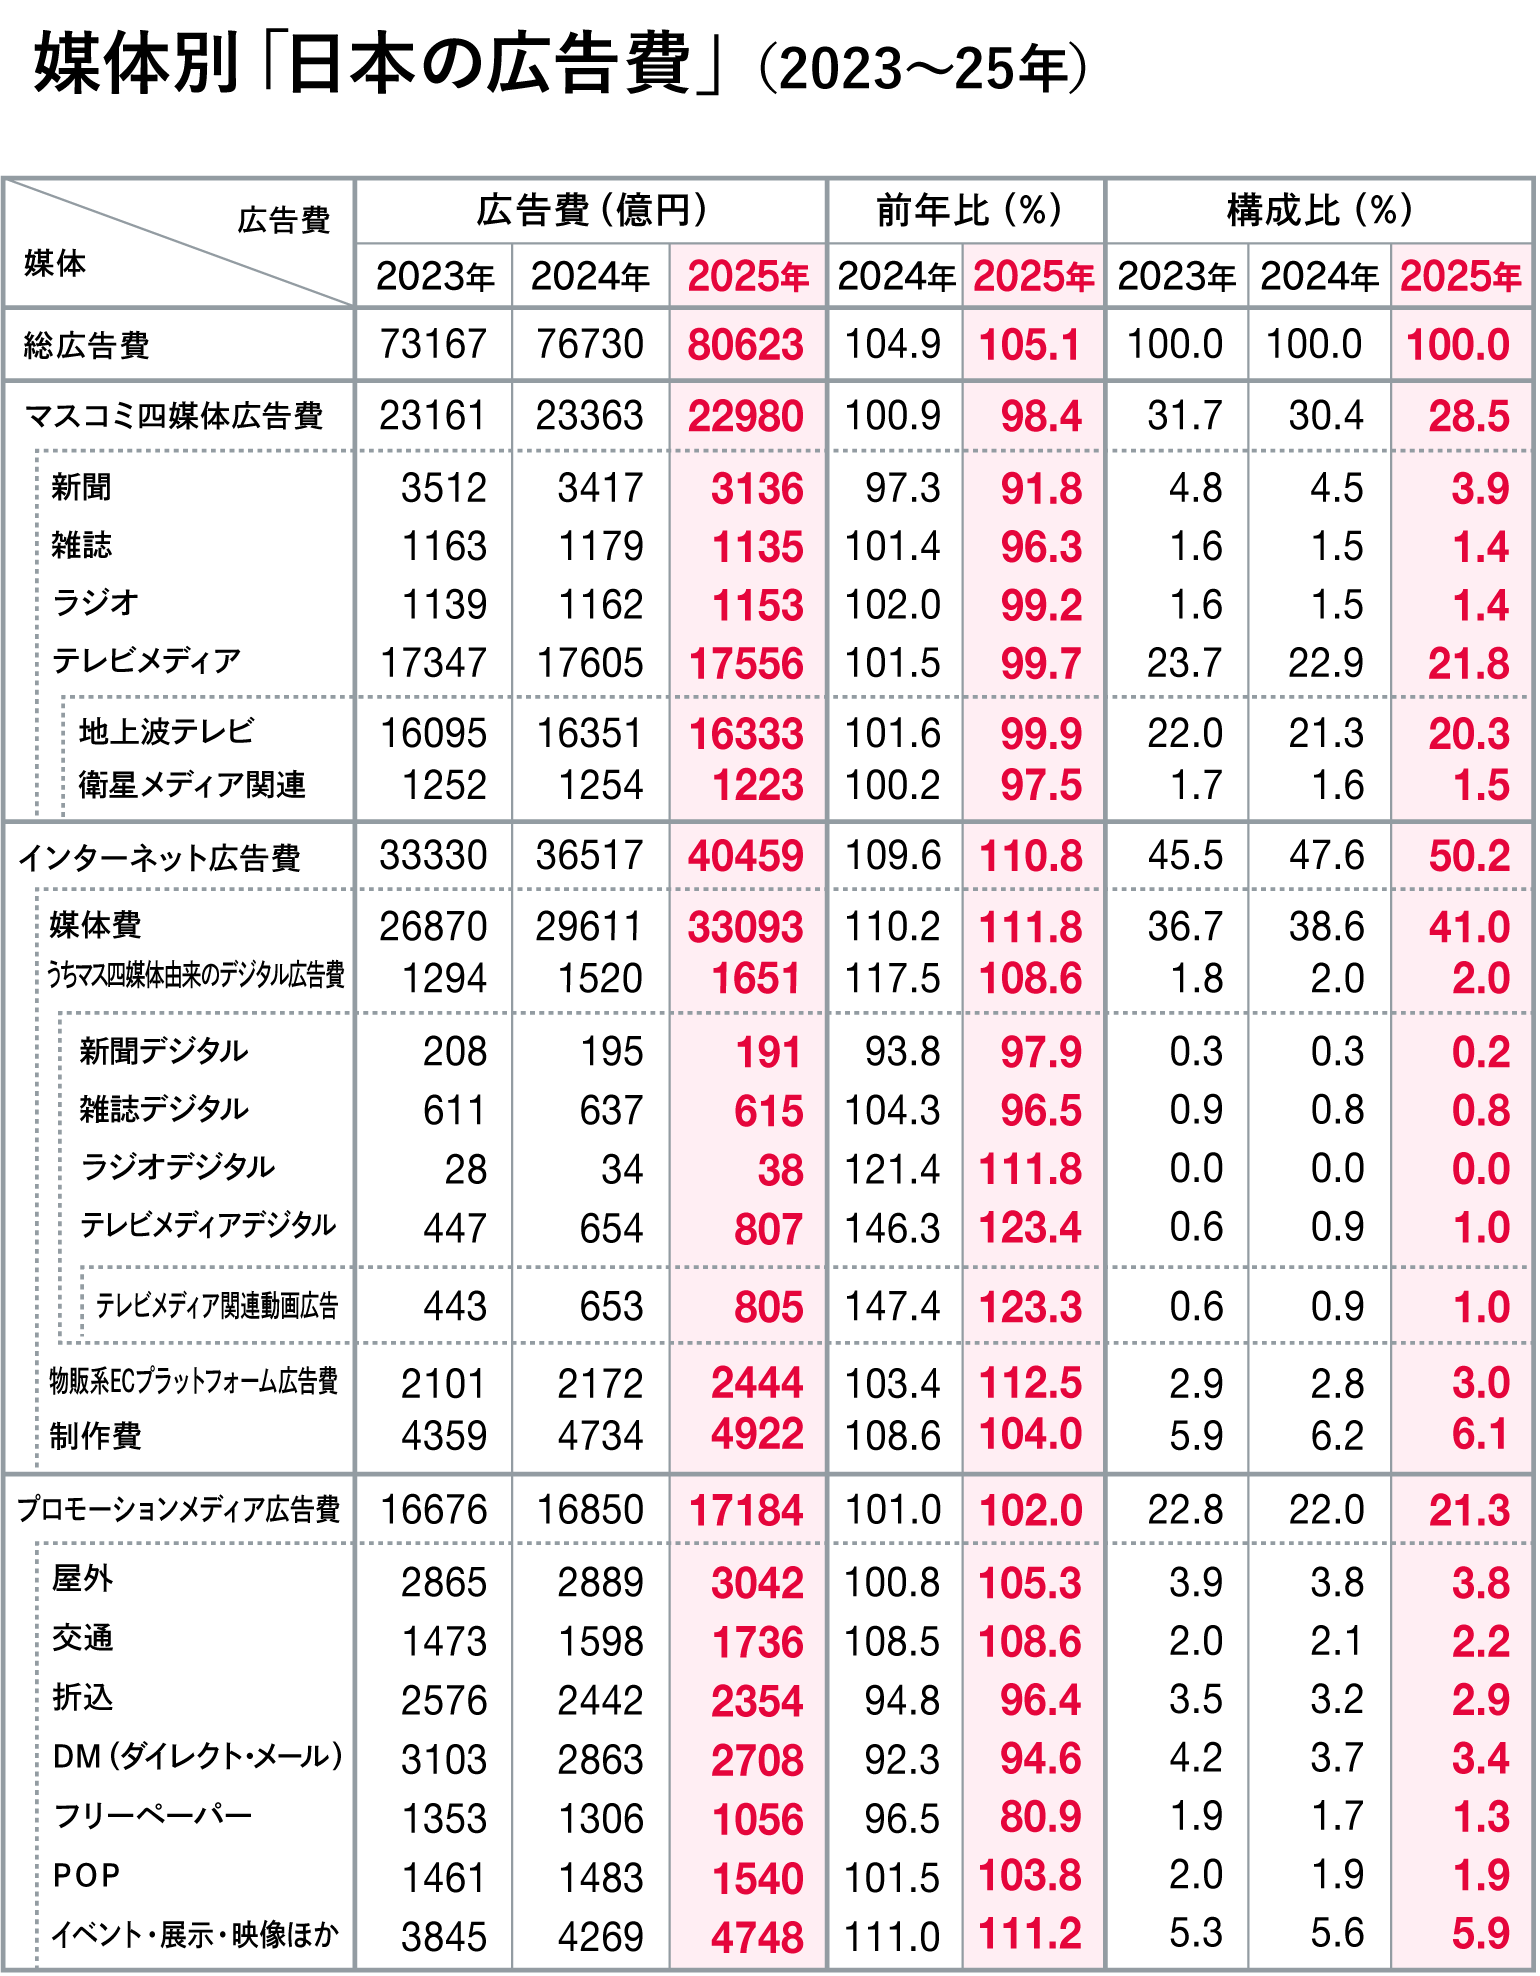
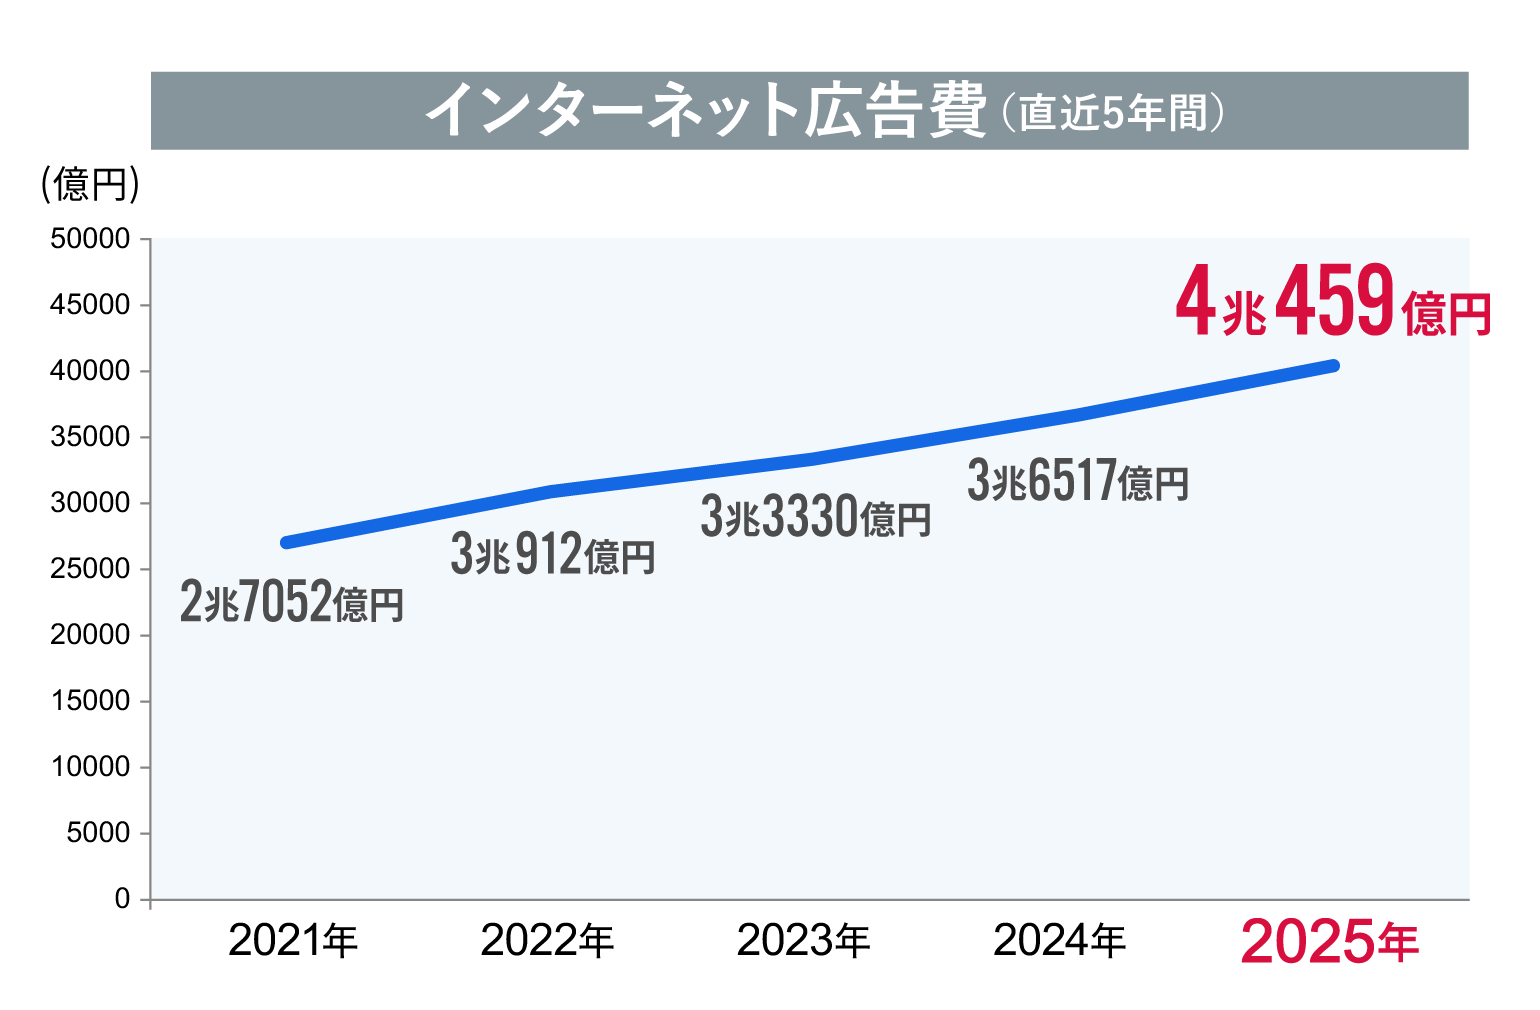
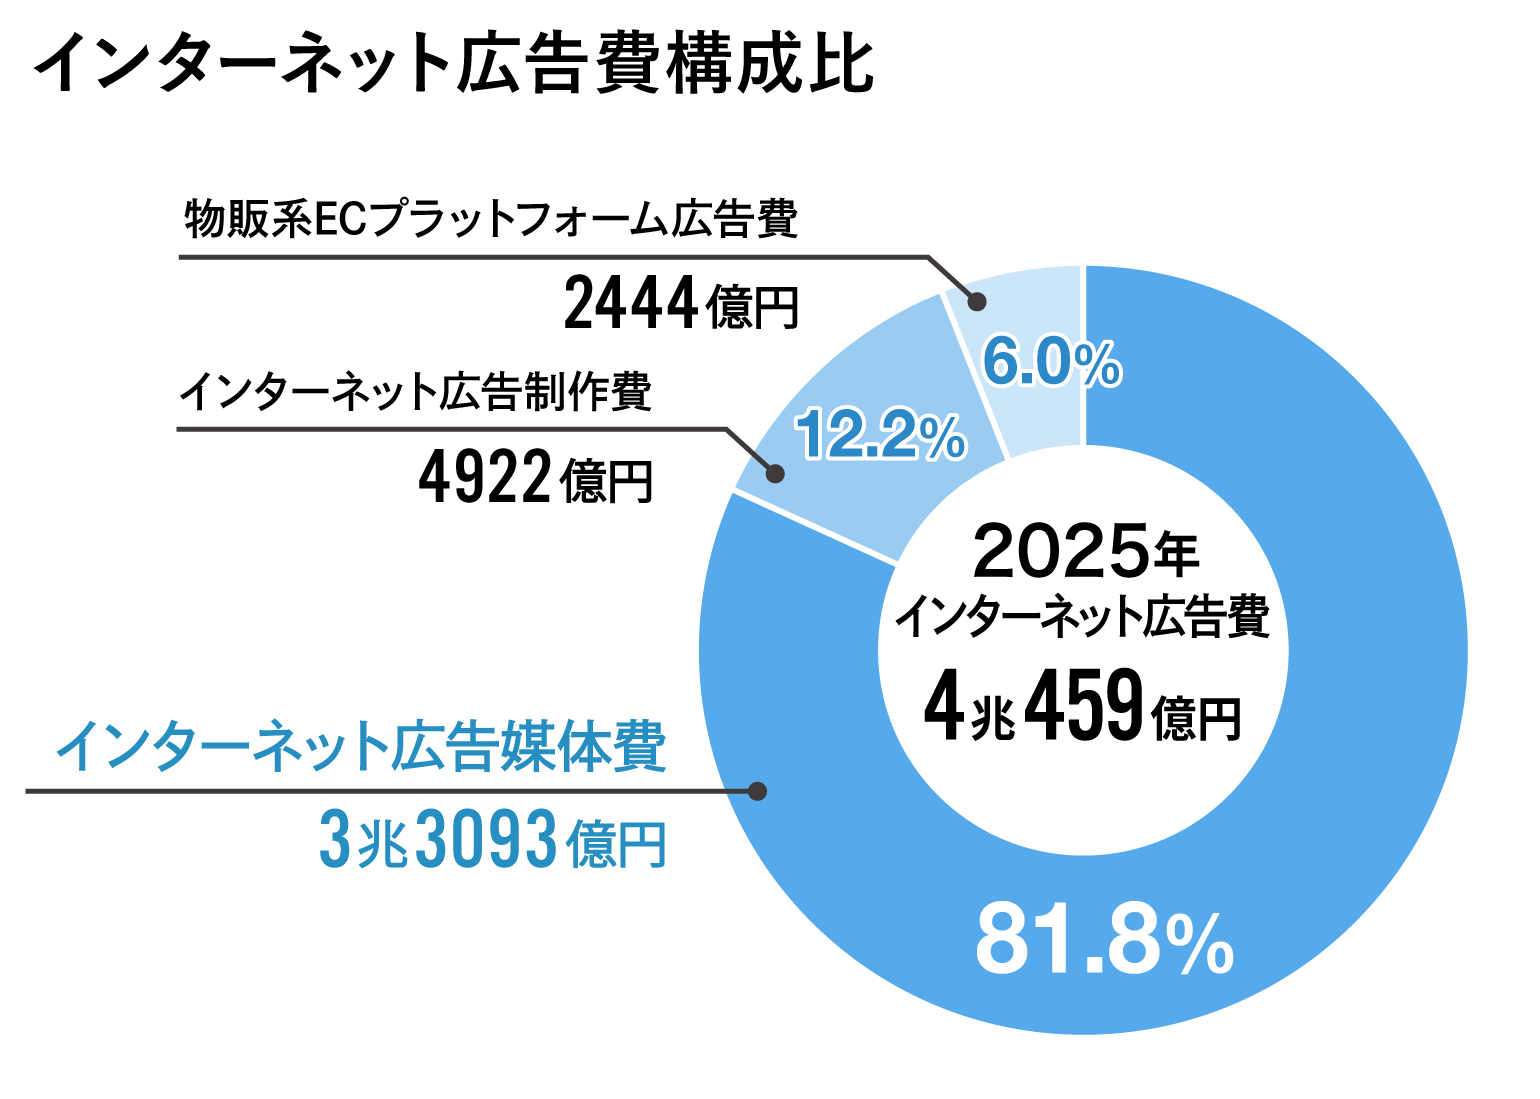
Takamatsu: Internet advertising expenditure reached ¥4.0459 trillion, a 10.8% increase year-on-year, continuing to set a new record high. Its share of Japan's total advertising expenditure reached 50.2%, surpassing the 50% mark for the first time.
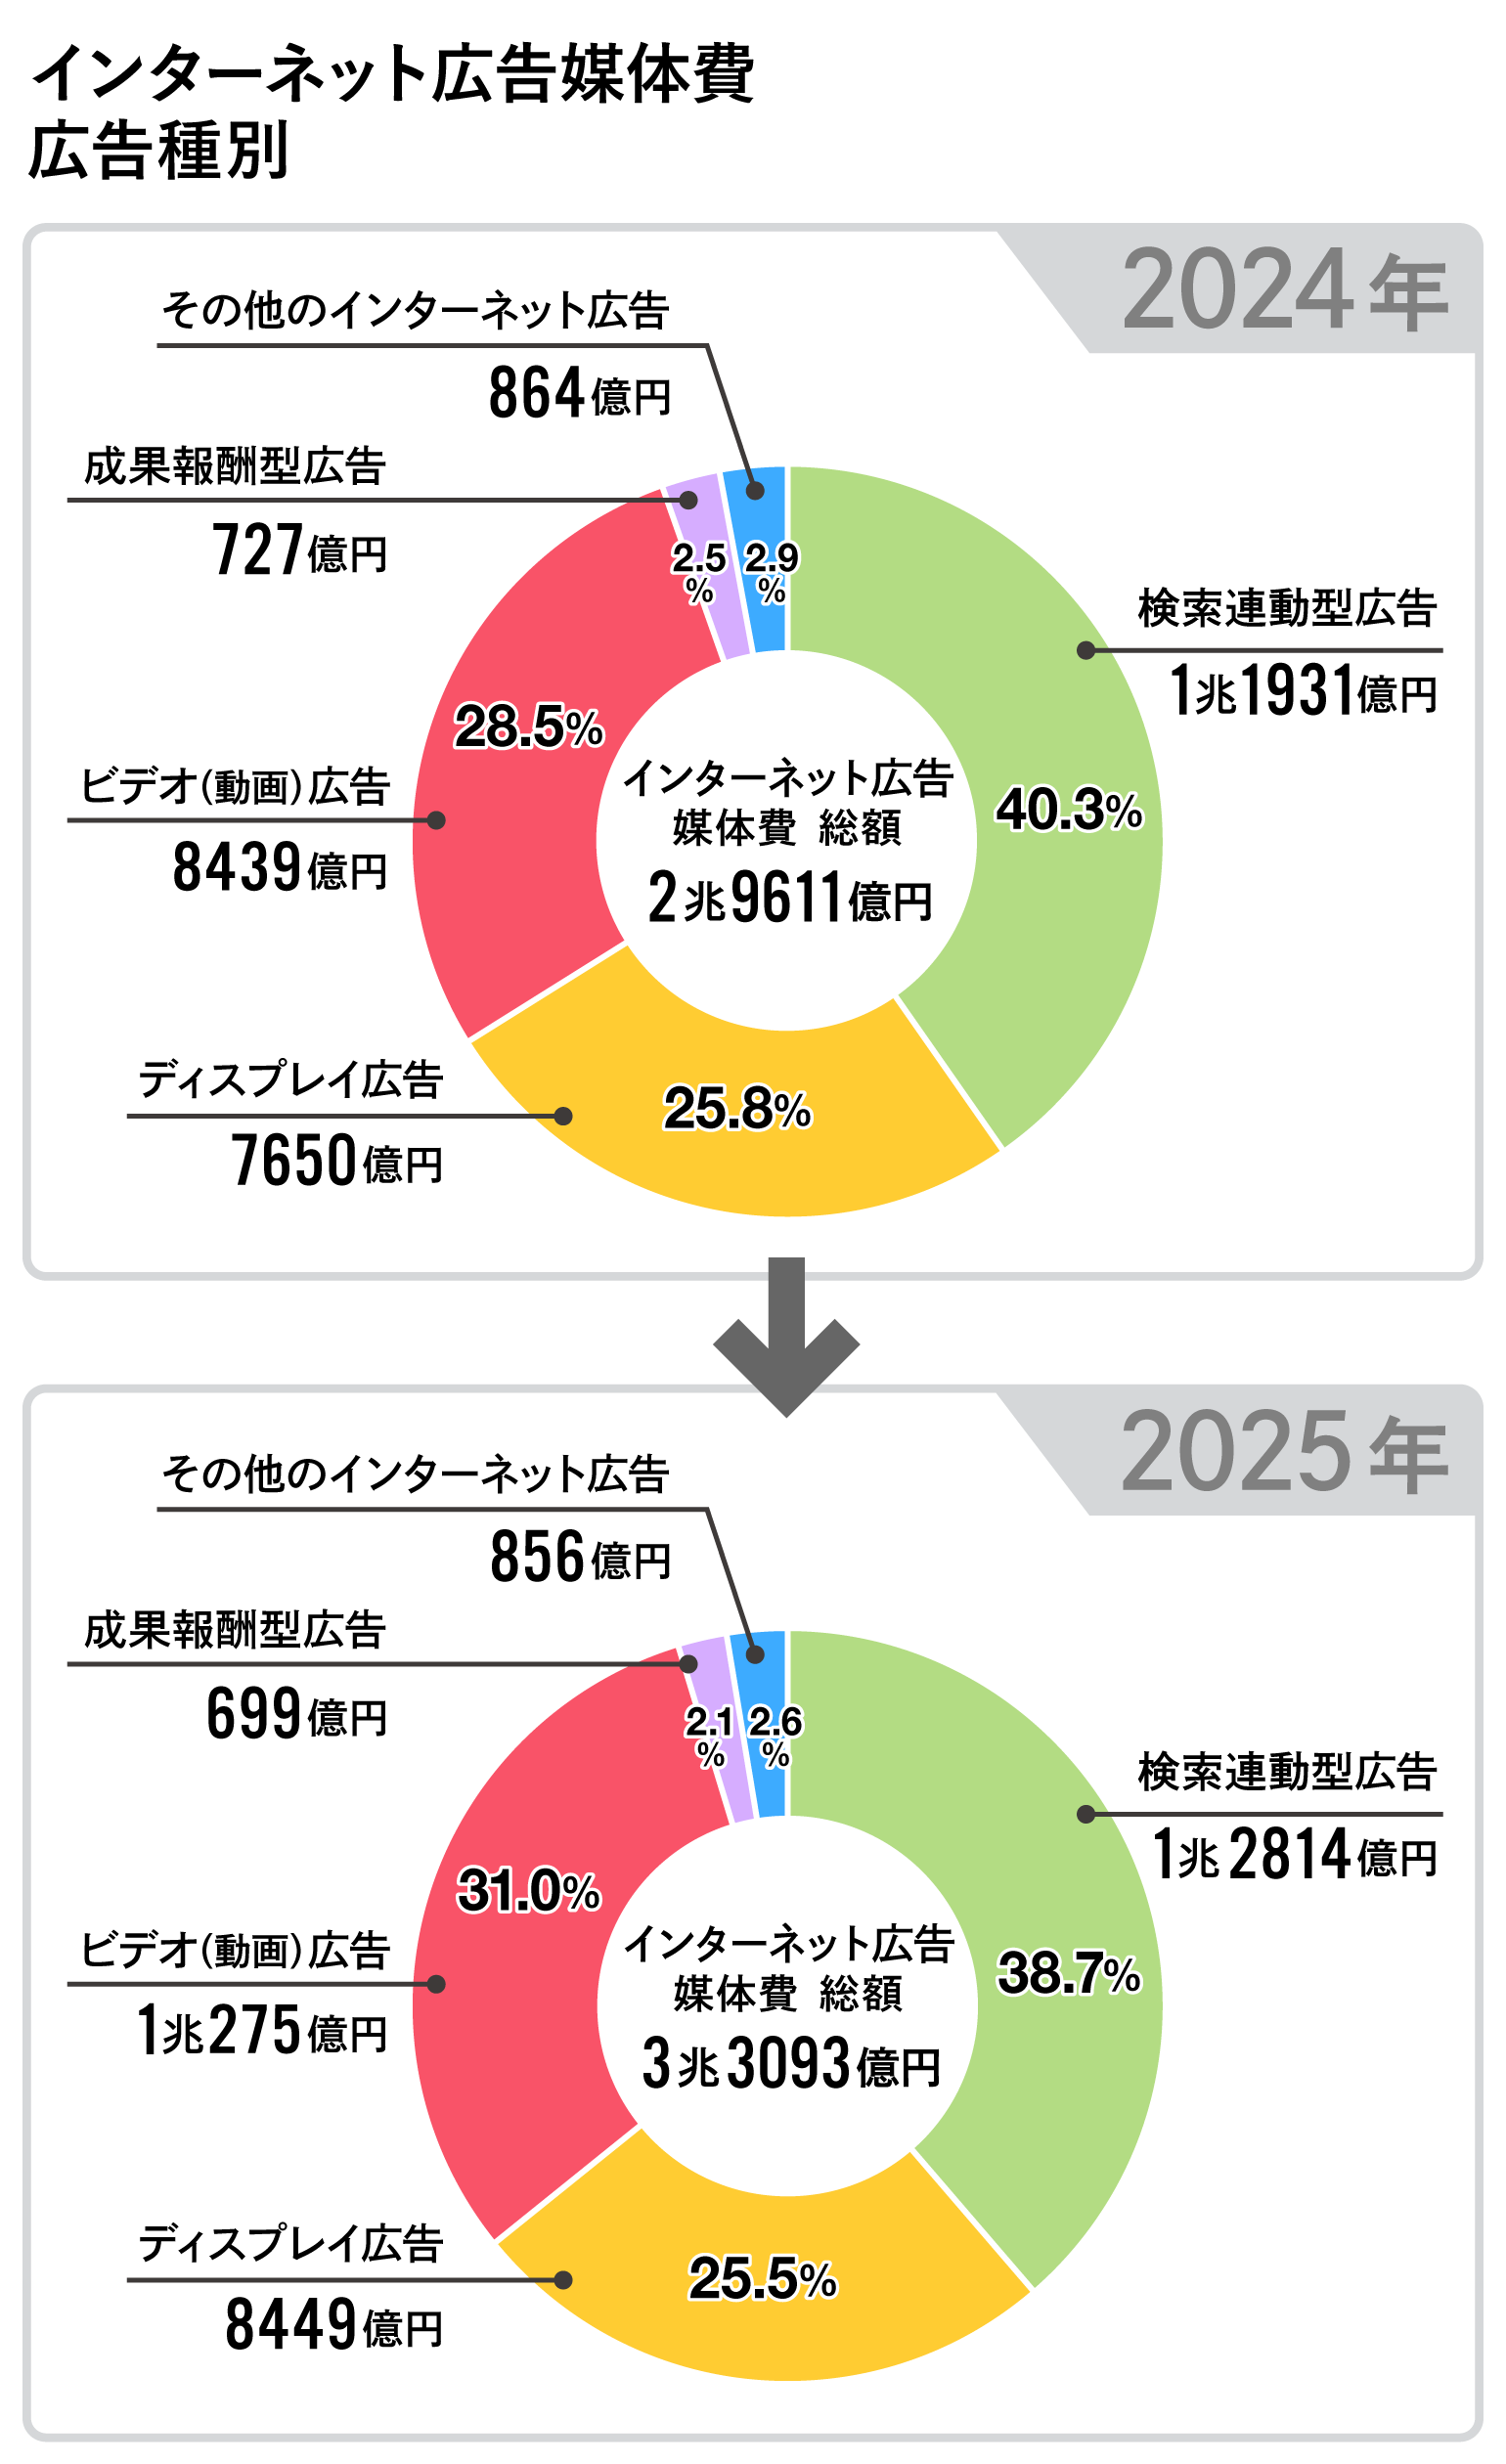
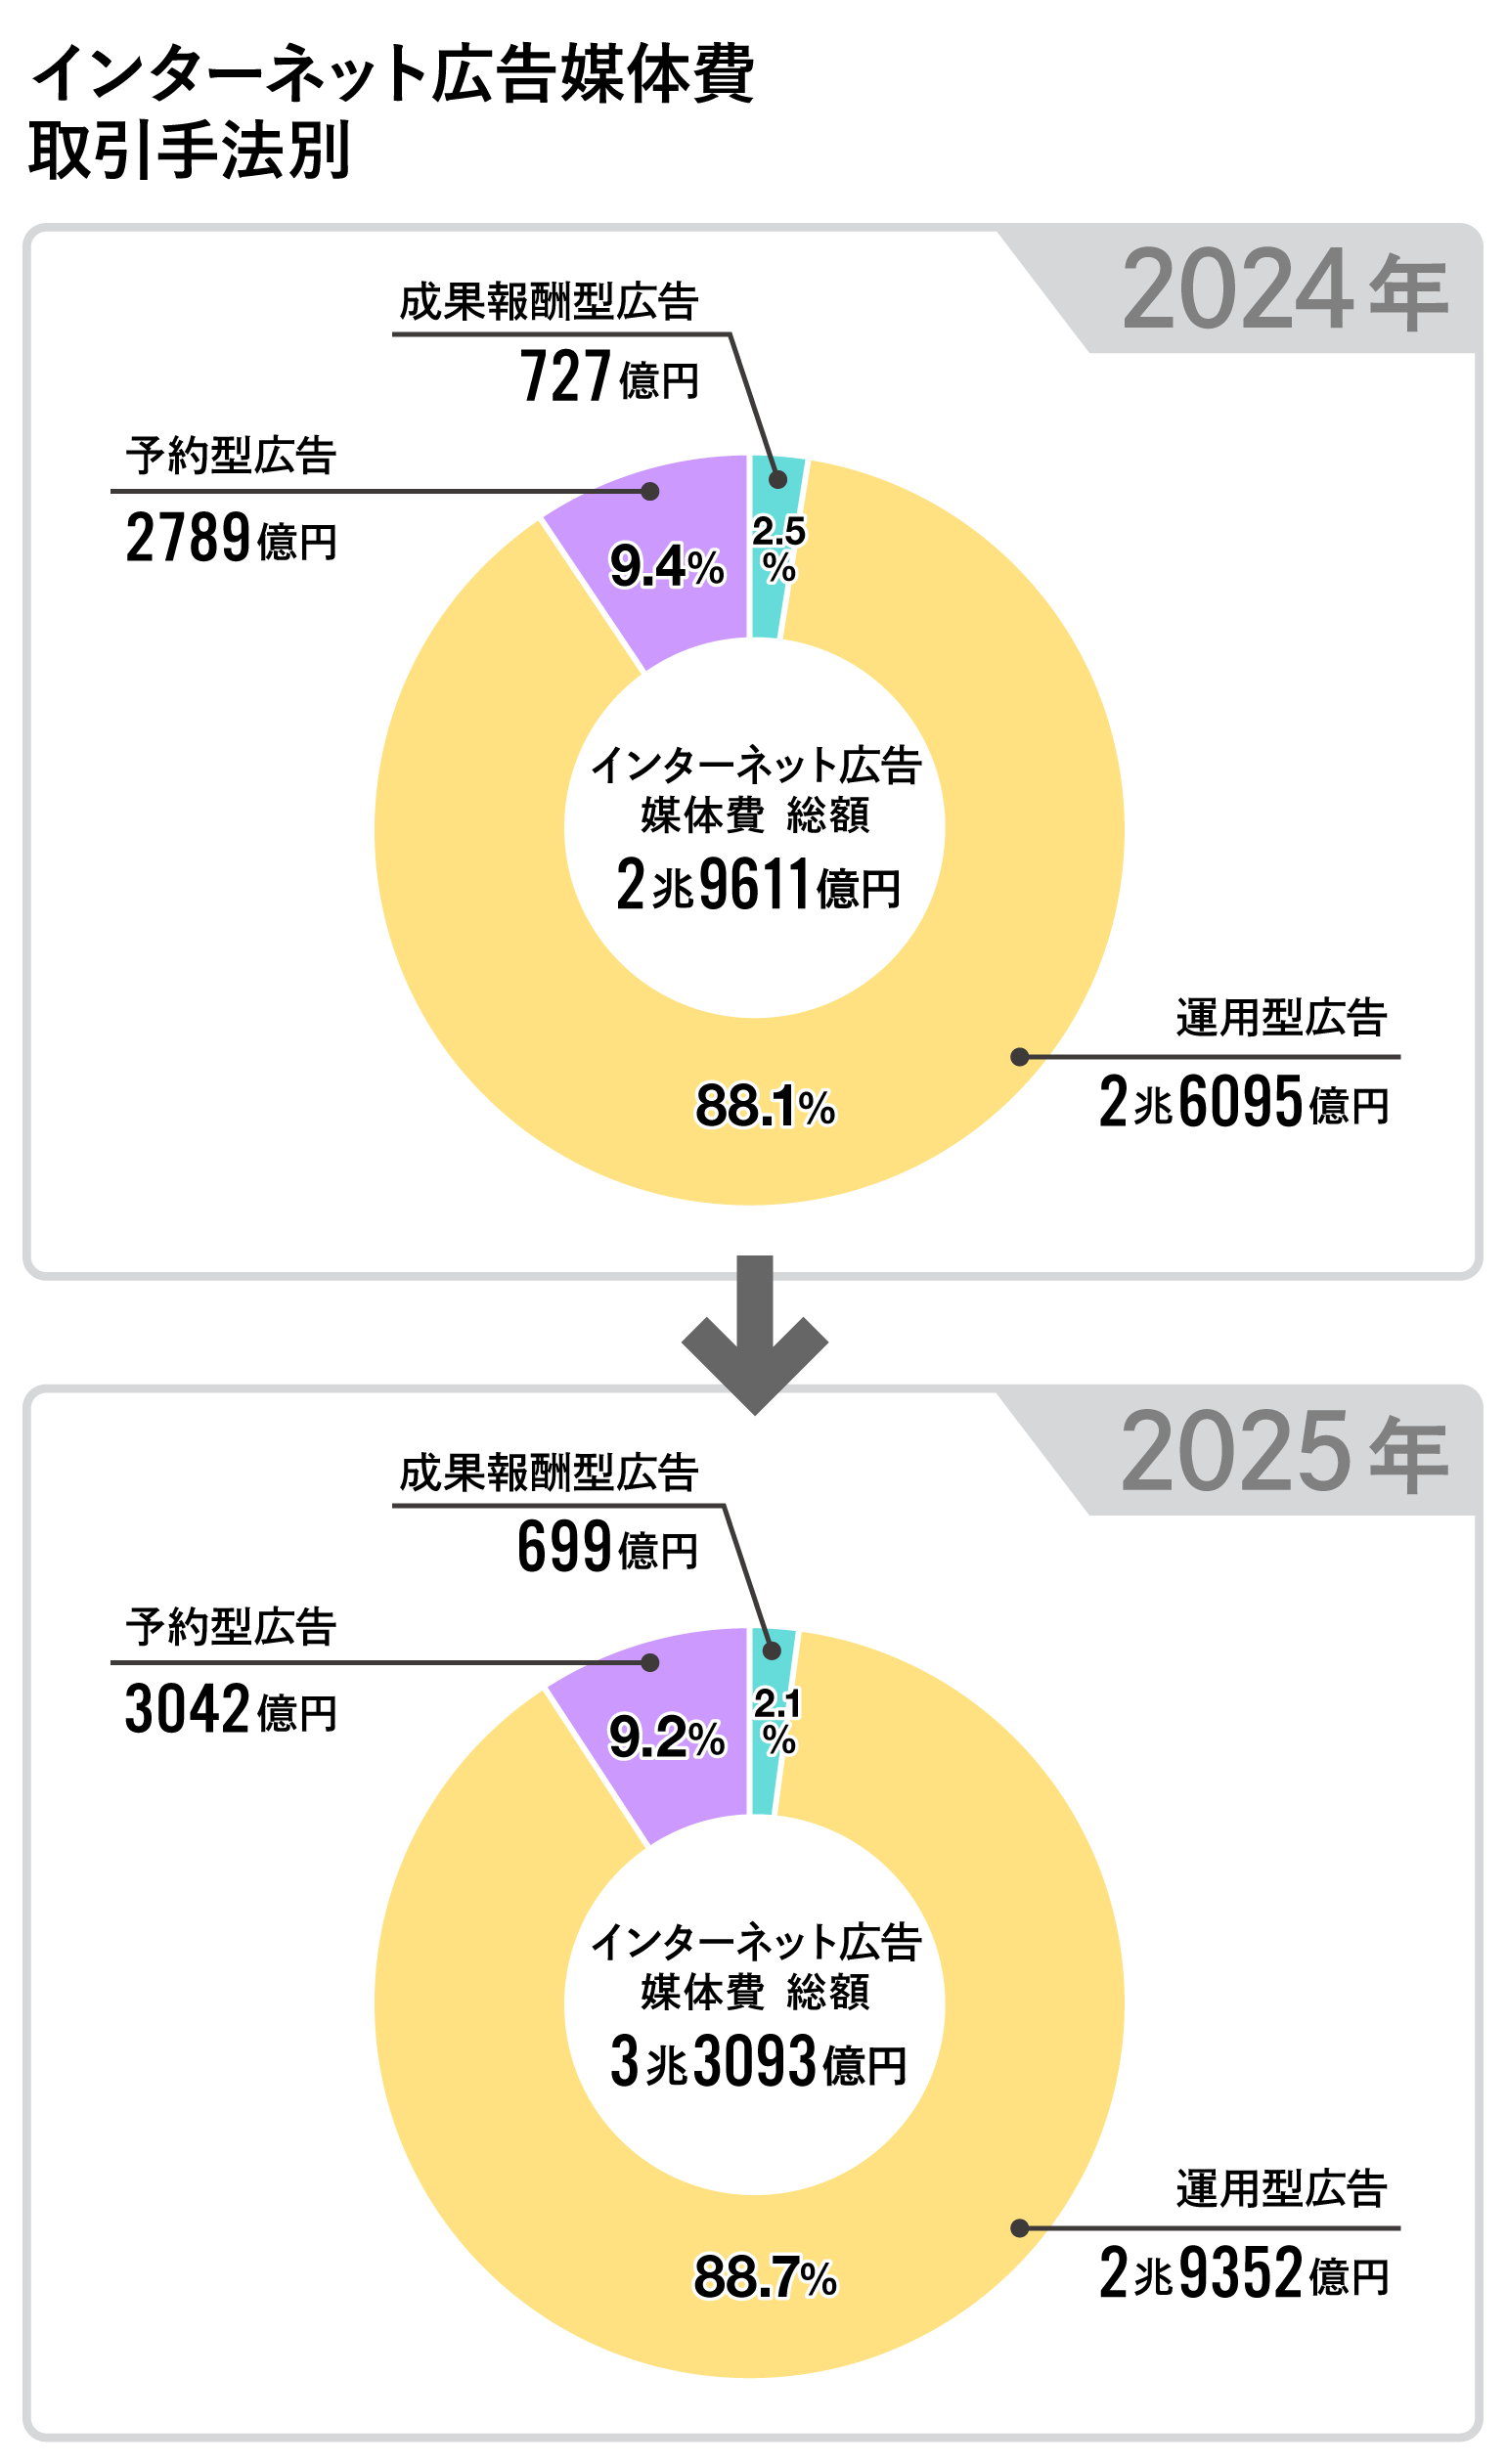
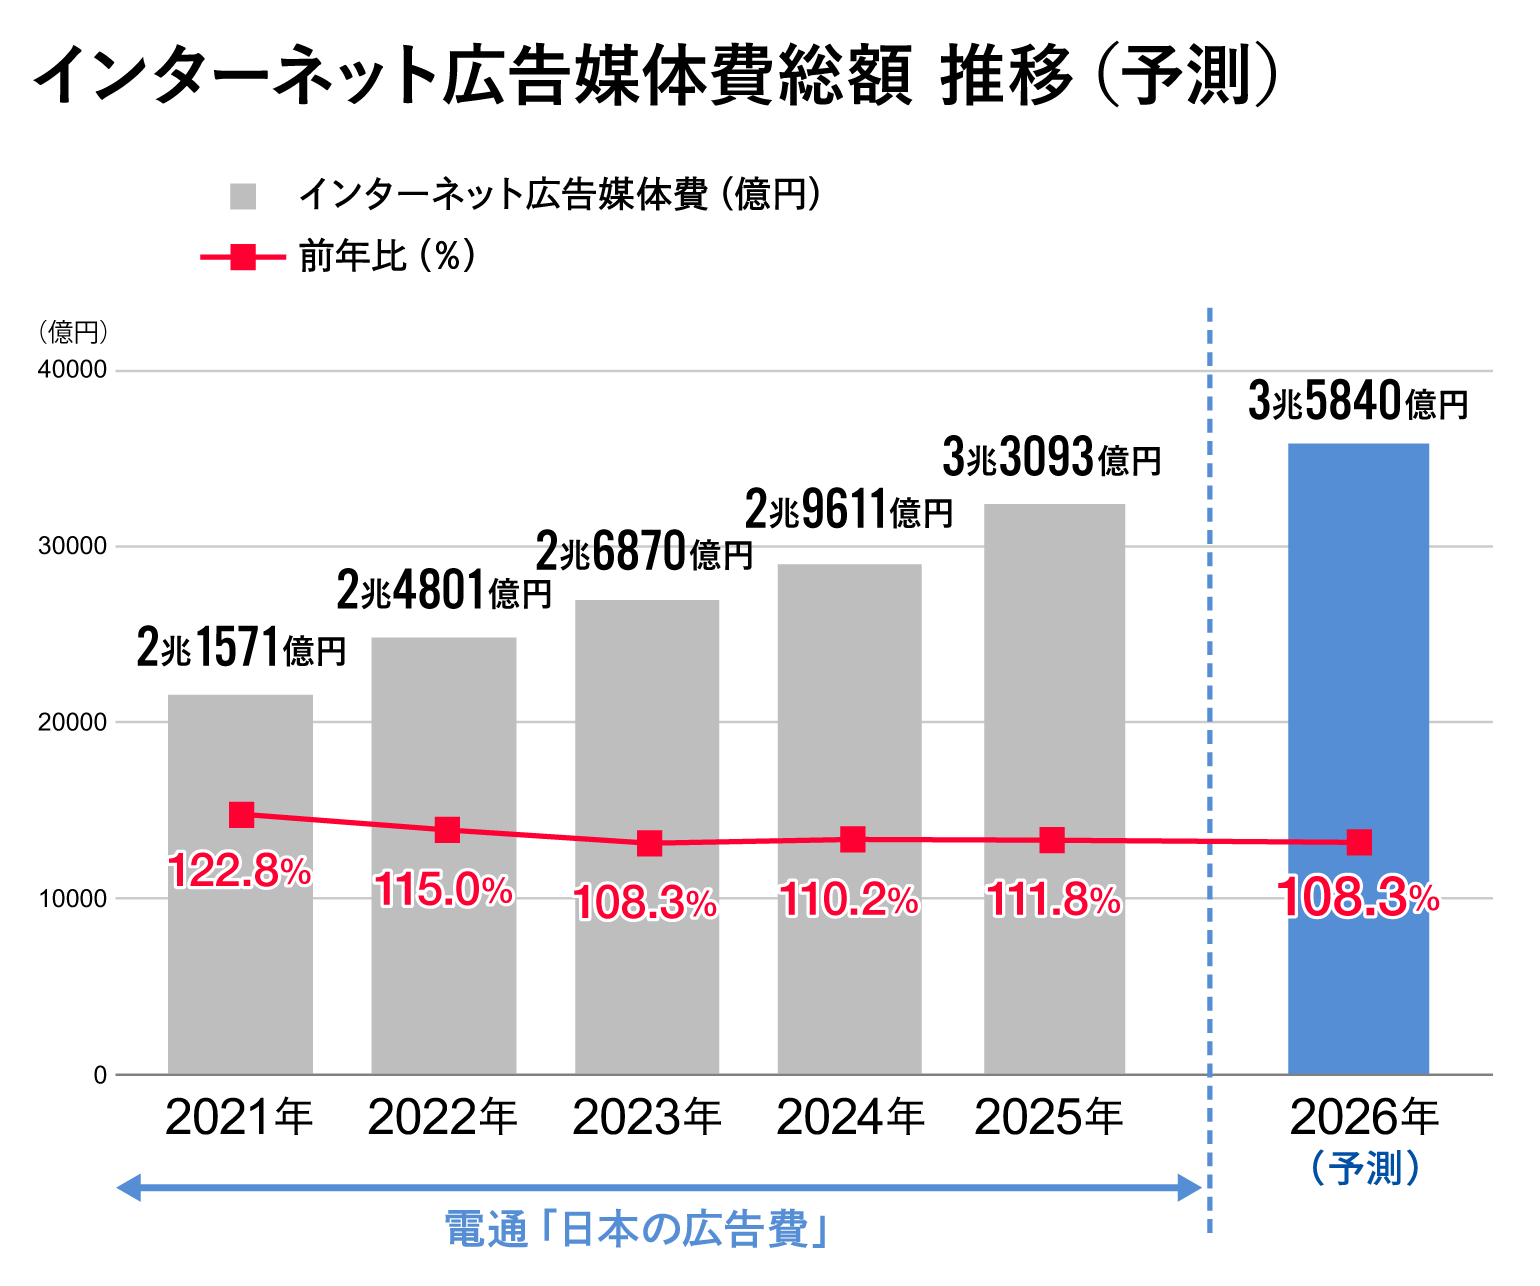
Takamatsu: Within this, "Internet advertising media costs" (excluding "Internet advertising production costs" and "E-commerce platform advertising costs") reached ¥3,030.93 billion (111.8% year-on-year).
Takamatsu: We highlight the following two factors driving the increase in internet advertising media costs:
1. "Video Advertising" Surpassed ¥1 trillion for the first time since estimates began. It significantly drove overall growth, accounting for over 30% of internet advertising media costs.
2. "Social Advertising" Surpassed ¥1 trillion in 2024. In 2025, it grew by 118.7% year-on-year to ¥1.3067 trillion, achieving double-digit growth.
We will explain these two factors in detail later.
──What is the breakdown of internet advertising media spending?
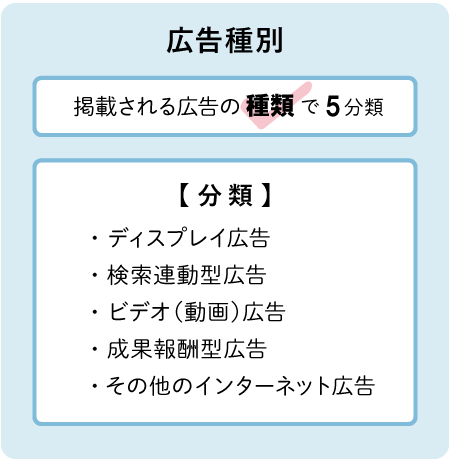
Takamatsu: First, let's look at the breakdown by "advertising type." Advertising types are classified into the following five categories.
Takamatsu: The standout is undoubtedly "Video Advertising Spending." By definition, this refers to "advertisements in video file format (visuals and audio)."
As mentioned earlier, it surpassed ¥1 trillion for the first time since estimates began, showing very strong growth and exceeding 30% of the total advertising spend by type.
Takamatsu: Other ad types are also growing across the board. "Display ads" refer to image-based ads displayed in ad spaces on websites or apps. After trending flat for several years, they grew, primarily driven by performance-based ads, reaching ¥844.9 billion, a 100.4% increase year-on-year.
Then, "search-linked advertising" refers to "ads displayed on search results pages based on specific keywords entered into search engines, primarily search sites." This corresponds to what is commonly known as listing ads. This segment reached ¥1.2814 trillion, a 107.4% increase year-on-year, and remained the top category among all advertising types in 2025.
──How would you break down internet advertising media costs by "transaction method"?
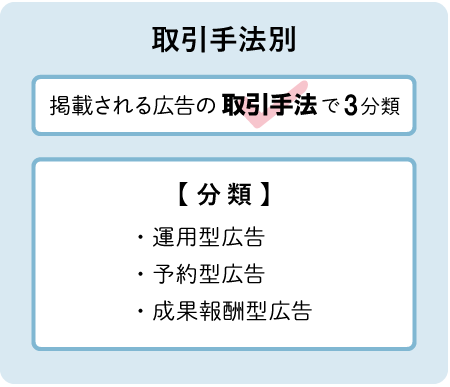
Takamatsu: Transaction methods fall into the three categories mentioned above.
Takamatsu: "Programmatic advertising" refers to ads traded via bidding methods through platforms like search-linked ads or video-sharing sites, DSPs (Demand-Side Platforms), and ad networks.
On the other hand, "reserved advertising" refers to ads traded at a fixed price (non-auction) as specific non-search ads or tie-up ads.
"Performance-based advertising" refers to ads where compensation is paid to the media or the viewing user based on the actions taken by users who viewed the ad (such as clicks or purchases).
Takamatsu: Programmatic advertising accounts for nearly 90% of internet advertising media costs, reaching ¥2.9352 trillion (112.5% year-on-year), continuing double-digit growth.
Reservation-based advertising showed steady growth at ¥304.2 billion (109.1% year-on-year). Performance-based advertising decreased to ¥69.9 billion (96.1% year-on-year).
──How about the figures when cross-referencing ad type and transaction method?
Takamatsu: Looking at the share of total internet advertising media costs by advertising type × transaction method, "programmatic search-linked advertising" had the highest share at 38.7%.
Next was "managed video advertising" at 26.3%, surpassing "managed display advertising" for the second consecutive year.
Incidentally, the much-discussed video advertising saw significant growth: "programmatic video advertising" reached ¥869.1 billion, a 122.1% increase year-on-year, while "reserved video advertising" reached ¥158.4 billion, a 120.0% increase year-on-year.
Video advertising surpassed ¥1 trillion, accounting for over 30% of all ad types.
──Please elaborate on the "video advertising" mentioned earlier as a key point.
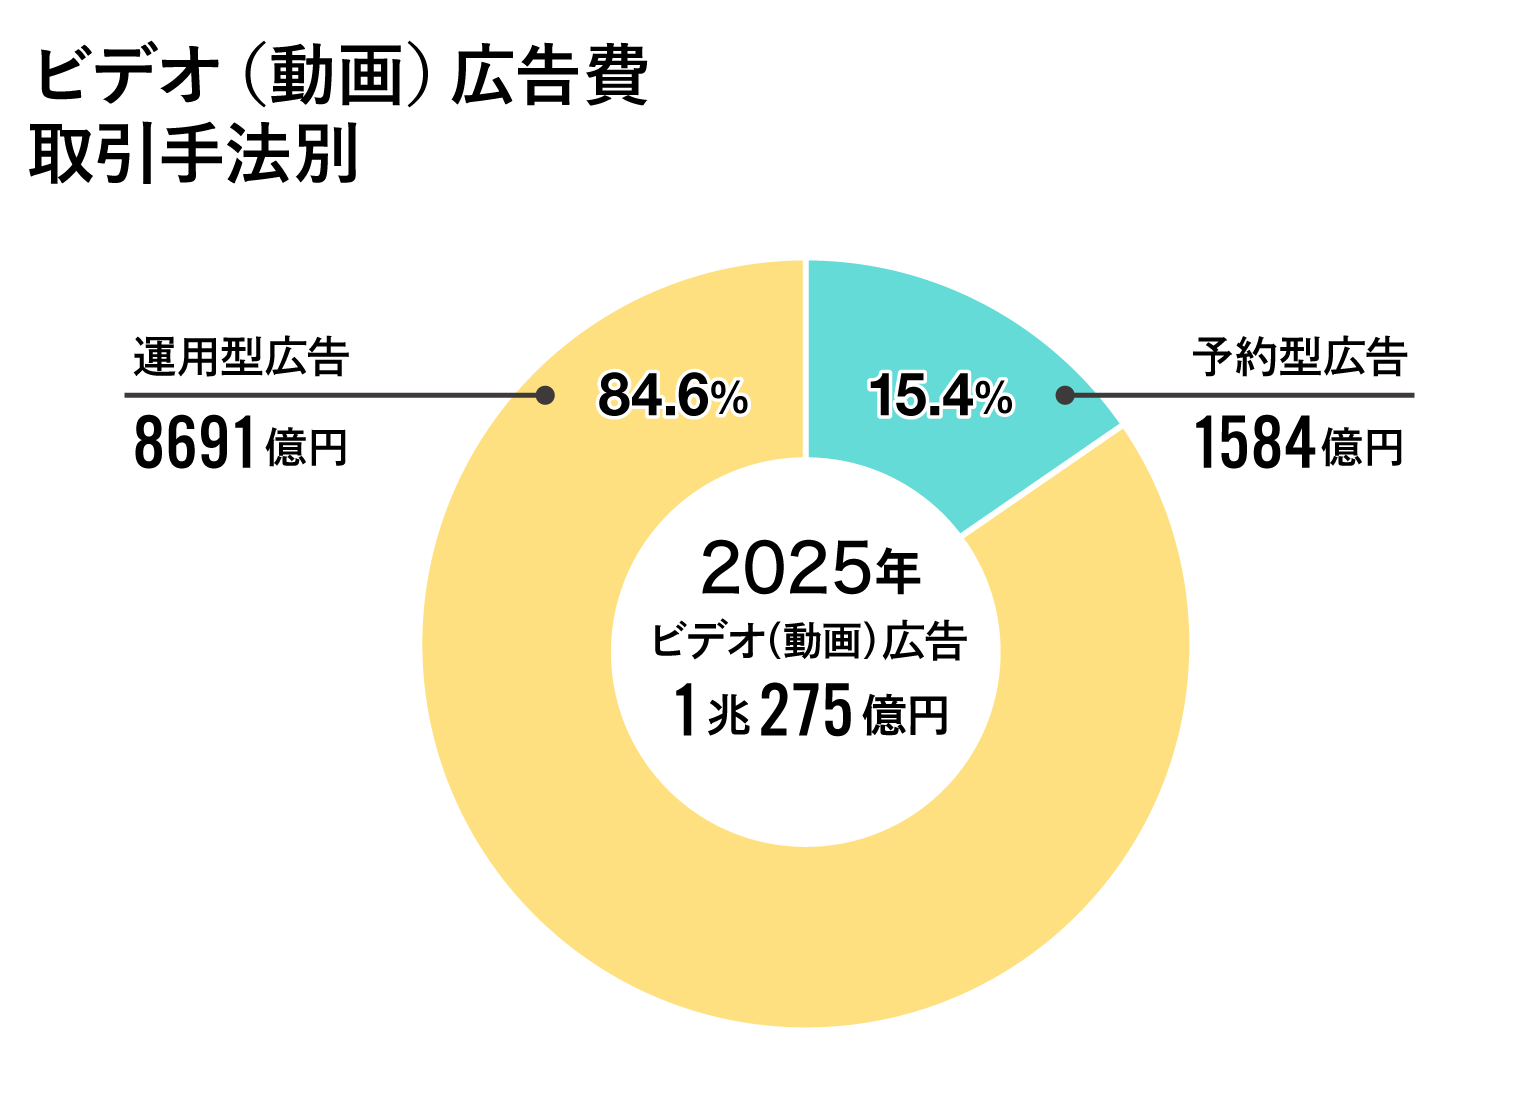
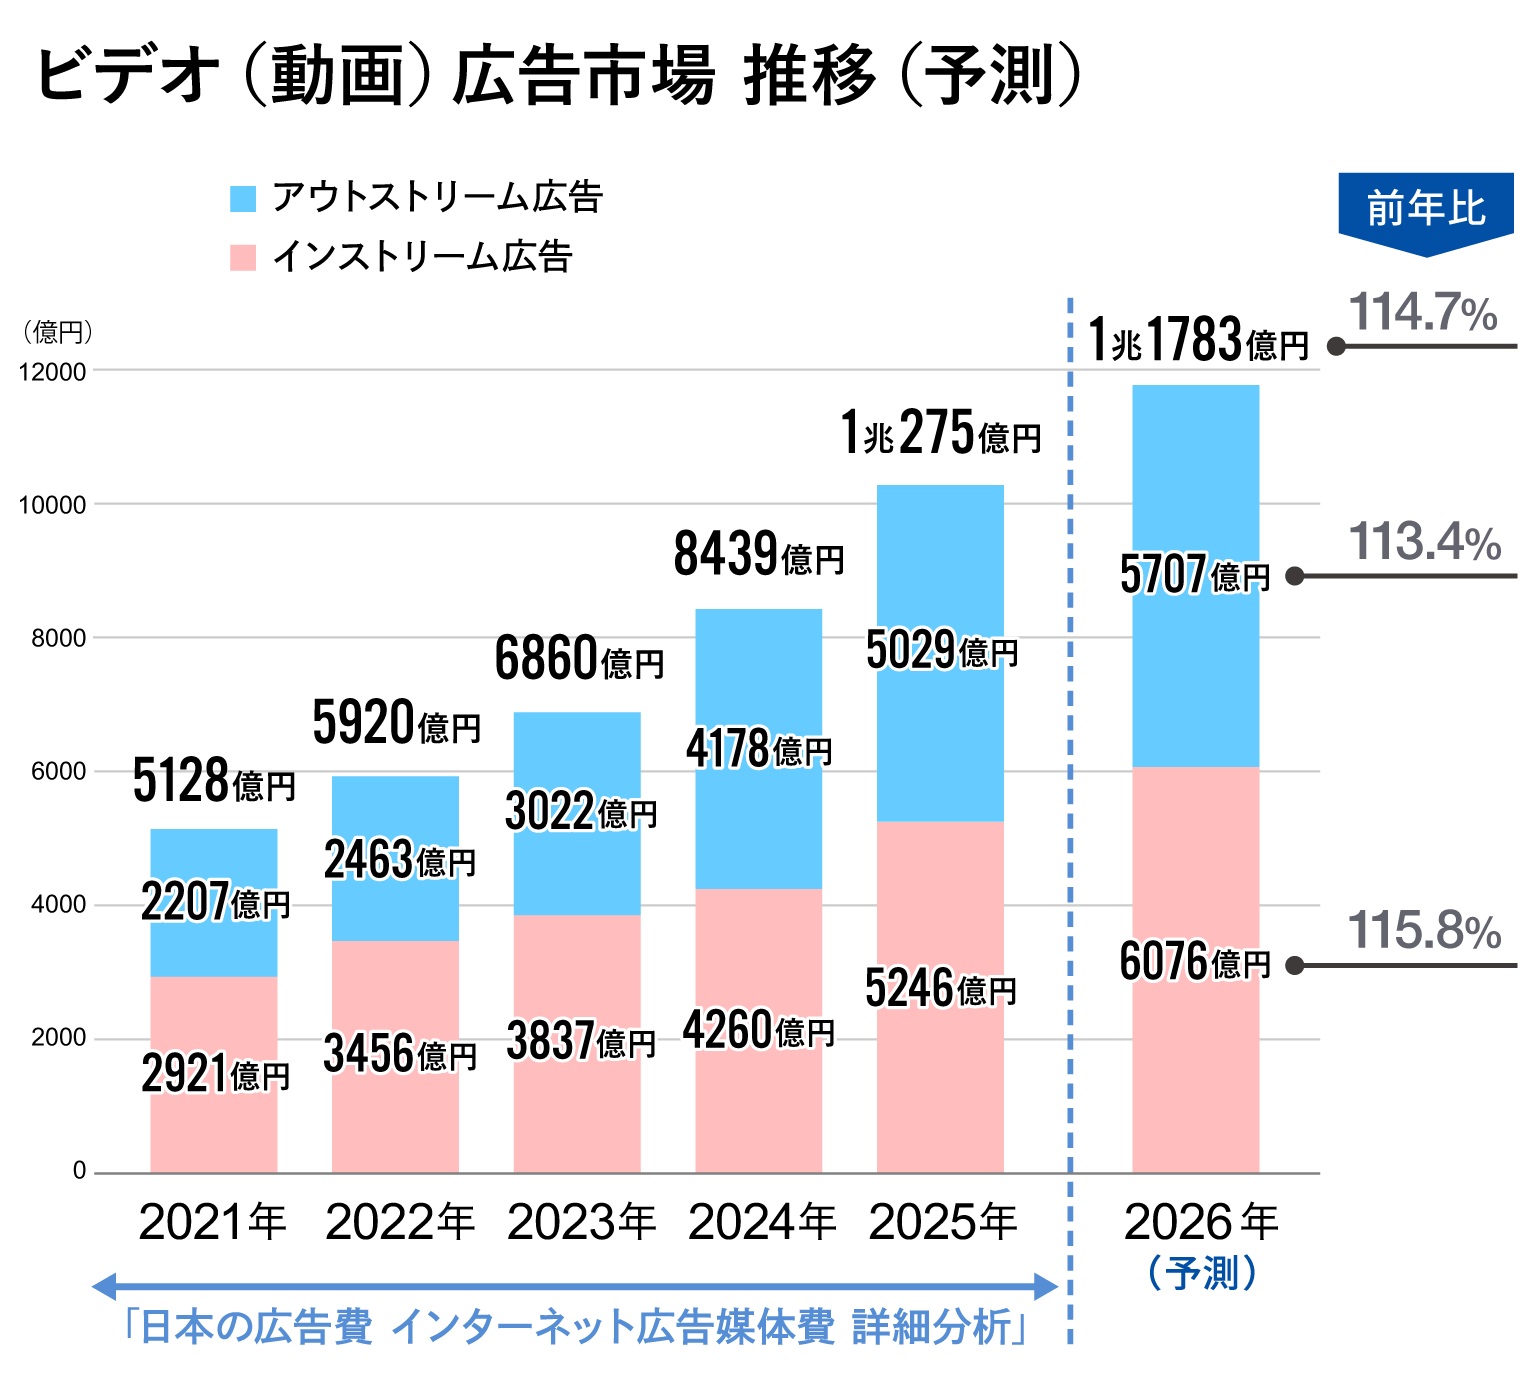
Takamatsu: Video advertising finally surpassed ¥1 trillion, achieving a 121.8% year-on-year increase—the highest growth rate among all advertising categories.
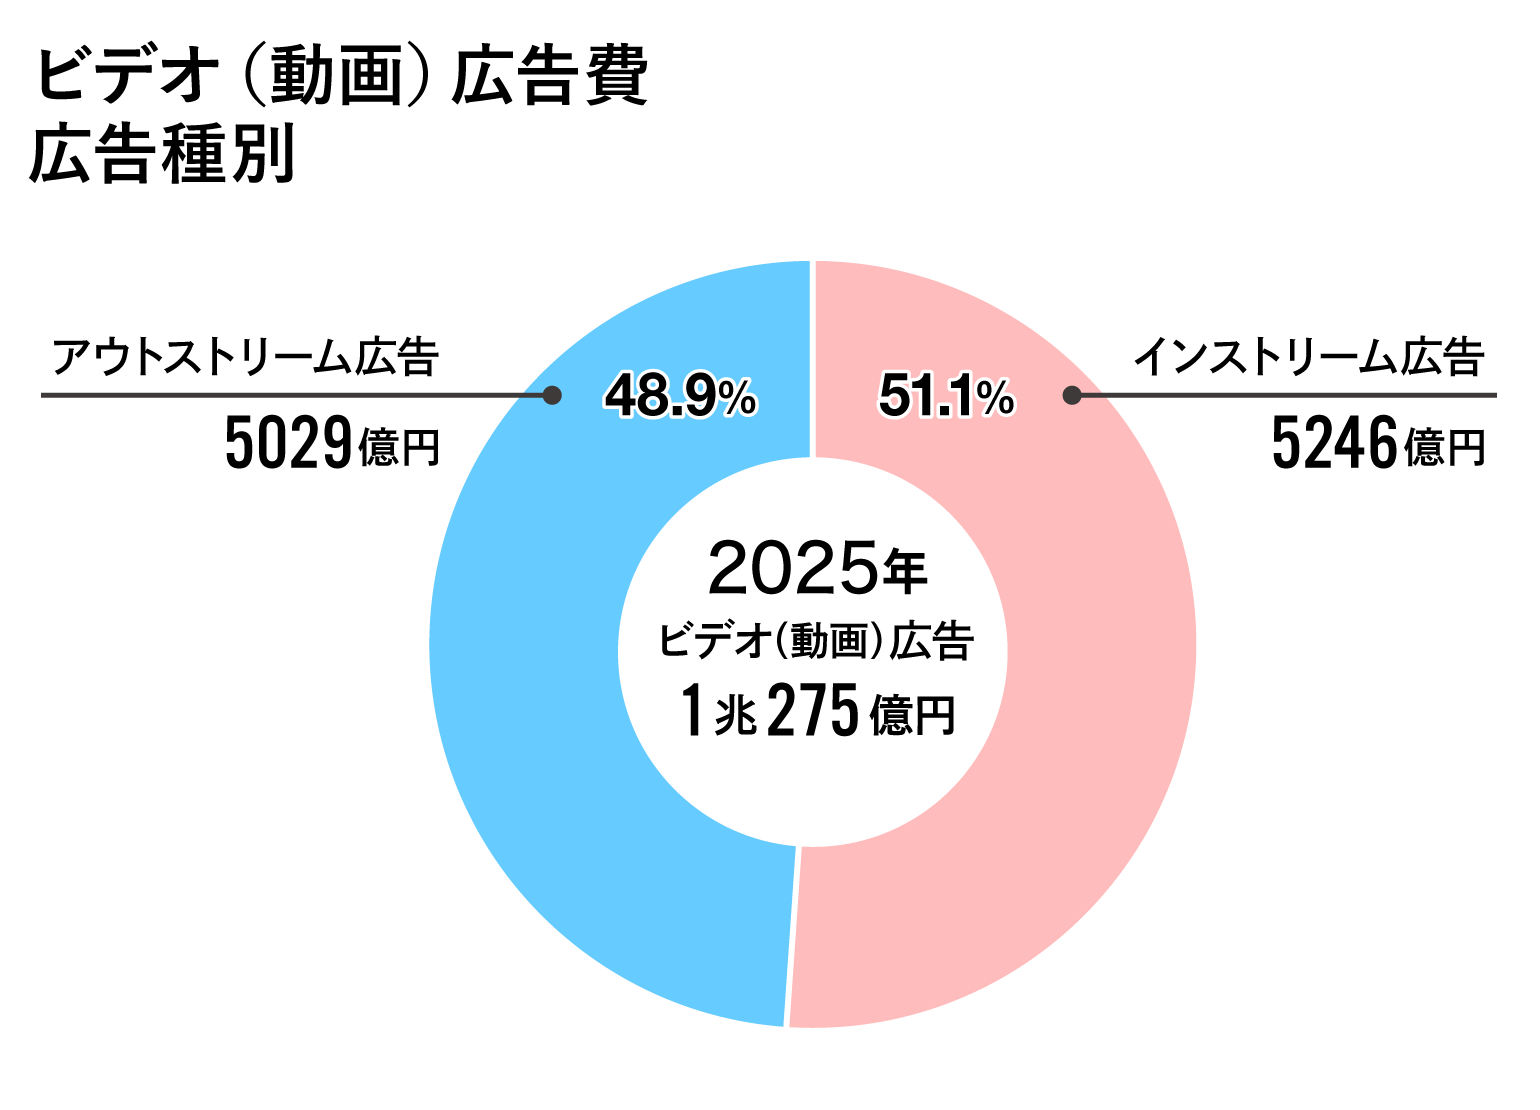
The breakdown shows in-stream ads(※1) at ¥524.6 billion (51.1% share) and out-stream ads(※2) at ¥502.9 billion (48.9% share), nearly equal. Both have grown significantly while maintaining a competitive share ratio over recent years. By transaction method, programmatic ads accounted for 84.6%.
※1 In-stream advertising = Video ads that play before, after, or during video content. Commonly seen on video-sharing sites, free on-demand streaming services, and internet TV services.
※2 Outstream advertising = Video ads displayed in video file format within display ad slots or social media feed ad slots, separate from the "video content" itself. Some video-sharing sites and social media platforms allow both in-stream and out-stream ads.
──Please explain the second point: "Social Advertising."
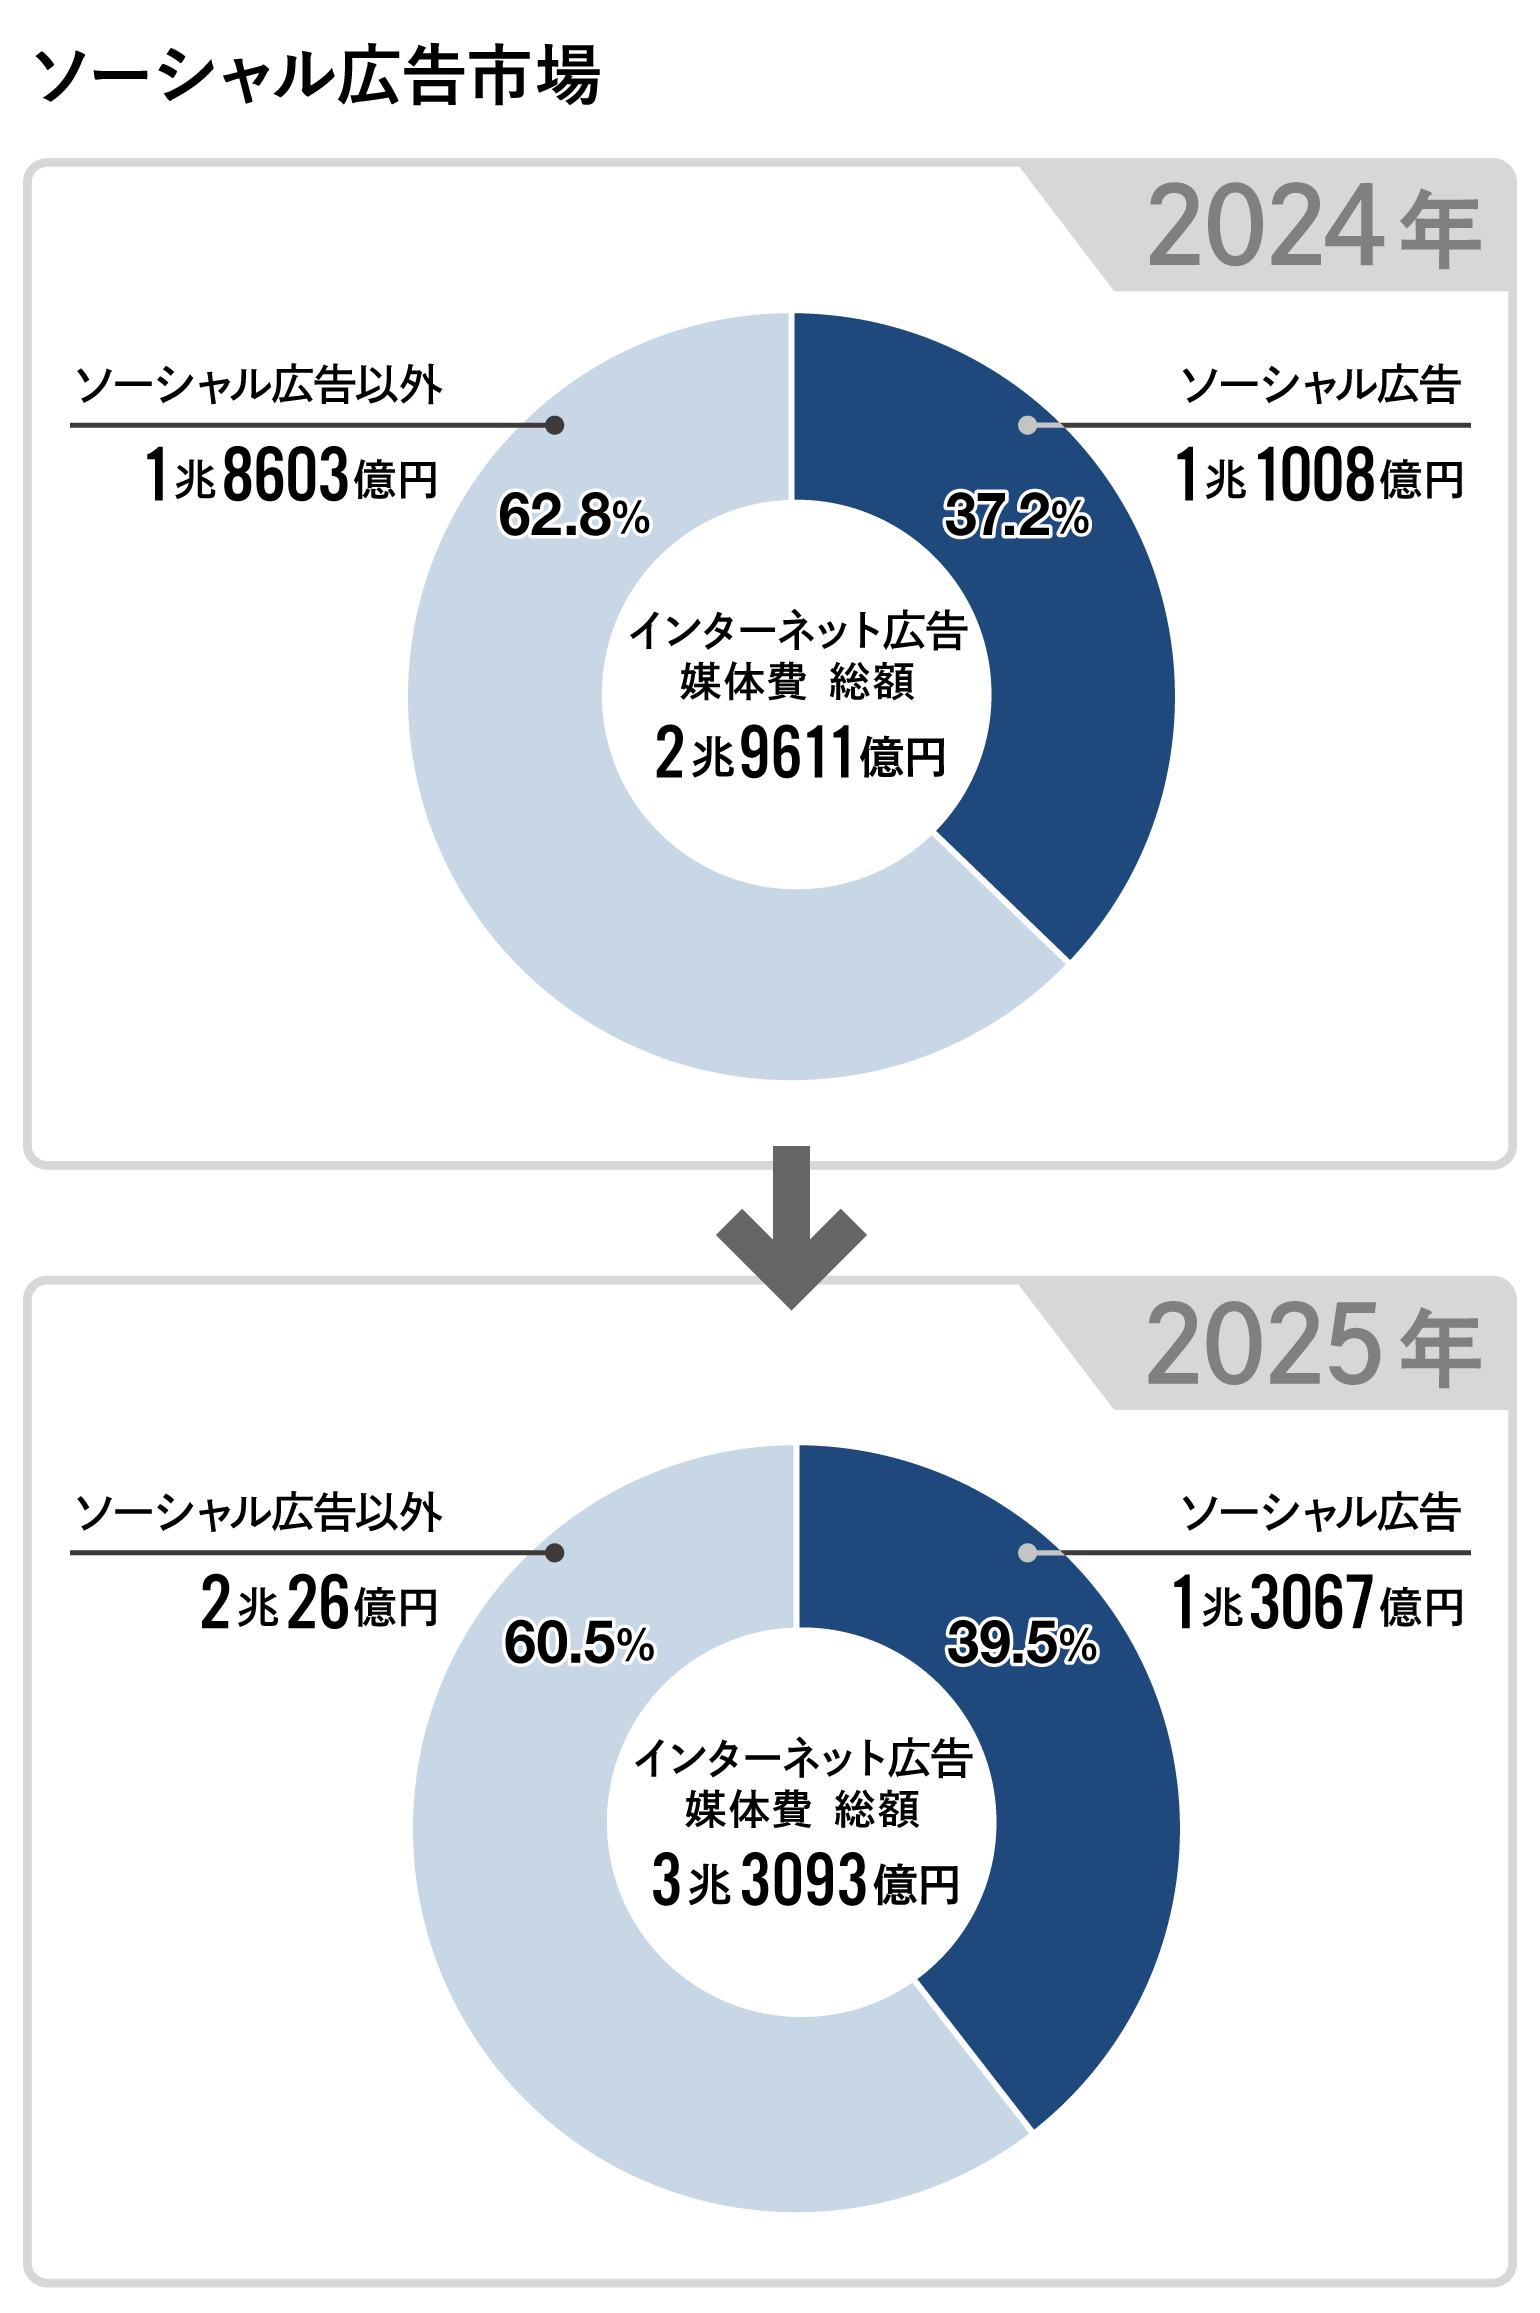
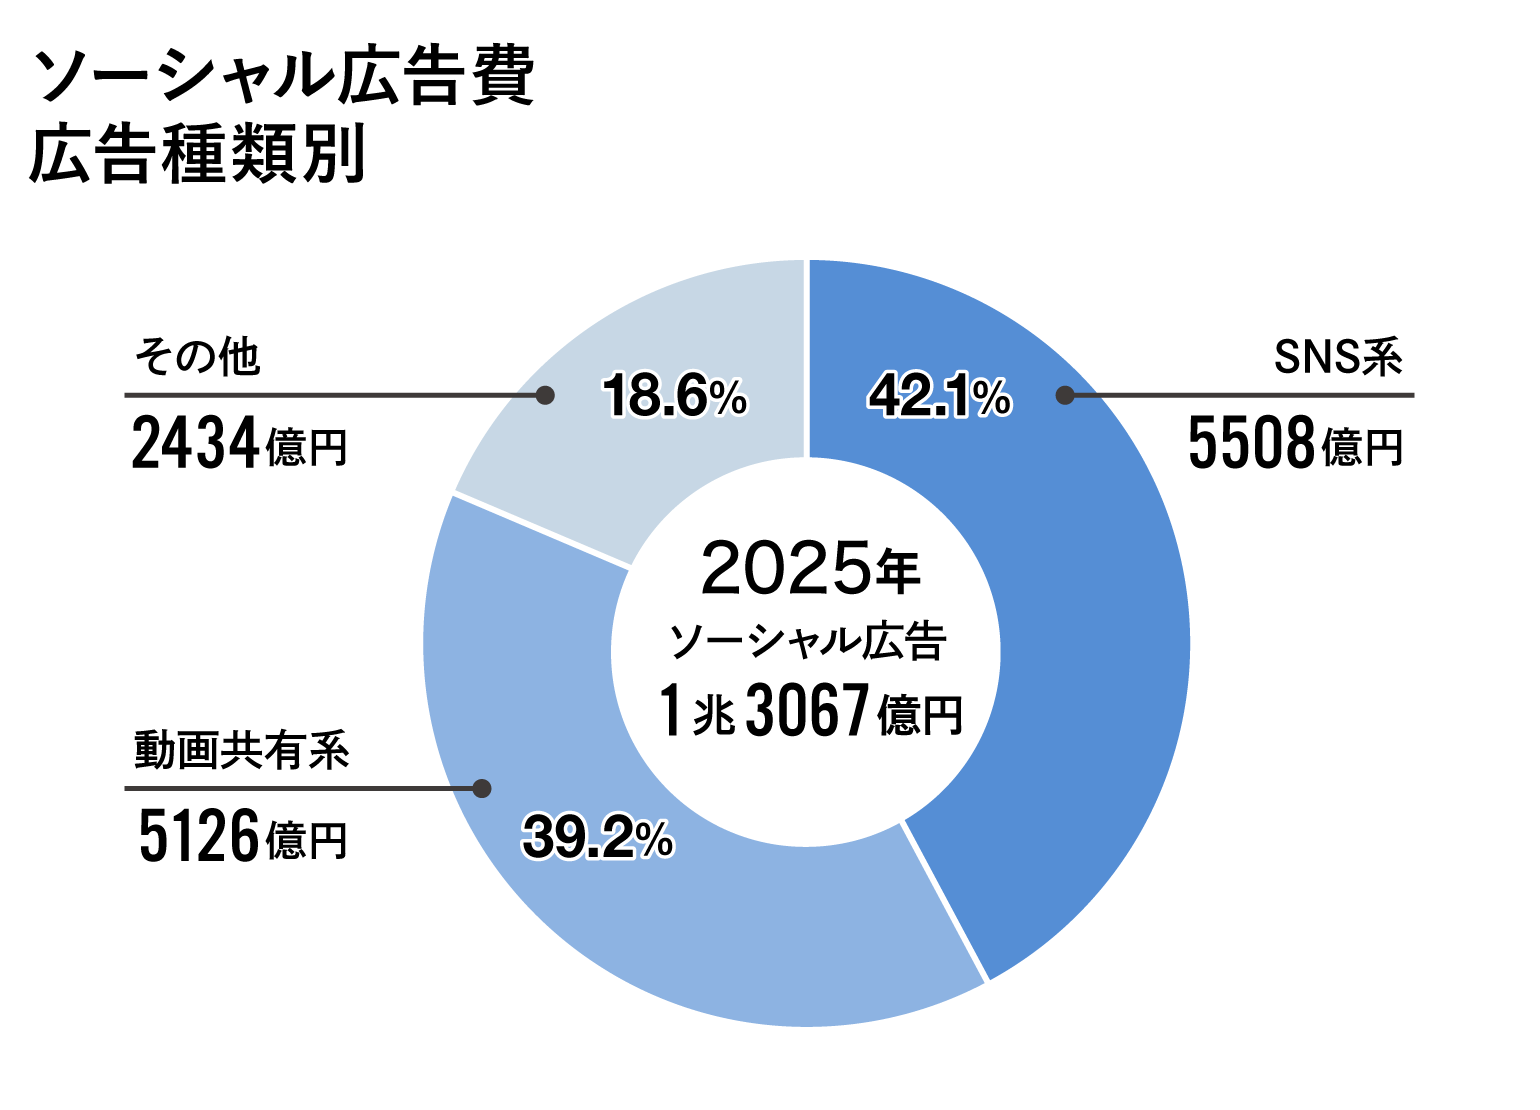
Takamatsu: Social advertising refers to "advertising deployed on social media services." It reached ¥1.3067 trillion, a 118.7% increase year-on-year. It continues to grow at a double-digit rate. Its share of total internet advertising media spending reached 39.5%, approaching 40%.
Takamatsu: The breakdown by type shows "SNS-based" at ¥550.8 billion (42.1% share), "video sharing-based" at ¥512.6 billion (39.2% share), and "other (blogs, bulletin board services, etc.)" at ¥243.4 billion (18.6% share). The share of video sharing-based ads increased further from the previous year.
Takamatsu: The social advertising market continues to expand annually. The 2025 year-on-year growth rate (118.7%) exceeds the year-on-year growth rate (111.8%) for total internet advertising media spending, indicating significant future growth potential. By category, video sharing platforms are expected to catch up to SNS platforms.
──The total internet advertising media spending continues to grow annually. Could you explain its trend and the forecast for 2026?
Takamatsu: Internet advertising media spending is projected to continue its steady expansion in 2026, reaching ¥3.584 trillion, a 108.3% increase year-on-year.
Takamatsu: Video advertising, a key focus area, is projected to maintain double-digit growth in 2026, reaching ¥1.1783 trillion, a 114.7% increase year-on-year. Out-stream and in-stream advertising are expected to grow at nearly equivalent rates.
──Regarding internet advertising expenditure, could you explain the items other than media costs?
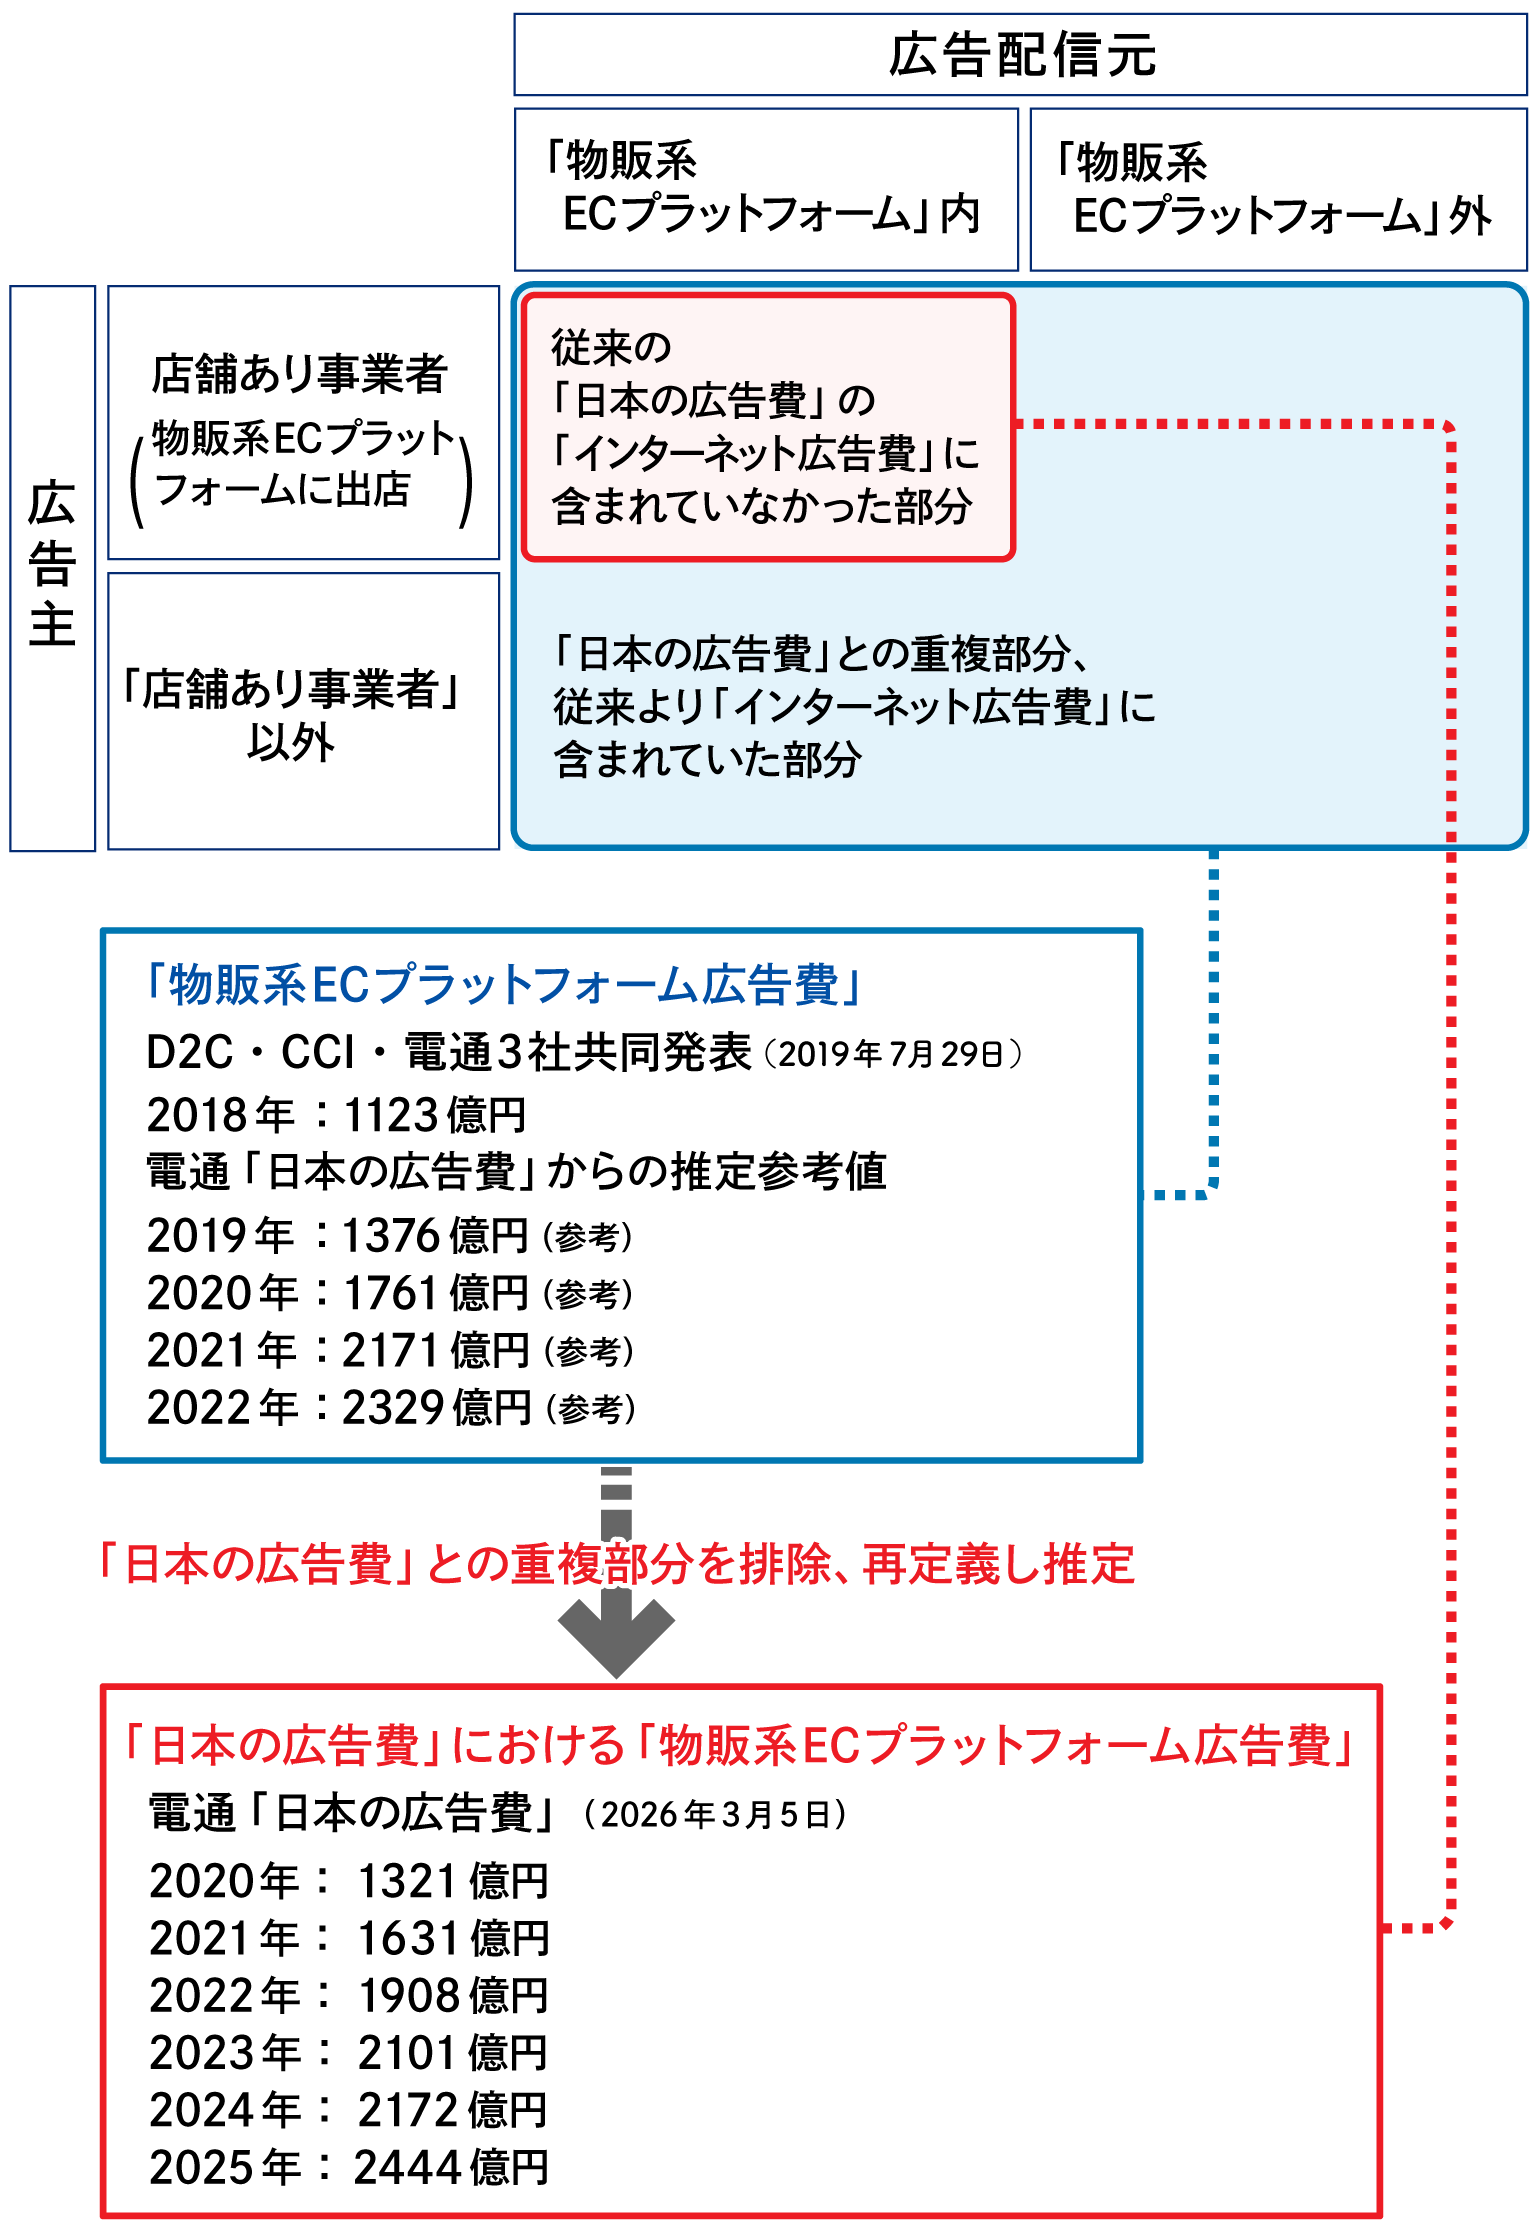
Takamatsu: The ¥4.0459 trillion in internet advertising spending includes, besides media fees, "Product-Selling E-Commerce Platform Advertising Fees" and "Internet Advertising Production Fees."
Advertising expenses on product-selling e-commerce platforms refer to ads placed by retailers operating online stores ("opening shops") on so-called "mall-type" product-selling e-commerce platforms to direct users to their product sales pages. Examples include ads that display their products as "PR items" at the top of keyword search results or ads that feature their products on the top page during specific campaigns.
Advertising expenses on e-commerce platforms reached ¥244.4 billion, a 112.5% increase year-on-year. This double-digit growth was driven by factors including the further proliferation of online shopping.
Factors contributing to the increase in advertising expenditure include approaches targeting consumers with heightened cost-saving awareness amid rising prices (such as points and coupons), and a "rush demand" for e-commerce platforms in anticipation of the October 2025 reforms to the hometown tax donation system.
──What about internet advertising production costs?
Morinaga: Internet advertising production costs reached ¥492.2 billion, a 104.0% increase year-on-year, continuing the expansion seen the previous year. Notably, the continued growth in video-related production costs was driven by the expanding use of video across a broad spectrum, from branding to purchasing and CRM (Customer Relationship Management).
② "Mass Media Advertising Expenditures" Remained Nearly Flat
──Next, Mr. Morinaga, please tell us about advertising expenditures across the four major media outlets. First, could you provide an overview?
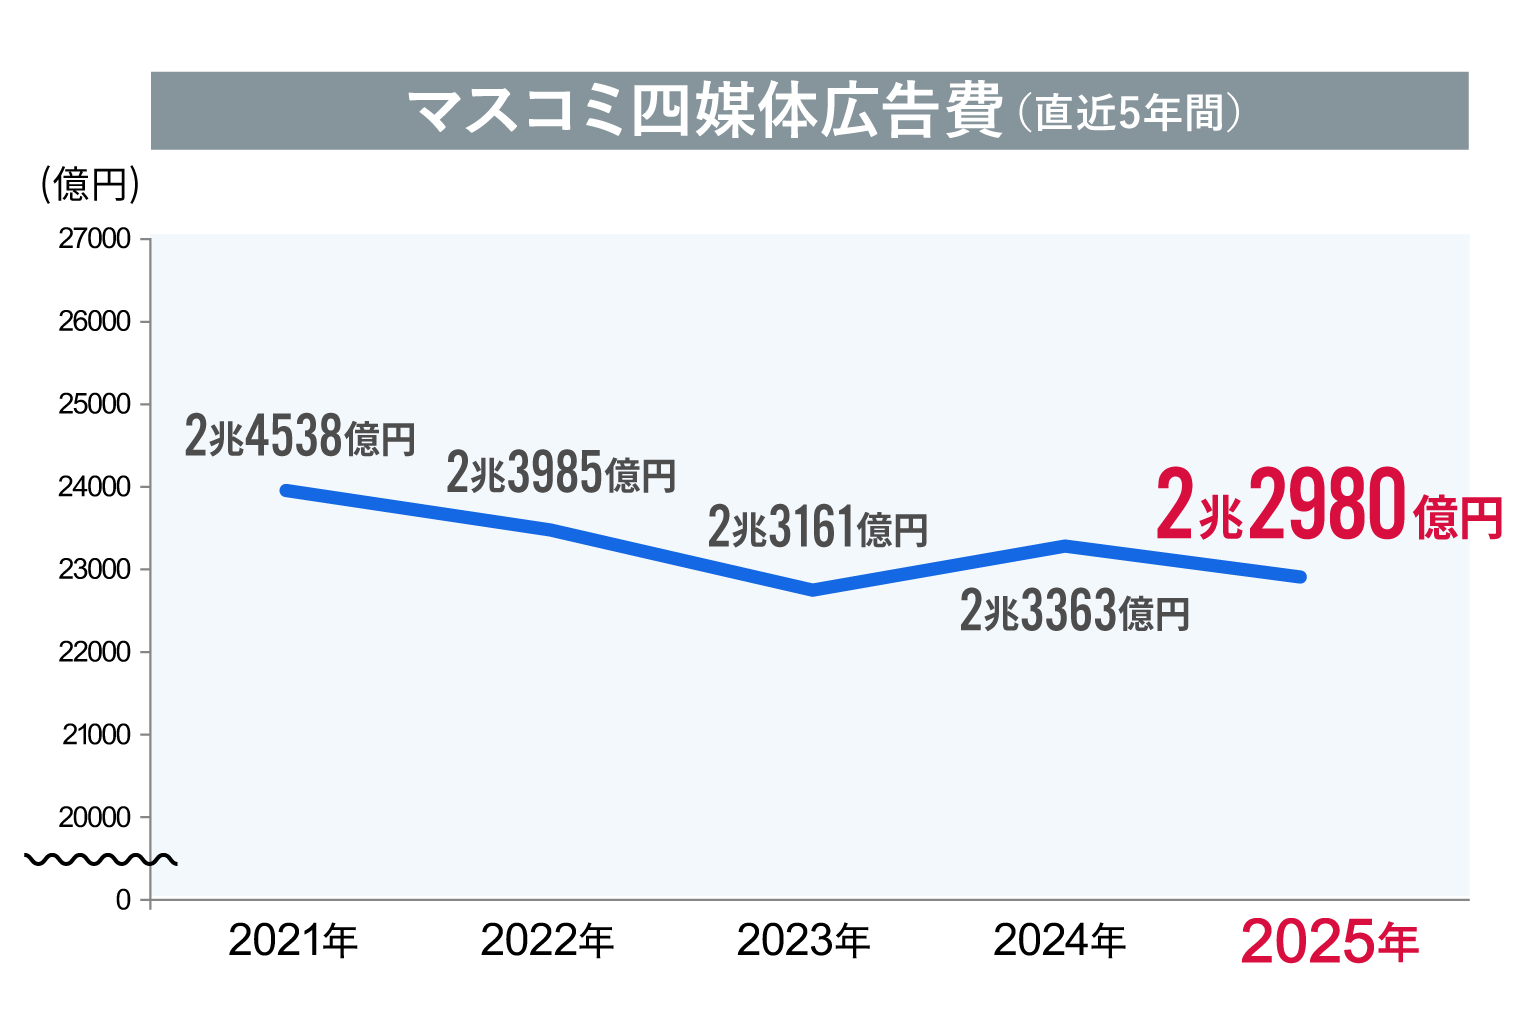
Morinaga: Advertising expenditure for the four major media outlets—newspapers, magazines, radio, and television—totaled ¥2.298 trillion, representing 98.4% of the previous year's level.
Year-on-year comparisons by medium were: newspapers 91.8%, magazines 96.3%, radio 99.2%, and television media (combining terrestrial and satellite) 99.7%. Newspapers and magazines saw declines, while radio and television media remained nearly flat compared to the previous year.
──Could you highlight key points for each medium?
● Newspaper Advertising Expenditures
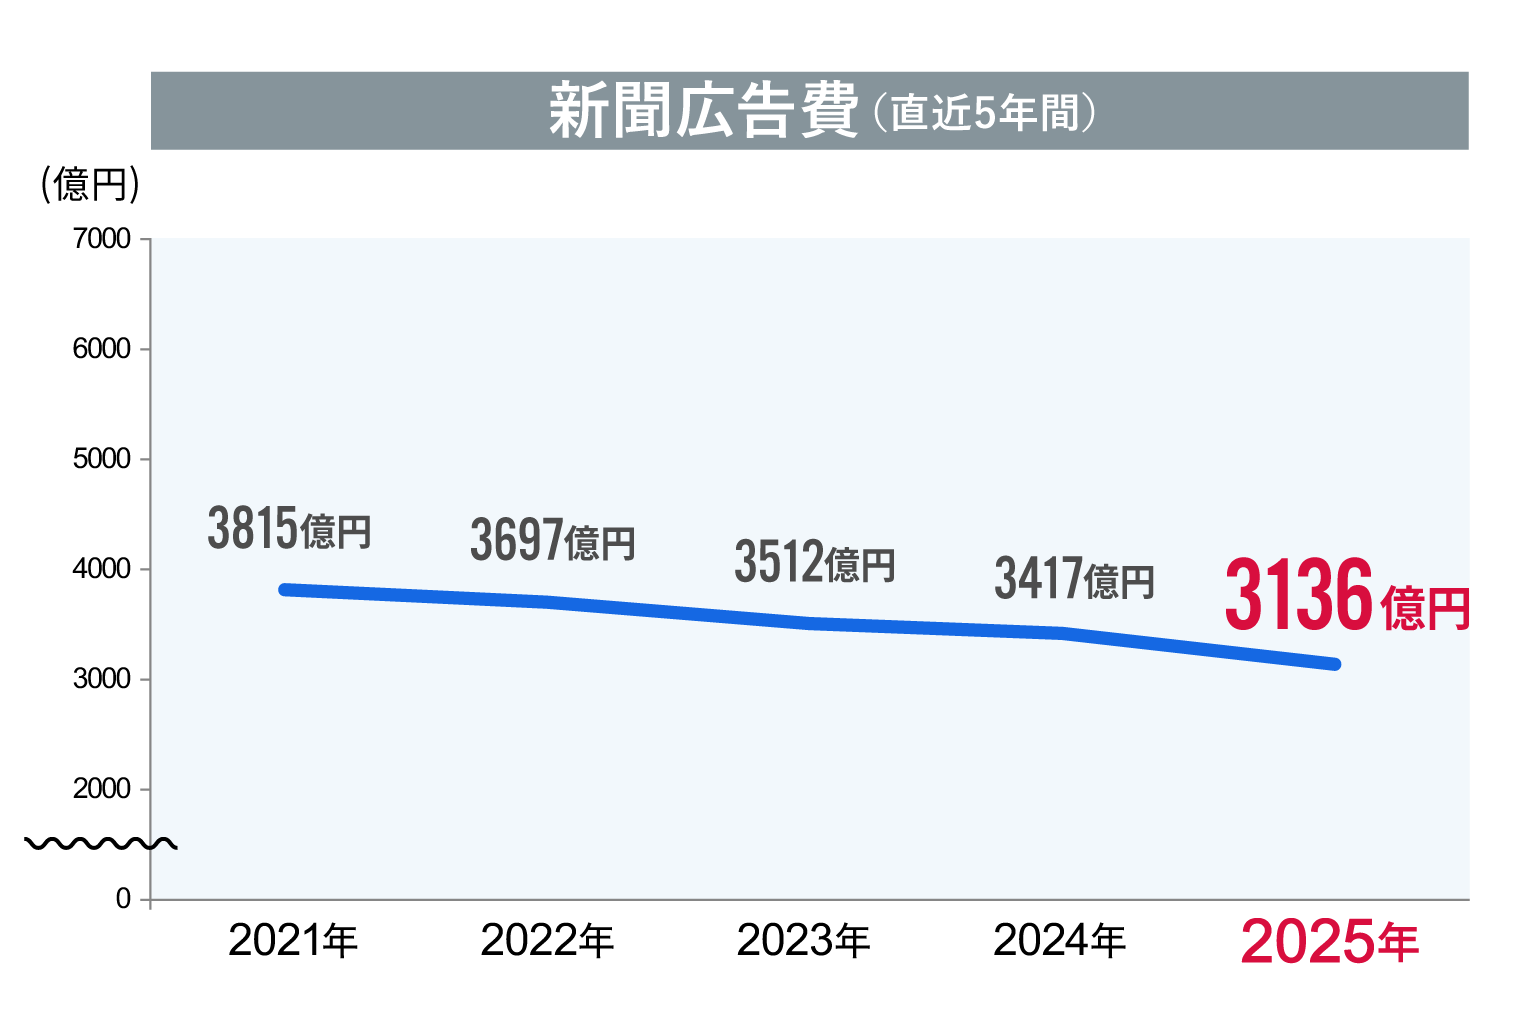
Morinaga: Newspaper advertising expenditure was ¥313.6 billion, 91.8% of the previous year. While 2025 featured events like the House of Councillors election, the Osaka/Kansai Expo, and the Tokyo 2025 World Athletics Championships, these did not sufficiently boost advertising spending, resulting in an overall annual decrease.
By industry, advertising in newspapers increased for "Precision Instruments & Office Supplies," "Home Appliances & AV Equipment," and "Automobiles & Related Products." However, "Food" decreased to 85.3% of the previous year, continuing its decline. "Distribution & Retail," which had been showing signs of recovery, also decreased to 88.7% of the previous year.
●Magazine Advertising Expenditures
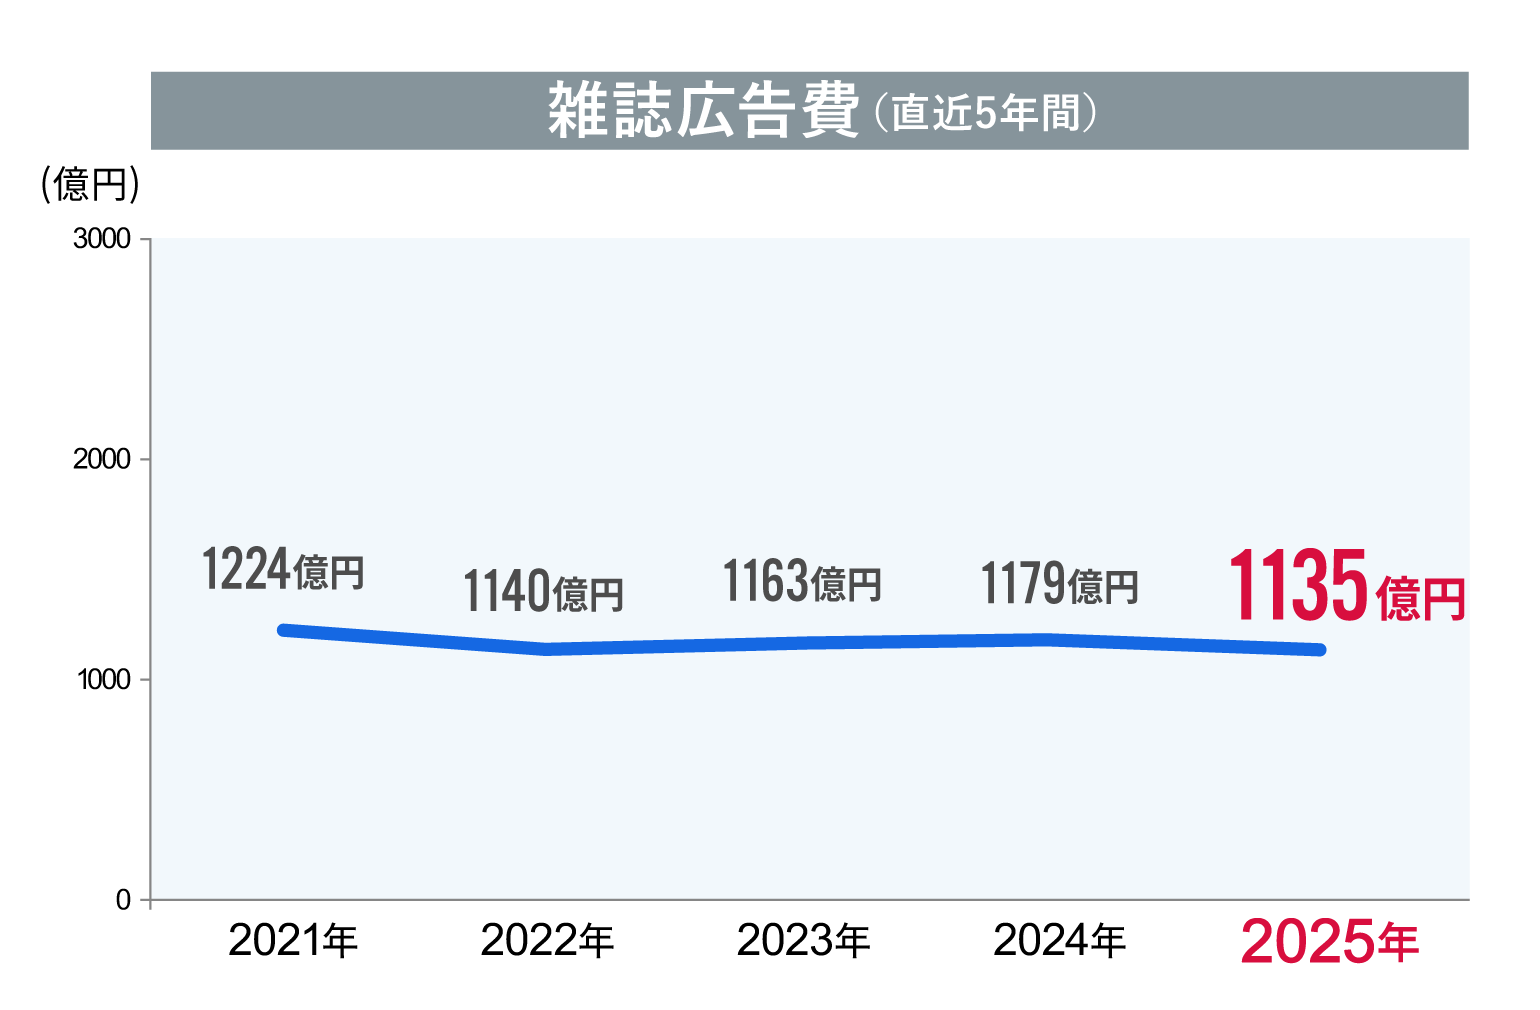
Morinaga: Magazine advertising expenditure decreased to ¥113.5 billion, 96.3% of the previous year. This reflects the impact of structural changes, with print media facing challenges and the shift to digital accelerating. However, magazines themselves are seeing growth in sales for some publishers through licensing businesses for IP content like manga and collaborations with other media, primarily digital.
By industry, "Finance/Insurance" and "Government Agencies/Organizations" exceeded the previous year's figures. However, "Fashion/Accessories," which holds a large share of magazine advertising spending, decreased to 97.8% of the previous year, and "Cosmetics/Toiletries" decreased to 92.5%.
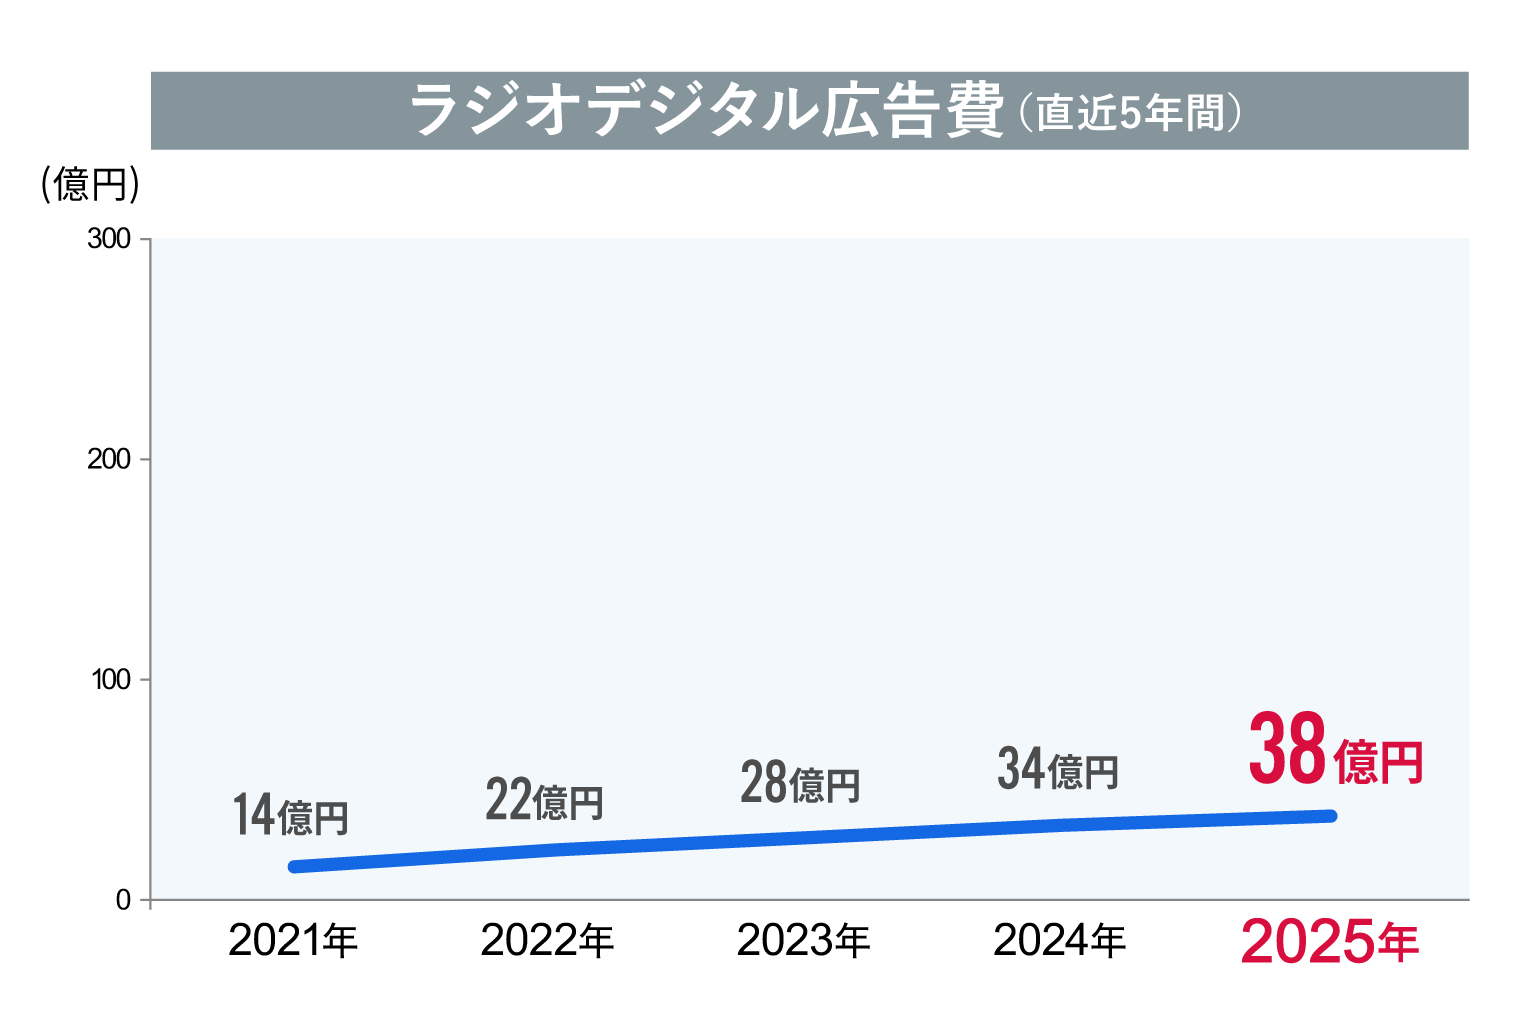
●Radio Advertising Expenditures
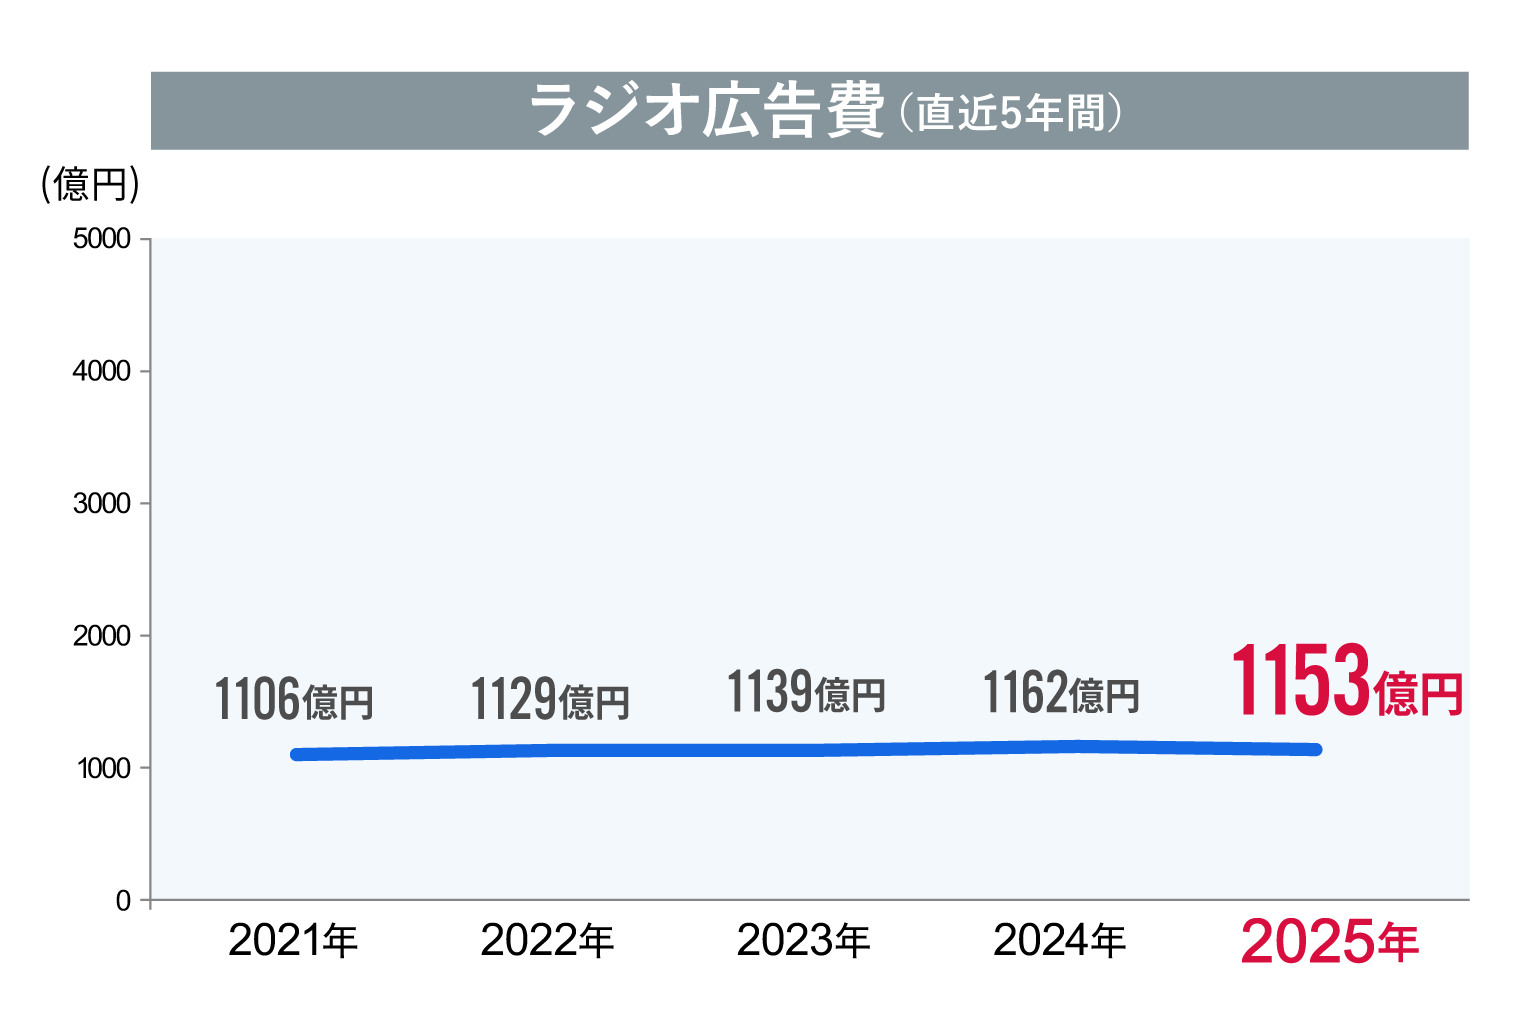
Morinaga: Radio advertising expenditure was ¥115.3 billion, 99.2% of the previous year, remaining at a similar level. While interest in audio media continues to grow annually and digital audio advertising (included in internet advertising expenditure) increased, the advertising market for terrestrial radio broadcasting fell below the previous year's level for the full year.
By industry, "Information & Communications" saw a significant increase of 125.7% year-on-year, and "Distribution & Retail" also grew substantially by 120.0%.
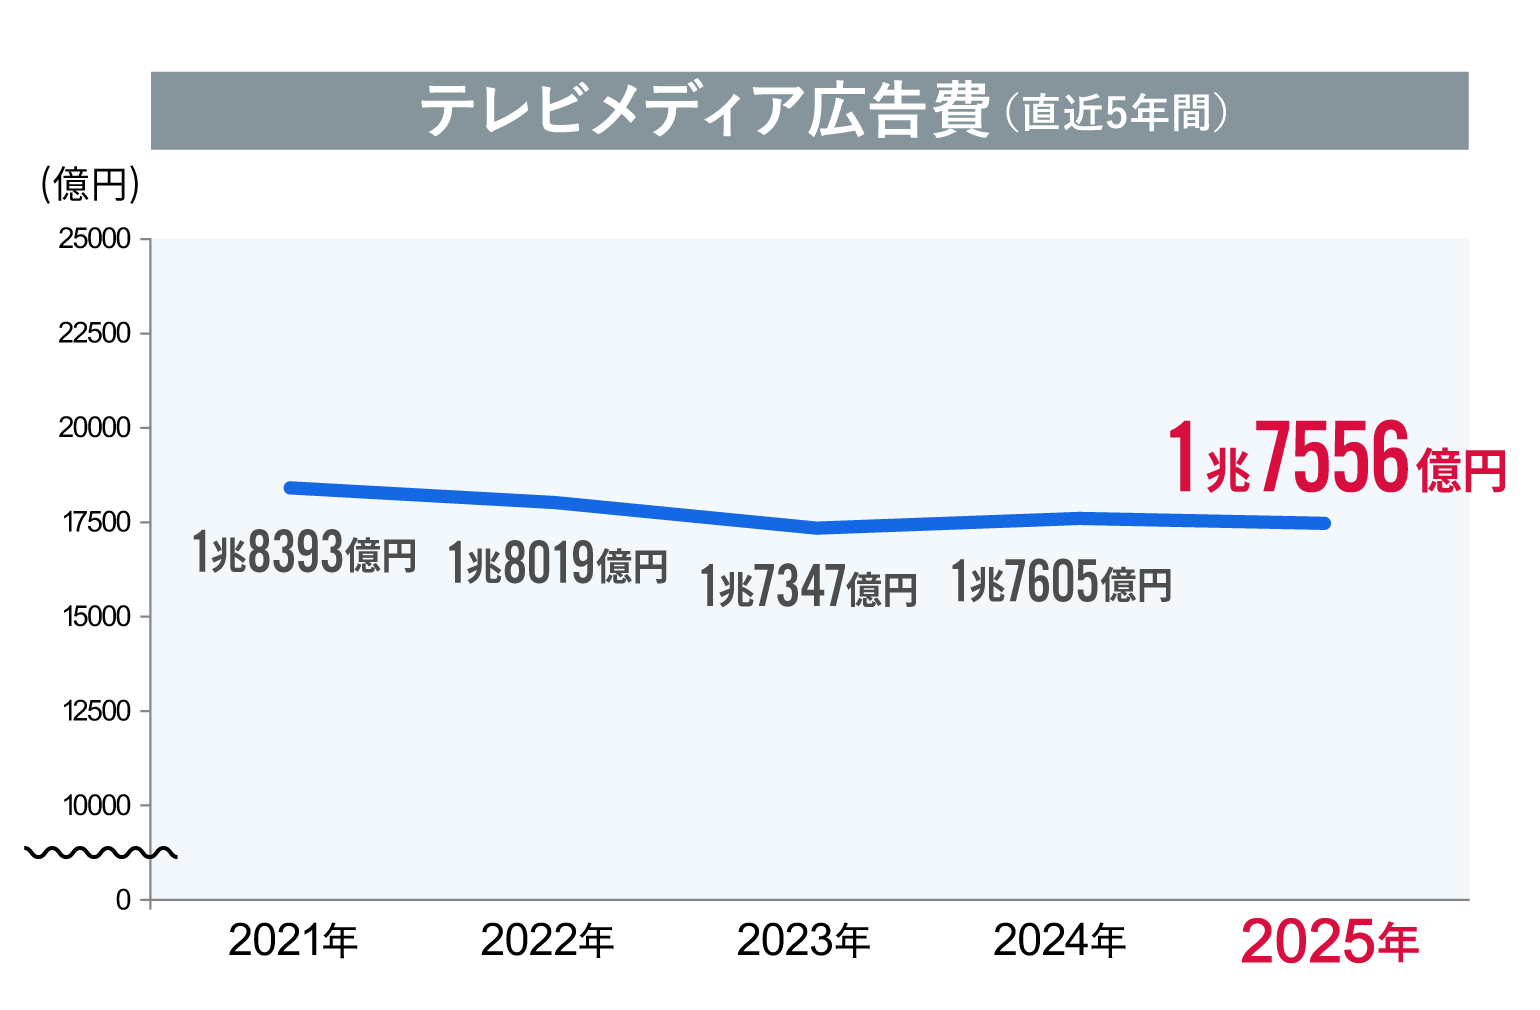
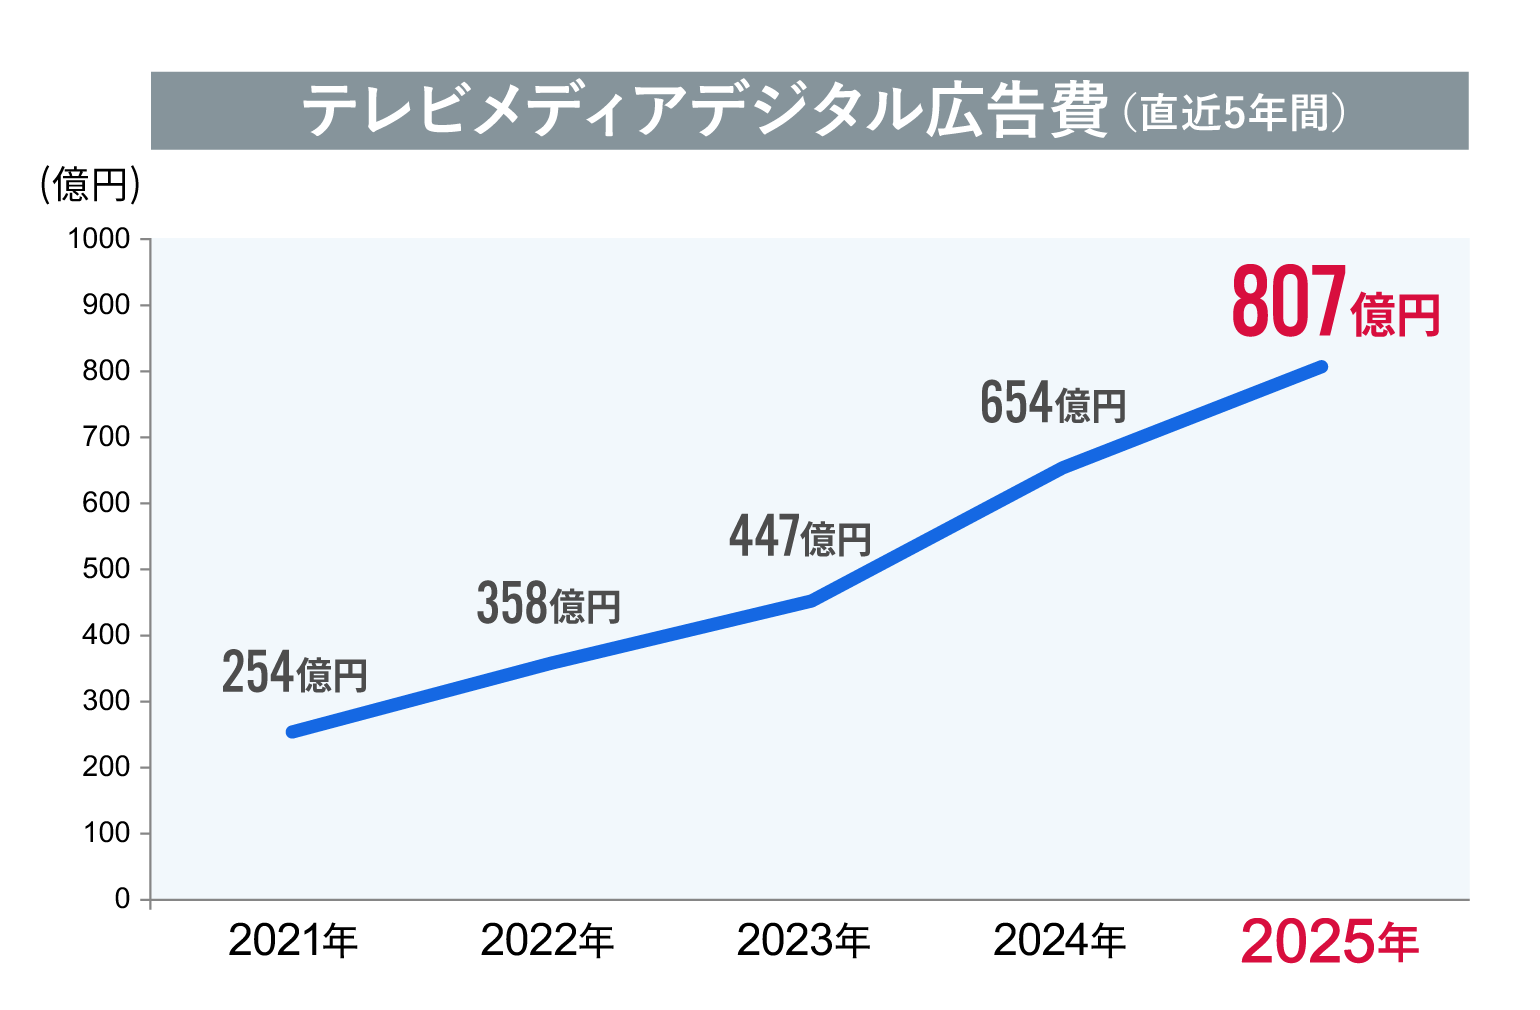
● Television Media Advertising Expenditures
Morinaga: Television media advertising expenditure (combined terrestrial TV + satellite media-related) was ¥1.7556 trillion, 99.7% of the previous year, remaining at the same level as the previous year. The breakdown was "Terrestrial TV" at ¥1.6333 trillion, 99.9% of the previous year, and "Satellite Media-Related" at ¥122.3 billion, 97.5% of the previous year.
Regarding terrestrial TV, "program (time) advertising expenditure" performed well due to major events like the Osaka-Kansai Expo and the Tokyo 2025 World Athletics Championships. However, this was insufficient to offset the decline following events like the Paris 2024 Olympics and Paralympics, resulting in an overall decrease for the full year.
Conversely, "spot advertising spending" increased. Driven by factors like increased consumer activity, advertising in sectors such as "Distribution/Retail," "Transportation/Leisure," and "Information/Communications" performed well, exceeding the previous year's levels.
"Satellite Media-Related" remained flat to slightly declining, primarily due to the impact on home shopping programs on BS and CS channels, partly influenced by consumers holding back on purchases amid rising prices.
What about "digital advertising originating from the four mass media"?
──What about "Digital Advertising Spending Originating from the Four Major Media"?
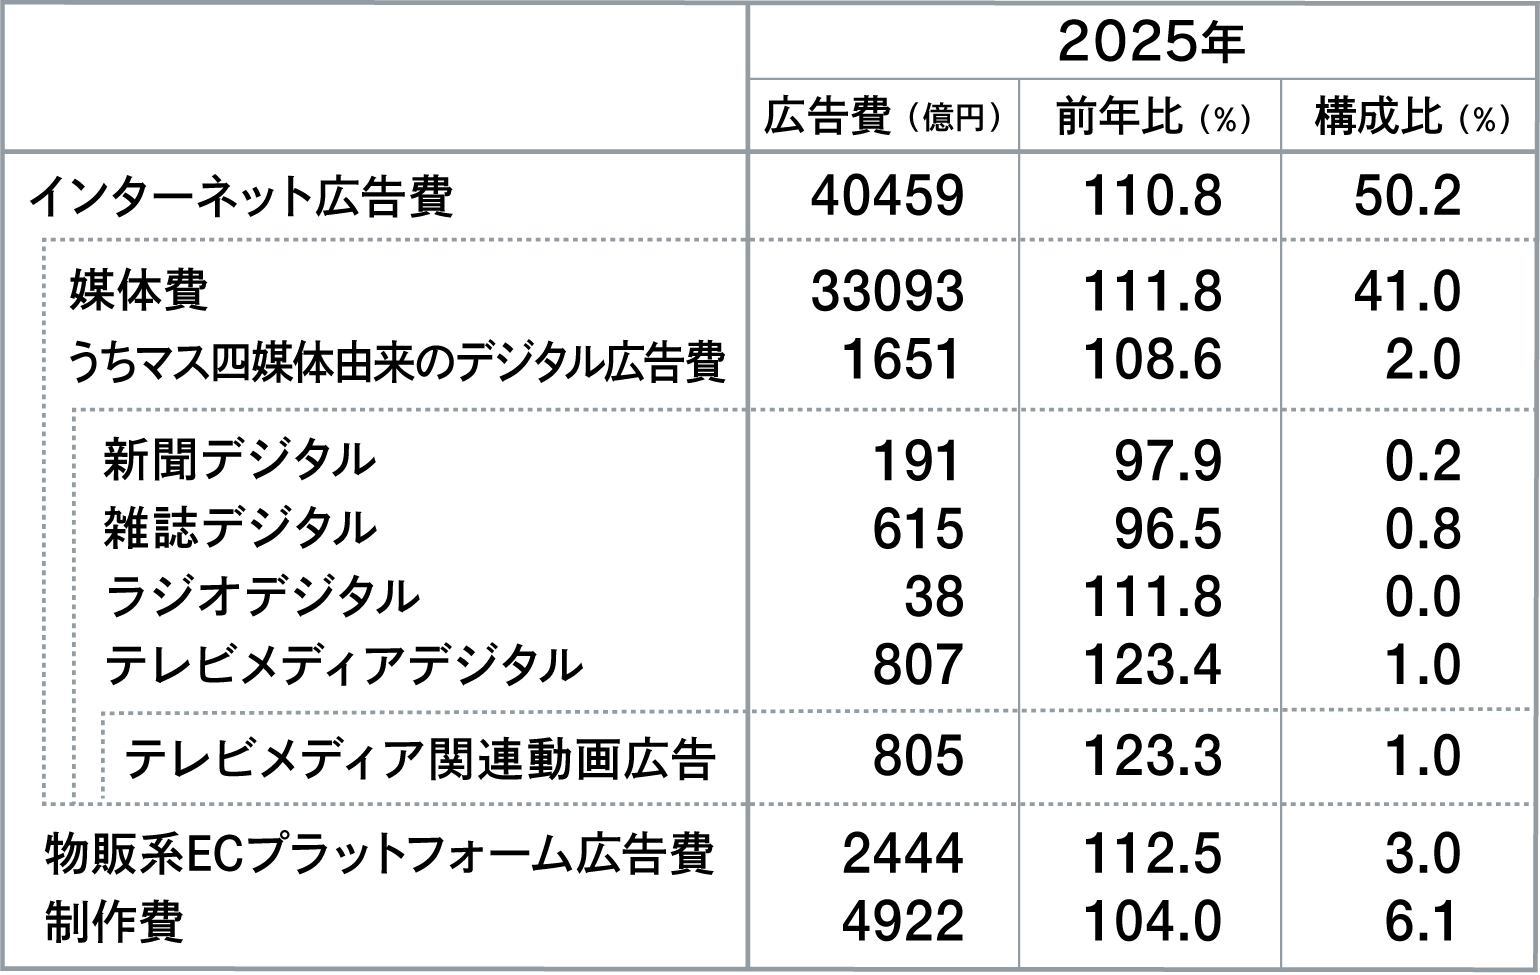
Morinaga: "Digital advertising spending originating from the four major media outlets" expanded to ¥165.1 billion, a 108.6% increase year-on-year.
"Digital advertising spending originating from the four major media outlets" refers, as the name suggests, to advertising slots on internet services primarily operated by television stations, radio stations, newspapers, and publishers.
For example, program streaming services by Media Services / Radio,TV Division, digital editions of newspapers provided by newspaper companies, and magazine websites by publishers fall into this category.
These digital advertisements originating from the four major media outlets are not counted as advertising expenses for the four major media outlets themselves, but rather as internet advertising media expenses.
──Please explain each one.
● Newspaper Digital Advertising Expenditures
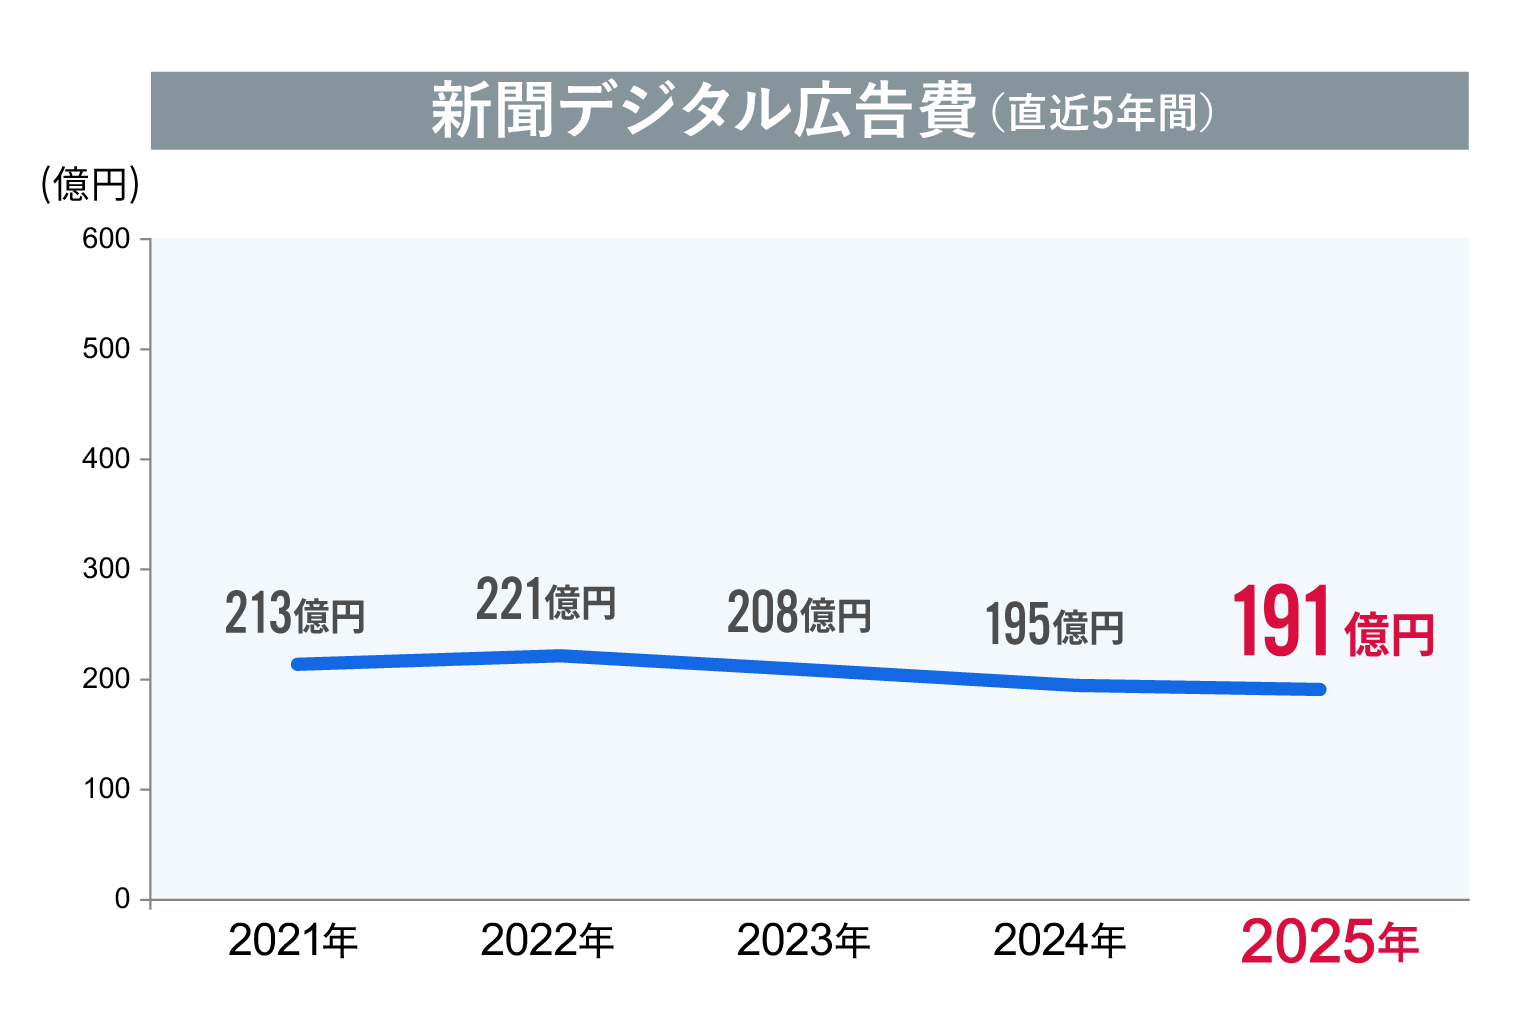
Morinaga: "Newspaper digital advertising expenditure" primarily refers to advertising slots on digital newspaper editions. While placements from "government agencies," "financial institutions," "e-commerce sites," and "B2B companies" were prominent, budgets shifted toward video advertising outside of digital newspapers, leading to a downward trend. It continued to fall below the previous year, reaching 97.9% of the previous year's level.
By type, reserved advertising remained steady, centered on tie-up ads, but programmatic advertising was significantly impacted by declining page views (PV) and falling CPM rates.
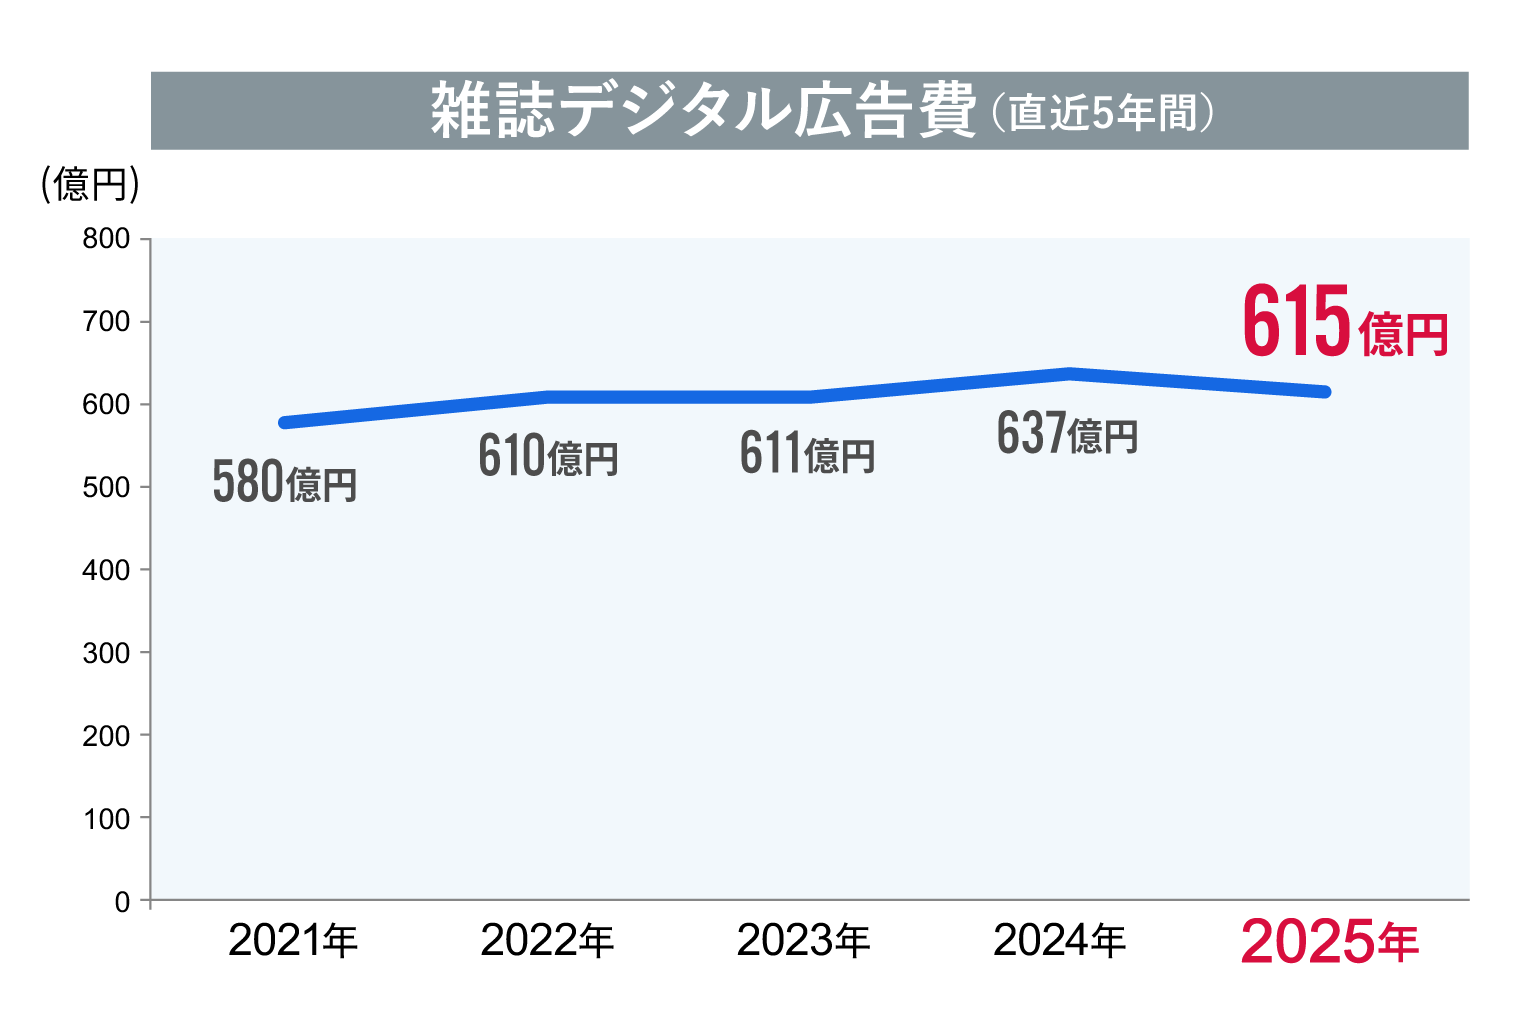
●Magazine Digital Advertising Expenditures
Morinaga: "Magazine digital advertising expenditure" decreased to 96.5% year-on-year. Areas leveraging magazine publishers' content creation capabilities, such as tie-ups and owned media support, remained resilient. However, the decline was driven by falling CPMs for programmatic ads, platform algorithm changes, shifts in user information-gathering behavior, and sluggish PV growth due to AI-driven search behavior.
●Radio Digital Advertising Expenditures
Morinaga: "Radio Digital Advertising Expenditures" grew by 111.8% year-on-year to ¥3.8 billion, achieving double-digit growth. Following the previous year, digital expansion in audio media, including podcasts, continued to attract attention. Furthermore, the number of new placements in digital audio advertising, which allows for targeted advertising, increased.
●TV Media Digital Advertising Expenditures
Morinaga: "TV Media Digital Advertising Expenditure" grew significantly to ¥80.7 billion, a 123.4% increase year-on-year. "TV Media-Related Video Advertising" accounted for the majority of this, at ¥80.5 billion.
"TV Media-Related Video Advertising" refers to estimated advertising spending primarily on internet video streaming by TV media broadcasters, such as ad-supported TV program streaming services.
Viewership for these ad-supported TV program streaming services grew across a wide range of genres including dramas, anime, reality shows, and variety programs, setting new records for both playback counts and user numbers. Furthermore, live sports viewing has become established, with viewership for various tournaments also increasing. This is considered to have contributed to the growth in advertising expenditure.
③ "Promotional Media Advertising Expenditures" Grow for Third Consecutive Year
──Next, please tell us about "Promotional Media Advertising Expenditures."
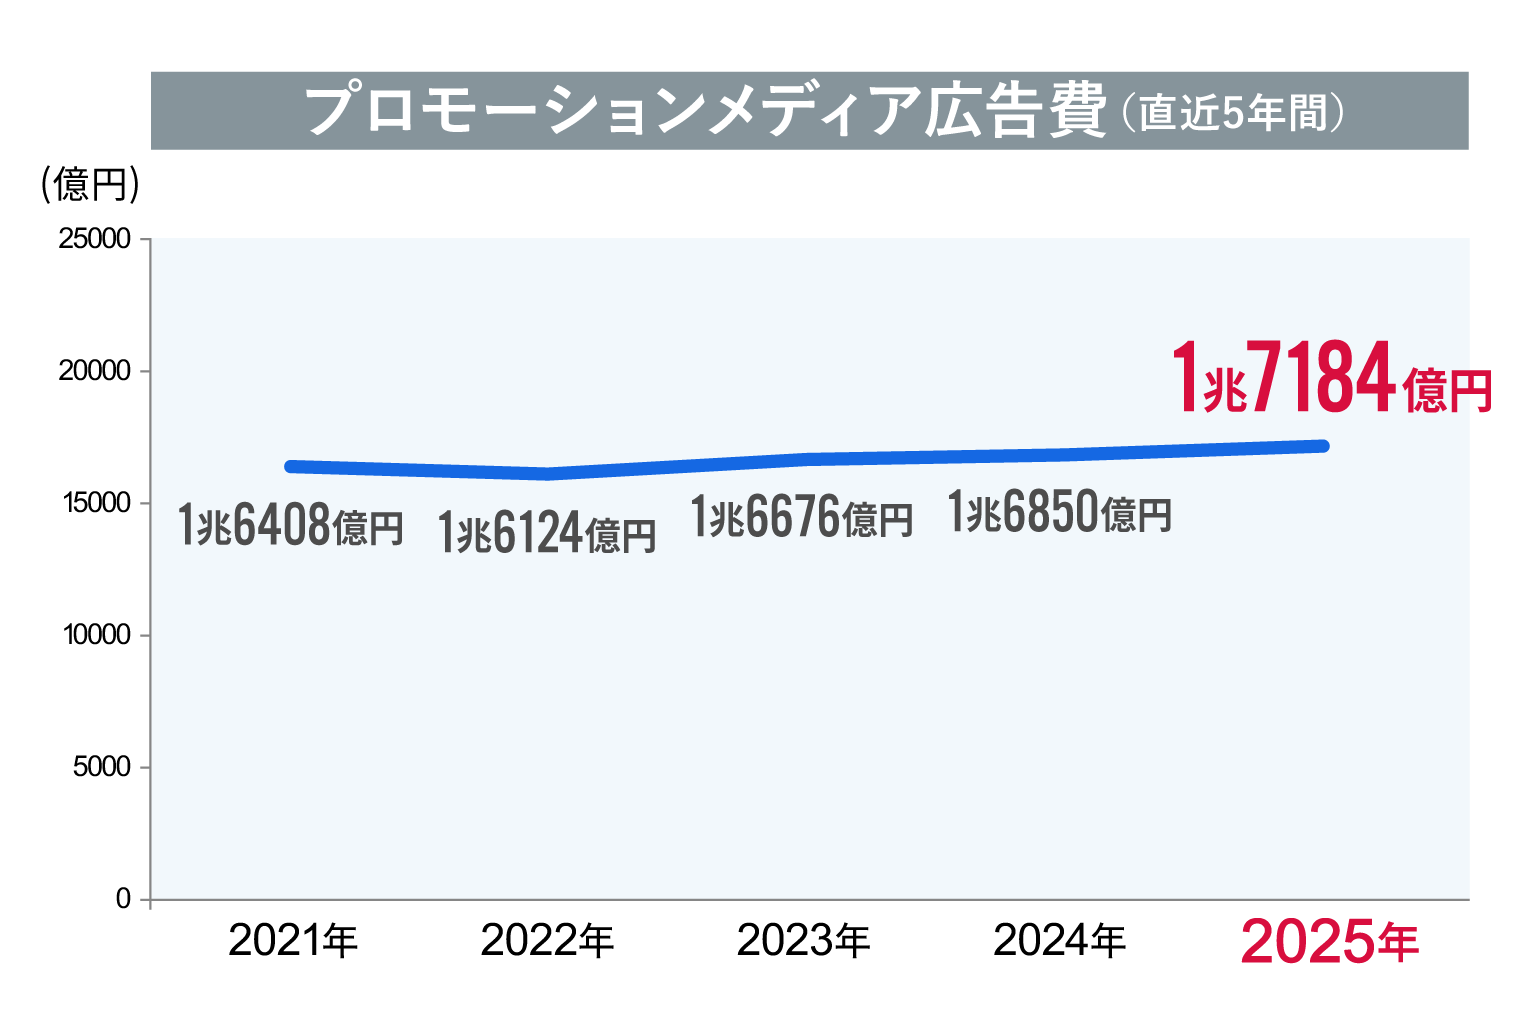
Morinaga: "Promotional Media Advertising Expenditures" are on a growth trajectory, reaching ¥1.7184 trillion, a 2.0% increase year-on-year. This marks the third consecutive year of growth since 2023, when COVID-19 was reclassified as a Category 5 infectious disease. As mentioned earlier, this likely reflects the heightened value placed on "real" experiences. Trends by category are as follows:
● Outdoor Advertising Expenditures
Morinaga: This segment grew to ¥304.2 billion, a 5.3% increase year-on-year. It performed well, with notable usage across many industries, particularly in "Beverages" and "Information & Communications."
Looking at the breakdown, short-term signage featured numerous impactful OOH campaigns designed for social media sharing, centered on large boards in downtown areas. Outdoor digital signage saw strong demand in urban commercial districts.
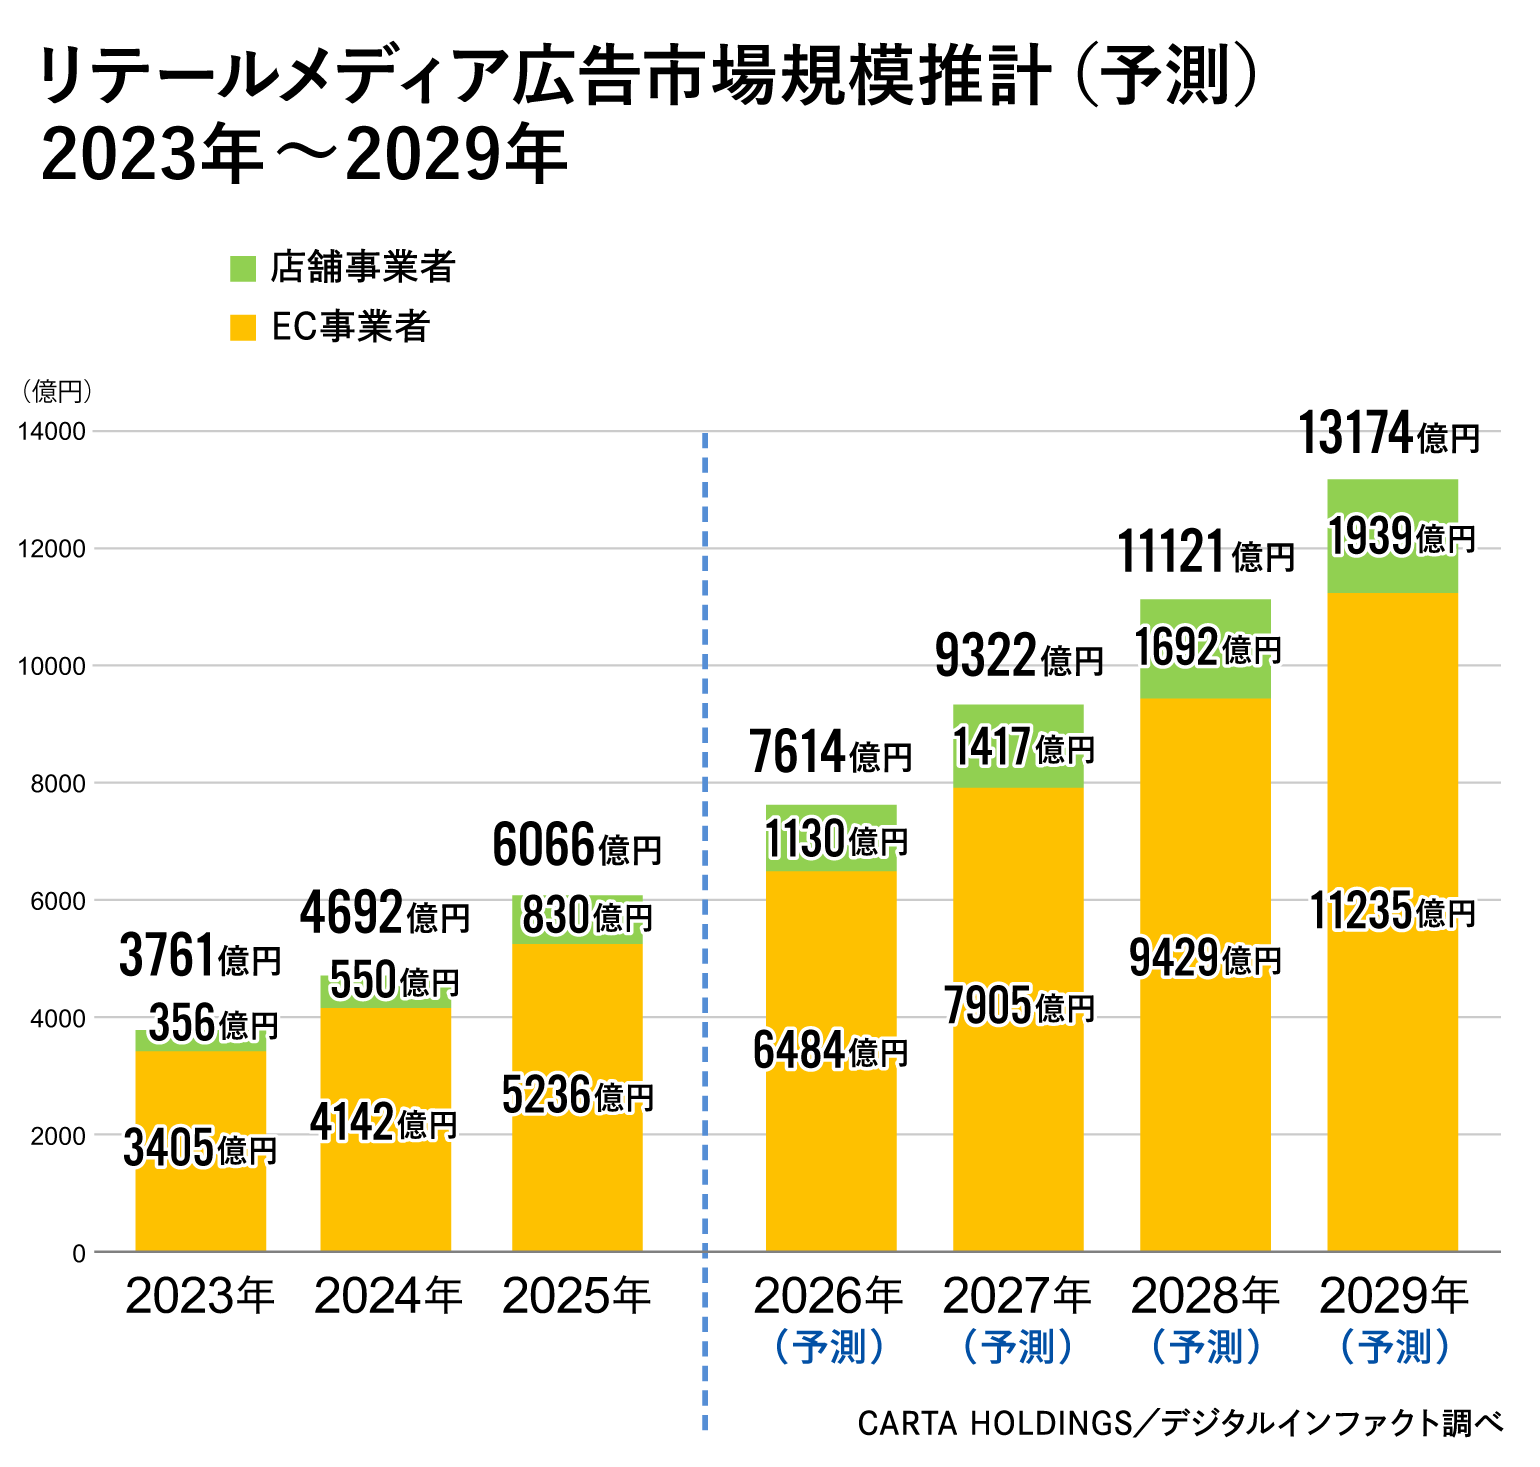
Noteworthy is programmatic DOOH (digital out-of-home advertising), which automates ad transactions and delivery. Its network is beginning to expand, entering a phase of widespread adoption. Additionally, so-called retail media (proprietary media provided by retailers and distributors), such as in-store signage, is also becoming increasingly active. ( Explained separately )
●Transportation Advertising Expenditures
Morinaga: 173.6 billion yen, a 108.6% increase year-on-year. Growth was driven by the full recovery of foot traffic and rising inbound demand.
Station media continues to see high demand for large-scale digital signage, with a trend of new digital signage installations at stations persisting, particularly in major cities.
For buses, demand for bus body advertising and "bus stop advertising" is strong in major metropolitan areas. Airports exceeded the previous year, primarily driven by digital signage, due to expanding inbound demand.
Taxi advertising saw increased placements from B2B companies due to the promotion of AI-related services, while B2C company placements also expanded.
● Insert and DM (Direct Mail) Advertising Expenditures
Morinaga: Insert advertising expenditure was ¥235.4 billion, down 3.6% year-on-year to 96.4% of the previous year, partly due to declining newspaper subscription rates. By industry, "mail order," "membership-based individual home delivery," and "travel/lodging" saw increases, while purchase businesses like recycling shops also remained strong.Conversely, sectors like "Education/Cultural Services" and "Automobile Sales" saw declines. However, due to the impact of rising prices, these ads were also actively used for promoting products and services targeting community-based stores and the elderly.
Direct mail (DM) advertising expenditure was ¥270.8 billion, 94.6% of the previous year's level. This decline was influenced by factors such as the October 2024 postal rate revision, prompting a review of mailing volumes and media choices. A shift was observed, particularly among mail-order companies, from one-off "campaign-type DM" to "personalized DM" designed to foster communication with recipients. Another notable trend is the increasing use of DM included with packages.
●Free Paper Advertising Expenditures
Morinaga: 105.6 billion yen, representing 80.9% of the previous year's figure. The decrease in 2025 was due to suspensions and discontinuations of publications accompanying the shift to fully digital formats.
Although the market has shrunk, the demand for lifestyle information closely tied to the local economy remains high, and free papers can be extremely useful in certain areas. Furthermore, more targeted free papers, such as those aimed at affluent audiences, are emerging.
*Free papers refer collectively to tabloid-sized free papers, magazine-style free magazines, and telephone directories.
●POP Advertising Expenditures
Morinaga: Point-of-purchase (POP) advertising used in retail stores grew to ¥154 billion, a 3.8% increase year-on-year. Increased foot traffic and subsequent in-store purchases led to more POP displays at the point of sale, serving as direct communication touchpoints (real touchpoints) with consumers. Particularly in categories like "food" and "daily necessities," sales strategies were strengthened, partly in response to price adjustments due to rising costs.
However, budget restraint was also observed, reflecting the shift from traditional POP to digital media like in-store signage and rising costs for paper and materials.
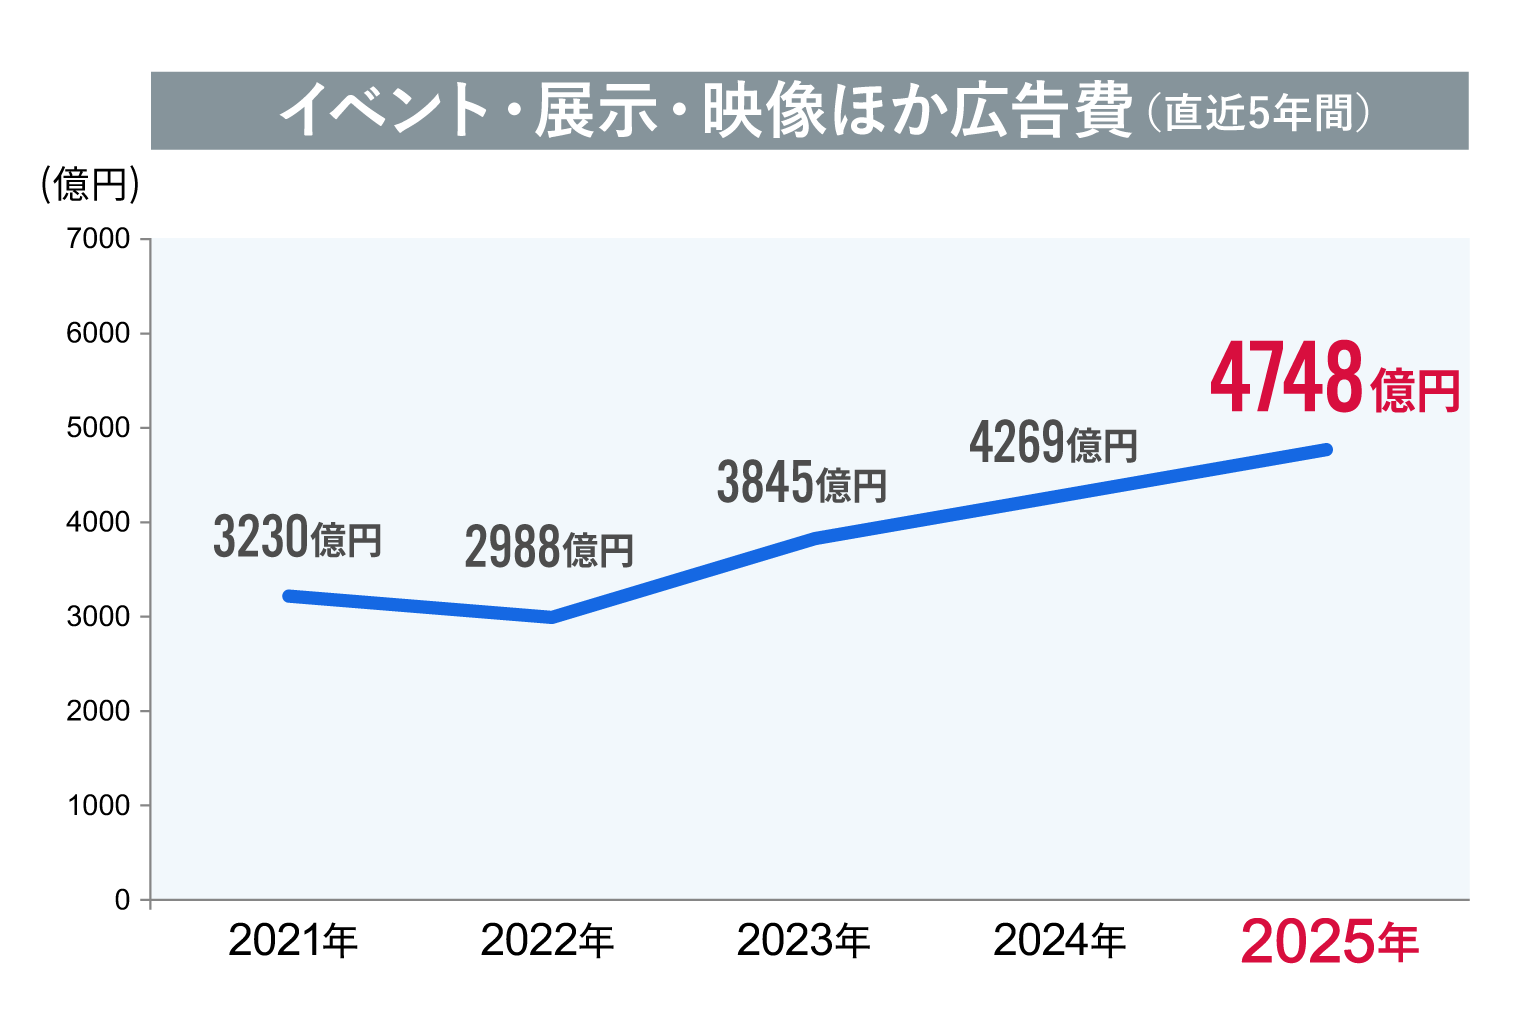
● Event, Exhibition, Video, and Other Advertising Expenses
Morinaga: Advertising expenses increased by 111.2% year-on-year to ¥474.8 billion, achieving double-digit growth. 2025 saw the convergence of major events such as the Osaka/Kansai Expo, the Japan Mobility Show, and the Tokyo 2025 World Athletics Championships.
Morinaga: Factors driving the increase in "Event, Exhibition, Video, and Other Advertising Expenses" include heightened consumer demand for real-world experiences. Concurrently, various companies reaffirmed the value of real-world experiences, leading to more active efforts to create customer touchpoints through events and exhibitions. It also seems that as digital grows, the desire for real-world experiences strengthens.
Retail Media is also gaining attention! Insights from Japan's 2025 Advertising Expenditures
──Finally, a few questions. First, as the internet advertising market grows significantly, challenges like ad fraud and ad placements on inappropriate media persist. What initiatives is the advertising industry advancing to address these issues?
Takamatsu: I believe there are two major challenges in internet advertising: "advertiser protection" and "consumer protection."
Regarding advertiser protection, a major concern with many programmatic ads is "brand safety" – the risk that ads appear on inappropriate media due to the vast number of potential placements. Another issue is the existence of "invalid traffic," such as clicks or impressions generated artificially by bots to inflate ad costs.
Regarding this point, JICDAQ (Japan Internet Advertising Quality Assurance Association), one of the industry associations, is taking action. JICDAQ verifies, confirms, and certifies whether advertising-related businesses are conducting their operations appropriately according to the certification standards for business processes to ensure the quality of digital ad placements, which JICDAQ has established for "brand safety" and "invalid traffic countermeasures." To date, many advertising-related businesses have obtained JICDAQ certification.
Furthermore, in June 2025, the Ministry of Internal Affairs and Communications released its "Guidance for Advertisers and Others on the Proper and Effective Delivery of Digital Advertising." Against this backdrop of heightened awareness of the issue, we expect the pace of certification acquisition by even more businesses to accelerate.
Another key aspect is consumer protection. As programmatic advertising, which handles vast numbers of ads, continues to grow, there are likely cases where consumers experience harm or suffer disadvantages due to inappropriate ads that slip through the regulations and screening processes of publishing media. This issue is also recognized within the industry and is being discussed. ──────
──Regarding the third-party cookie regulations that became a major topic several years ago, what is the current status?
Takamatsu: In July 2024, Google announced a de facto reversal of its plan to phase out third-party cookies in its Chrome browser. However, the trend toward privacy protection remains unchanged, and I believe this topic has further heightened public awareness about the "sound use of data."
As marketing methods utilizing user data become commonplace, appropriate data usage that respects privacy and other considerations will always be required. For the healthy growth of the internet advertising market, I expect discussions on how to appropriately utilize data will continue to progress.
──As AI becomes more prevalent in society, what is the current state of AI adoption in advertising media and production?
Takamatsu: Regarding AI adoption, major platforms are leading the way, implementing AI-powered advertising optimization tools. Other developments include the release of creative generation products that incorporate legal compliance measures, and AI-driven creative review processes. AI agents handling operational advertising tasks are expected to reduce operational burdens and enhance advertising effectiveness.
On the other hand, we believe there are aspects requiring careful handling, such as the transparency of AI-driven ad delivery and methods for controlling it. Looking overseas, guidelines are being established and updated daily to prevent AI from generating inappropriate, harmful, or fraudulent ads and content, and to prevent data leaks and privacy violations. I think Japan will likely follow this trend.
──Regarding AI, we're seeing more instances where search engines summarize results and provide answers directly, leading to situations where users never reach the website—the so-called "zero-click" phenomenon. How does this impact search-linked advertising?
Takamatsu: I believe this is a major focus within the industry. Looking back, the premise of search-linked advertising is the "active query by the user." People search because they have a question, and ads are inserted among the search results. This became a massive market.
The current trend is that instead of users browsing various sites themselves, AI now provides summaries. Previously, the top of search results was prime real estate for ads. However, depending on the relevance between the ad and the content, AI responses may now occupy that space. Additionally, as seen in some cases, attempts to combine AI with advertising are being observed.
Personally, I believe we're moving towards a hybrid approach. Rather than viewing search-linked ads and AI search as opposing forces, we should redefine the role of search-linked ads and their evaluation metrics. Simultaneously, we should advance strategies (AIO: AI Optimization) to appear in search results as "AI-recommended brands."
──In the explanation of promotional media advertising expenses, you mentioned the media owned by retailers and distributors. What are your thoughts on the potential of this?
Takamatsu: As this is a relatively new field, interpretations of its definition vary, and classification remains challenging at this stage. For us, it literally refers to the entirety of media owned by distribution and retail companies themselves. For example, digital signage at convenience store locations and advertising expenses on merchandise-focused e-commerce platforms are also included in retail media, as they represent media owned by the platform.
CARTA HOLDINGS, INC conducts its own annual survey and publishes the estimated results.
Morinaga: Seeing double-digit growth in advertising spending on e-commerce platforms for physical goods, I believe retail media advertising spending is increasing significantly. Furthermore, what was traditionally viewed as promotional spending is now blurring the lines between promotion and advertising.
Takamatsu: There are various ways to classify it, but even focusing solely on digital signage, it's showing significant growth. Digital signage falls under the OOH category and, as mentioned earlier, is also included in retail media.
What we can say is that more and more retailers and distributors are starting to invest heavily in their own retail media.
──So we're seeing movements beyond traditional distinctions, like the convergence of sales promotion and advertising, or the integration of digital and physical channels.
Morinaga: What we see from "2025 Japan's Advertising Expenditures" is that we're not just looking at a simple picture of which media grew or declined, but rather within a much larger structural shift. In the future, we may need a different categorization than what we have now.
We intend to continue closely monitoring the environment surrounding advertising expenditures to capture a more accurate picture of "Japan's Advertising Expenditures."
Details on "2025 Japan Advertising Expenditures" and "Internet Advertising Expenditures" can be found here (Dentsu Inc. News Release).
Responsible for research and studies on Japan's advertising media market and marketing-related fields. Annually publishes "Japan's Advertising Expenditures," "Detailed Analysis of Internet Advertising Expenditures," and "Global Advertising Expenditure Forecasts." Collaborates with external research institutions to analyze future trends in the advertising market.
Group Communications Division, Relationship Management Office
Section Chief
Joined Cyber Communications (now CARTA HOLDINGS, INC). After working in sales handling internet-specialized advertising agencies, was seconded to Dentsu Digital Inc. Later transferred to Dentsu Inc.'s sales division, overseeing the media department during a secondment to an affiliate of a precision chemical manufacturer. Upon returning, engaged in sales management and sales planning. Currently handles PR, industry association liaison, and market research-related tasks.
Also read
"2025 Japan Advertising Expenditures Analysis"──Exceeding 8 Trillion Yen for a Record High. Internet Advertising Expenditures Surpass 50% of Total Composition