Note: This website was automatically translated, so some terms or nuances may not be completely accurate.
Analysis of "2023 Japan Advertising Expenditures"──The downgrade of COVID-19 to Category 5 provided tailwinds, setting a new record high. How did advertising expenditures change during the pandemic?
On February 27, 2024, " 2023 Japan Advertising Expenditures " was announced. Toshiyuki Kitahara of Dentsu Inc. Media Innovation Lab explains the changes in the advertising markets for the four major media outlets, the internet, and promotional media.

Want a quick overview? Check out the simple explanation here!
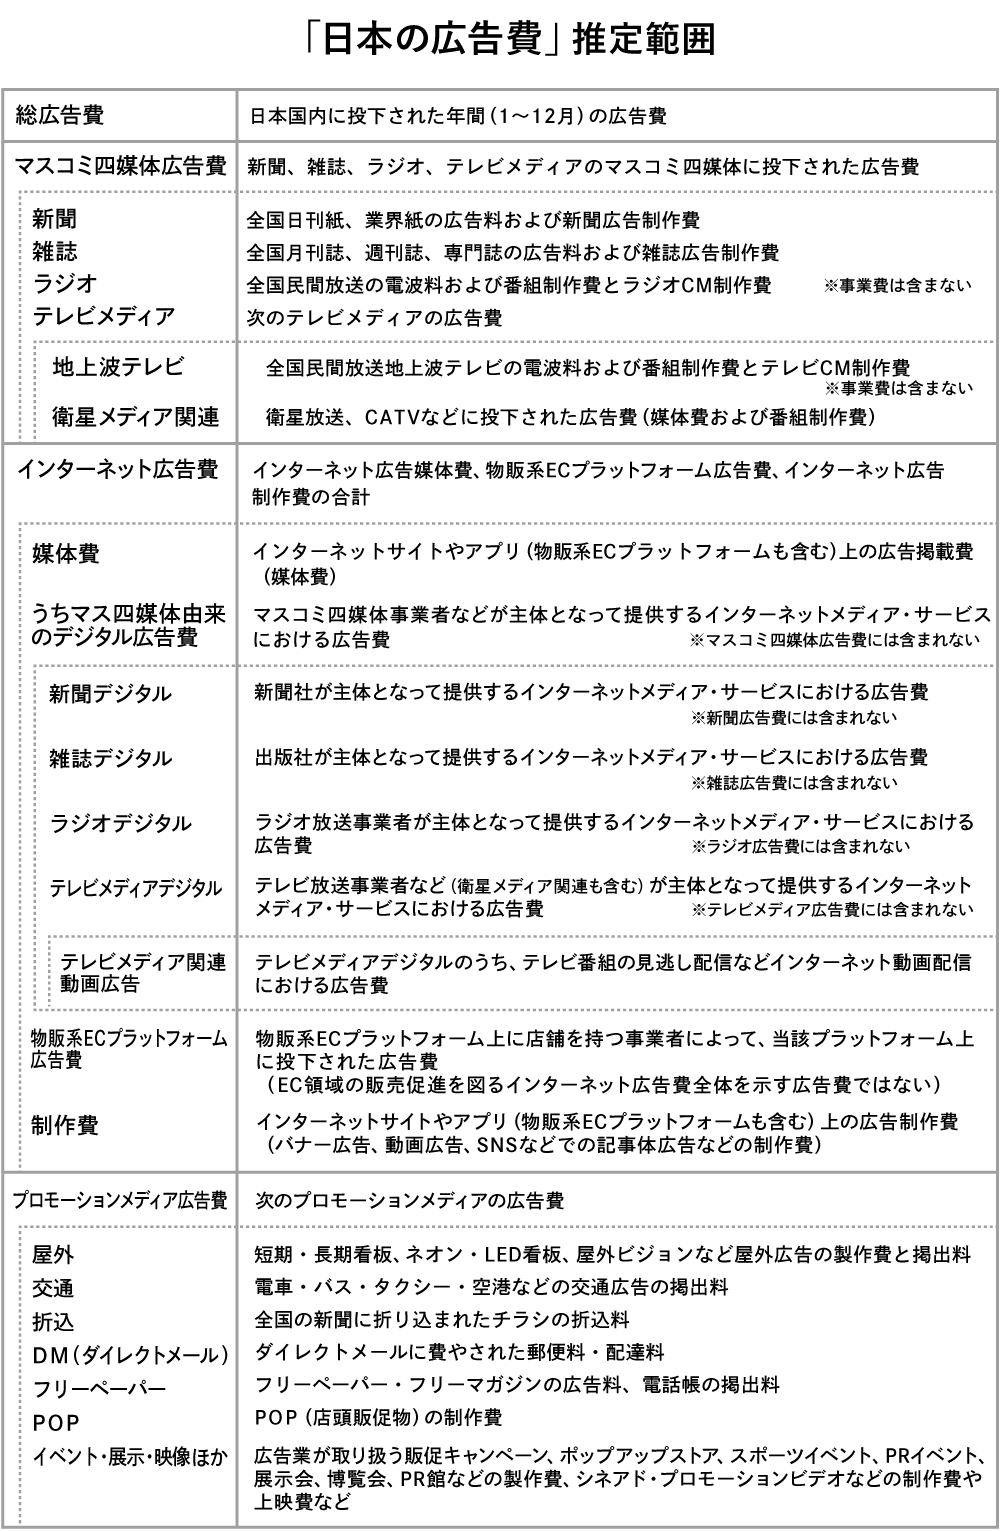
▼What is "Japan's Advertising Expenditures"?
▼ Three Key Points of "Japan's Advertising Expenditures 2023"
<Table of Contents>
▼Overview of "2023 Japan Advertising Expenditures"──Advertising Demand Recovers, Centered on Industries Related to Human Flow!
▼Mass Media Advertising Expenditures: Magazine Advertising Turns Positive, but Overall Continues to Decline
▼Internet Advertising Expenditures: Maintains Over ¥3 Trillion Against Backdrop of Society's Digitalization
▼Promotional Media Advertising Expenditures: First Positive Growth in Four Years Due to Recovery in Human Flow
▼COVID-19 Transitions to Category 5. Will Advertising Expenditures Return to Pre-Pandemic Levels?
Overview of "2023 Japan Advertising Expenditures"──Advertising demand recovers, particularly in industries related to foot traffic!
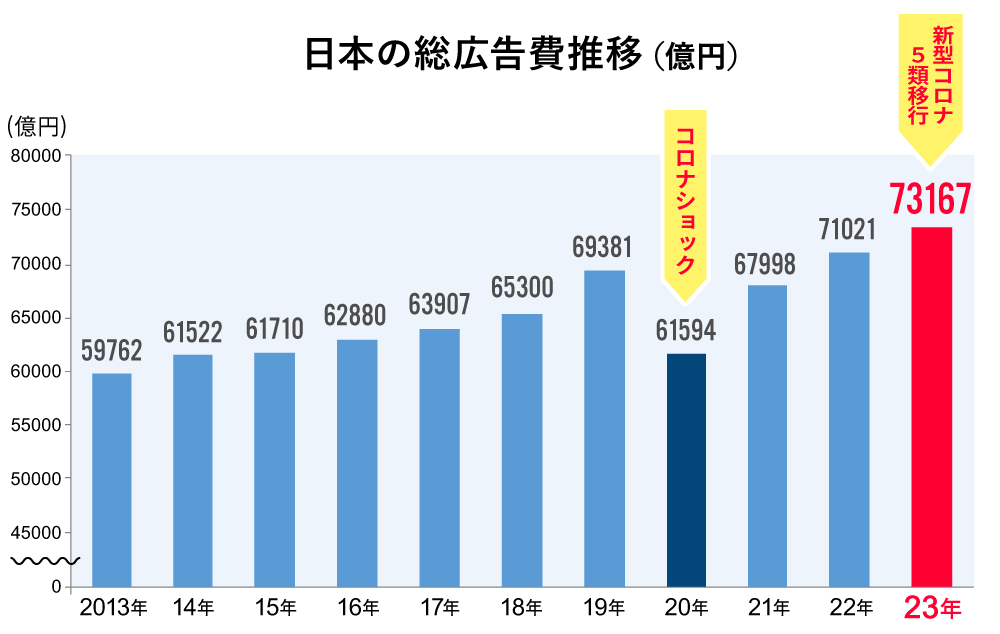
Japan's total advertising expenditure for 2023 (January-December) reached ¥7.3167 trillion, a 3.0% increase year-on-year. This surpasses last year's record high of ¥7.1021 trillion, the highest since estimates began in 1947.
A major factor was the return of foot traffic following the reclassification of COVID-19 as a Class 5 infectious disease. Within promotional media advertising, "Events, Exhibitions, Video, etc." saw a significant recovery. Furthermore, the growth in internet advertising spending, driven by the rapid digitalization of society during the pandemic, also propelled the overall market.
In the first half of 2023, following the reclassification of COVID-19 to Category 5, increased outings, domestic and international tourism, and real-world events became more active. As human flow recovered, a corresponding recovery in related advertising demand was observed.
In the second half, despite impacts from record-breaking heatwaves and Middle East issues, social and economic activities intensified. Advertising demand rose, particularly in industries tied to human flow such as transportation, leisure, and dining services.
Japan's advertising expenditure significantly
- "Mass Media Advertising Expenditures"
- "Internet Advertising Expenditures
- "Promotional Media Advertising Expenditures"
.
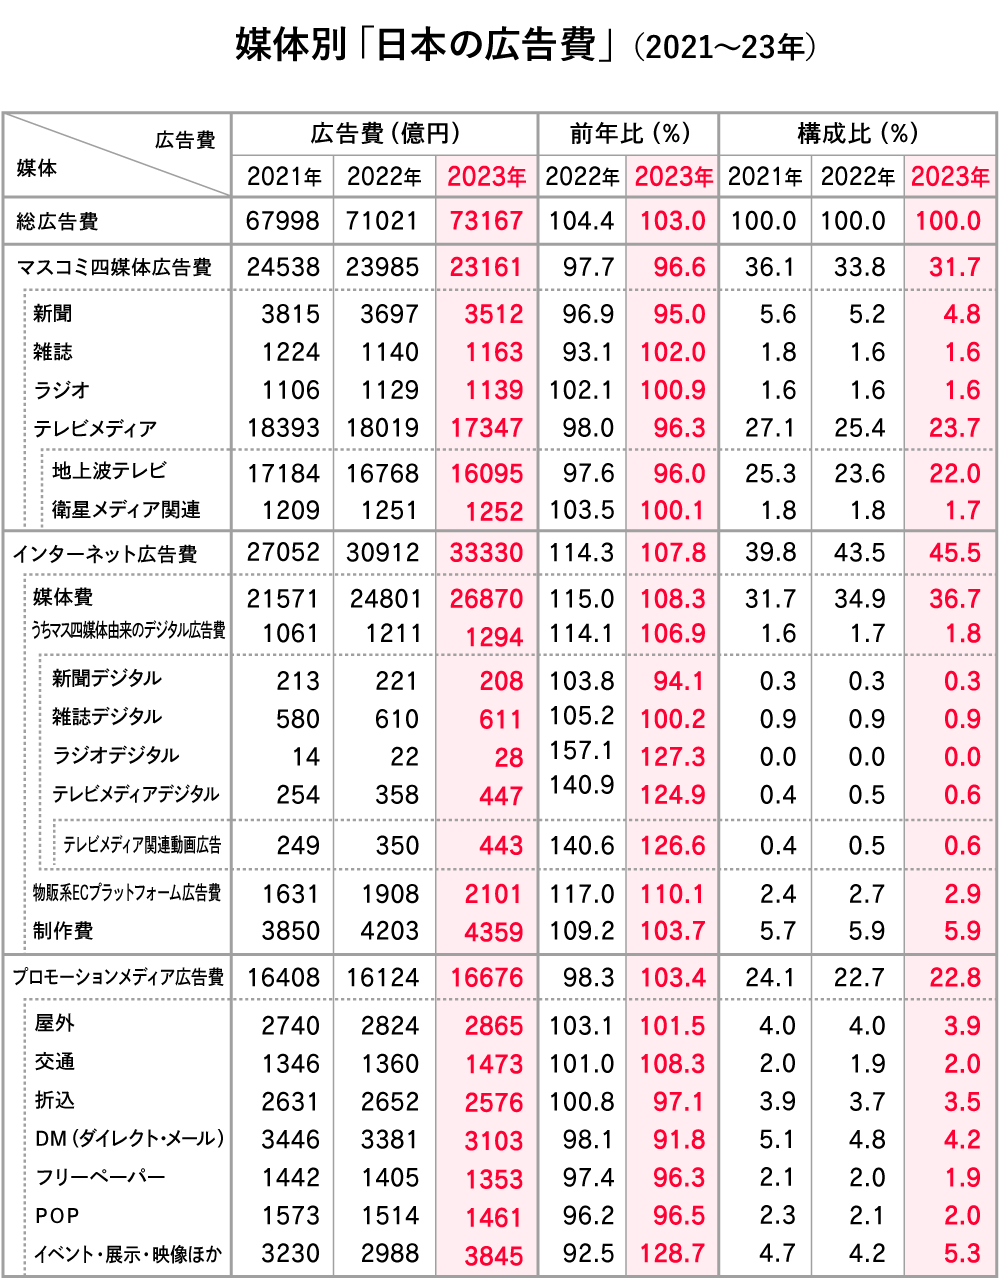
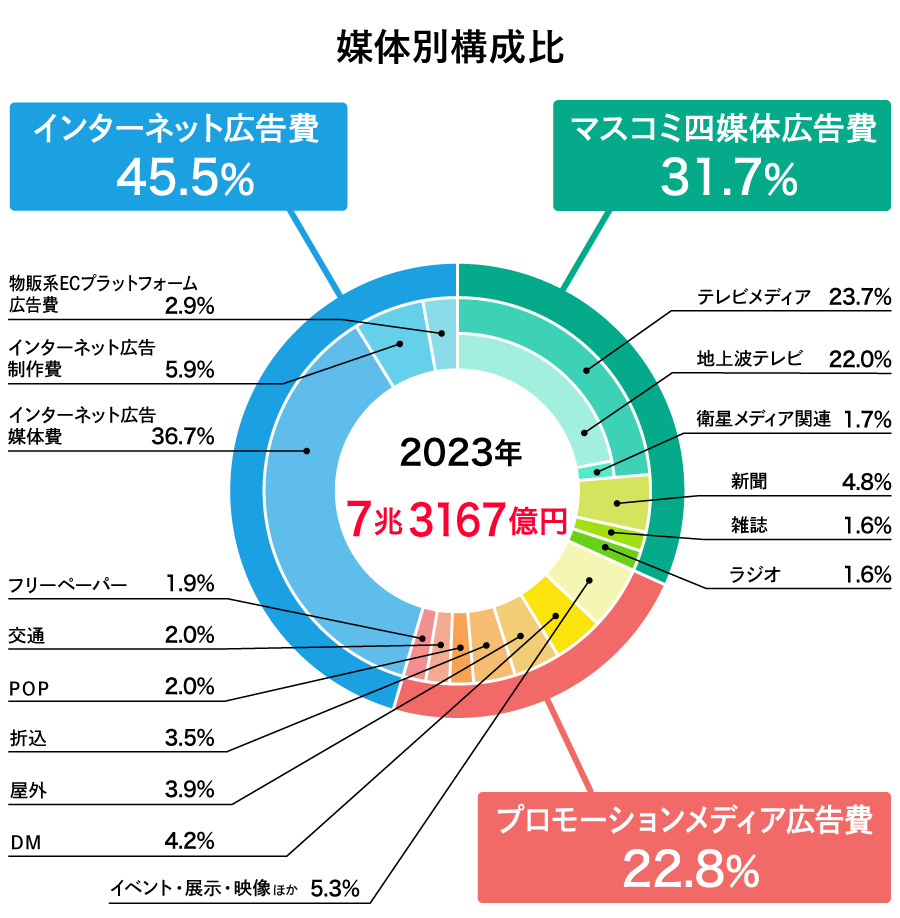
The respective shares of advertising expenditure are: mass media at 31.7%, internet at 45.5%, and promotional media at 22.8
Internet advertising expenditure reached ¥3.333 trillion, a 107.8% increase year-on-year, marking a ¥241.8 billion rise from the previous year. This growth was driven by increased demand for video advertising due to the expanding use of connected TVs (TV terminals connected to the internet) and the aggressive market expansion of digital sales promotions.
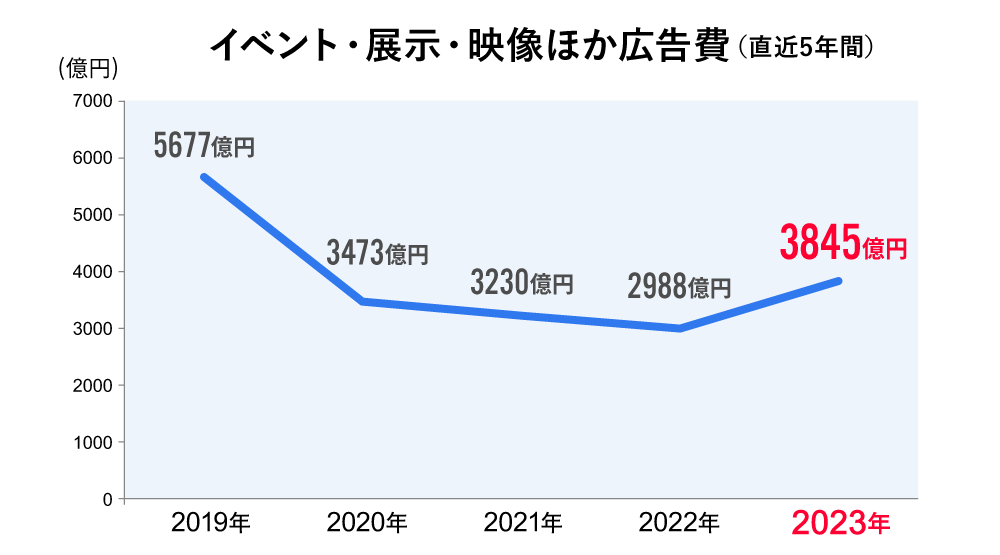
Another major feature of 2023 was the high growth in the "Events, Exhibitions, Video, etc." category, which reached ¥384.5 billion, a 128.7% increase year-on-year, driving promotional media advertising spending. This growth stems from the revival of events that had been canceled or scaled down during the pandemic, the return of foot traffic to large-scale mixed-use commercial facilities, and the recovery of inbound demand. However, spending has not yet returned to pre-pandemic 2019 levels. This will be discussed later.
●Mass Media Advertising Expenditures
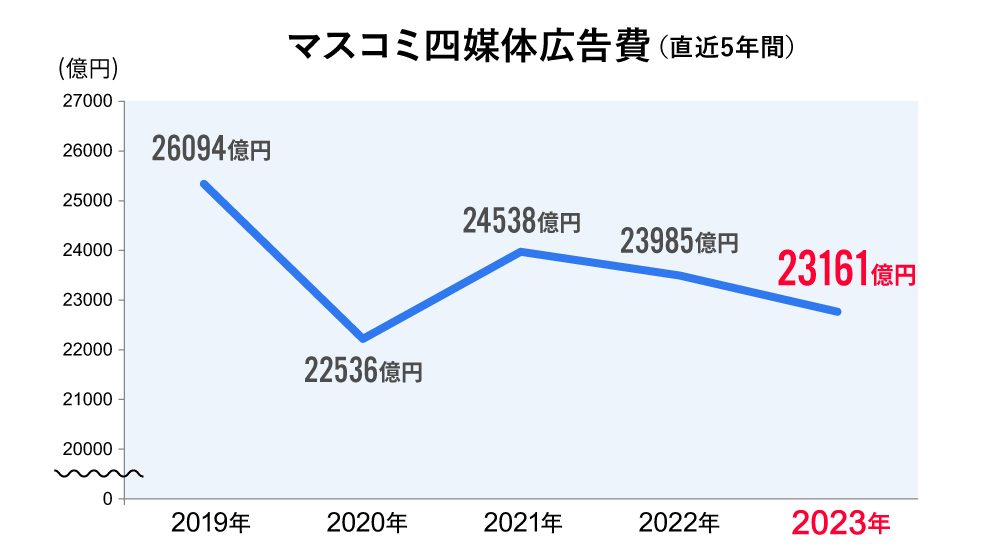
Advertising expenditure across the four major mass media outlets—newspapers, magazines, radio, and television—totaled ¥2.3161 trillion, representing 96.6% of the previous year's level. This figure combines both media fees and production costs. Overall, spending across these four media channels declined for the second consecutive year.
Year-on-year comparisons for each medium were: newspapers at 95.0%, magazines at 102.0%, radio at 100.9%, and television media (combining terrestrial and satellite) at 96.3%. Magazine and radio advertising expenditures increased.
●Internet Advertising Expenditures
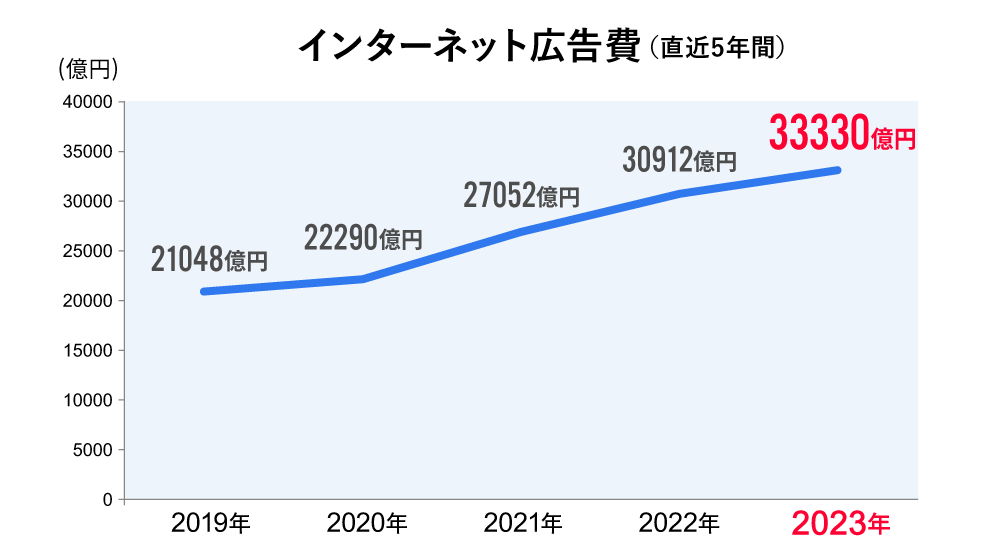
Internet advertising expenditure (the sum of internet advertising media costs, internet advertising production costs, and e-commerce platform advertising costs) reached ¥3.333 trillion, a 107.8% increase year-on-year, continuing to significantly drive the expansion of the advertising market.
Video advertising, in particular, continues to perform well, supporting the growth of the overall market. Details on Internet advertising media costs will be announced separately in March.
●Promotional Media Advertising Expenditures
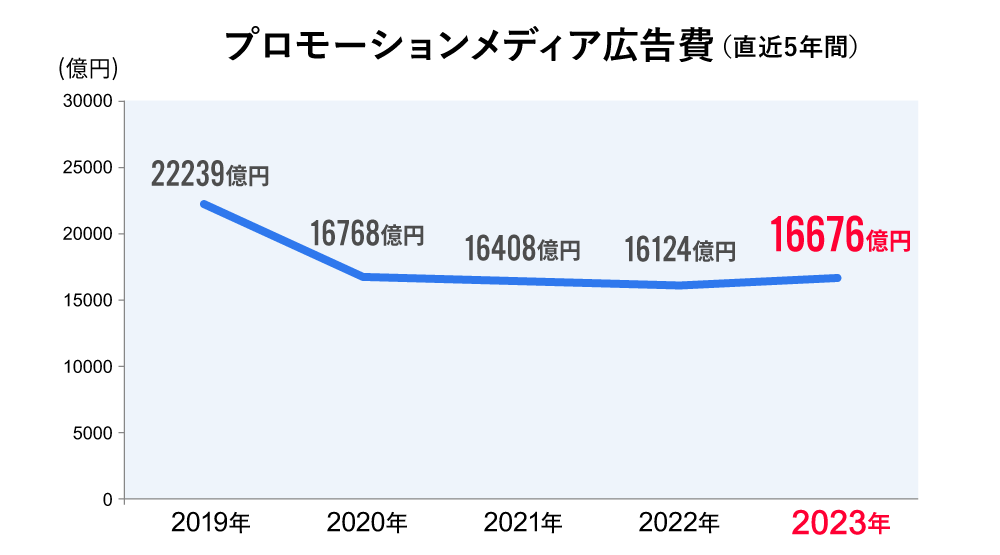
This reached ¥1.6676 trillion, a 3.4% increase year-on-year. With the reclassification of COVID-19 to Category 5 and other factors, previously canceled events resumed and expanded. As mentioned earlier, advertising spending on events, exhibitions, and video increased. Furthermore, the recovery in foot traffic led to continued growth in media such as transit advertising and outdoor advertising, contributing to the overall growth of promotional media.
Below, we provide a more detailed breakdown by category.
Mass Media Advertising Expenditures: Magazine Advertising Turns Positive, but Overall Continues to Decline
●Advertising Expenditures for the Four Mass Media <Newspaper Advertising Expenditures>
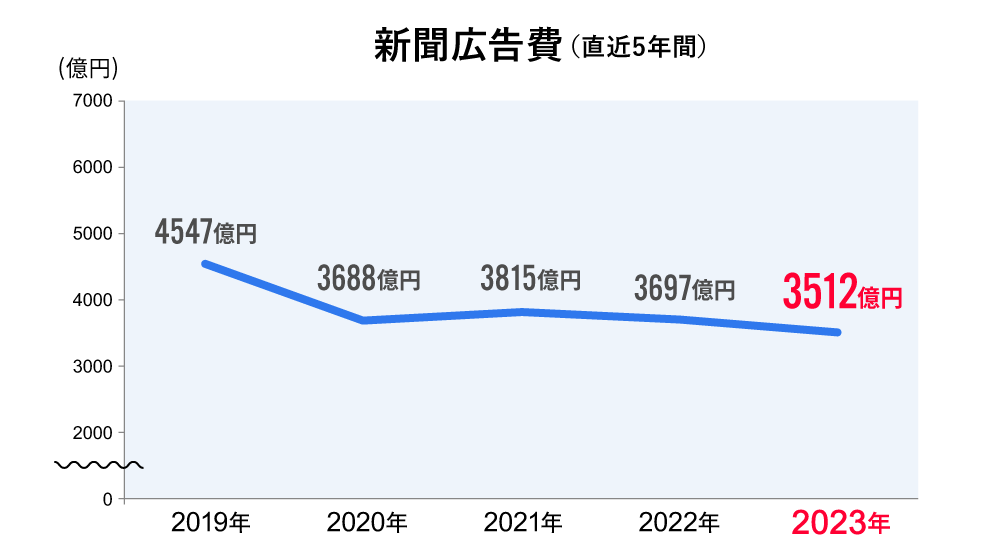
Newspaper advertising expenditure was ¥351.2 billion, representing 95.0% of the previous year. Although major sporting events like the 2023 World Baseball Classic and Rugby World Cup 2023 were held, the full-year figure decreased due to the rebound effect from the Beijing 2022 Winter Olympics and Paralympics the previous year, as well as the impact of rising prices.
By industry, advertising spending for transportation and leisure increased to 114.9% of the previous year, continuing the upward trend. Newspapers traditionally see high advertising spending from travel/lodging and transportation industries. The reclassification of COVID-19 to Category 5 led to more active human flow than the previous year.
While House of Councillors and House of Representatives elections generally have a positive impact on newspaper advertising for government agencies and organizations, spending was 82.4% of the previous year due to the rebound effect from the 26th House of Councillors election in 2022.
●Advertising Expenditures Across Four Media Channels<Magazine Advertising Expenditures>
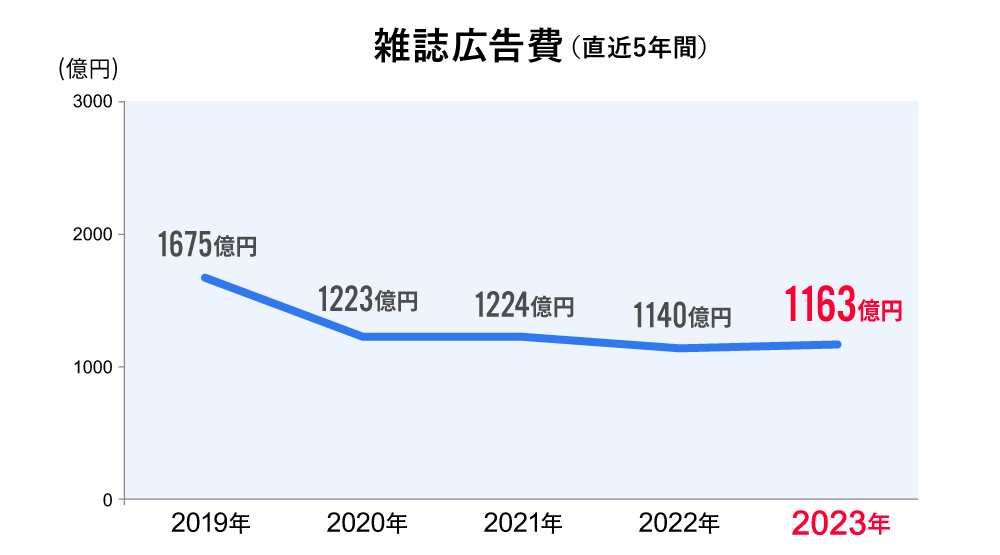
Magazine advertising expenditure grew slightly to ¥116.3 billion, a 102.0% increase year-on-year.
By industry, similar to newspaper ads, transportation and leisure saw growth, along with fashion and accessories, which constitute the majority of magazine advertising. The shift to Category 5 restrictions, increasing opportunities to go out, likely had a positive effect on fashion and accessories in particular.
However, the decline in the publishing market itself has continued since last year. The estimated sales value of paper publications in 2023 was 94.0% of the previous year (Source: Publishing Science Institute "Publishing Indicators" January 2024 issue). Magazines, in particular, saw a 92.1% year-on-year decline. In contrast, the electronic publishing market continued to grow, reaching 106.7% of the previous year. However, the overall publishing market, combining print and electronic, stood at 97.9% of the previous year, falling below the previous year's level.
●Mass Media Advertising Expenditures <Radio Advertising Expenditures>
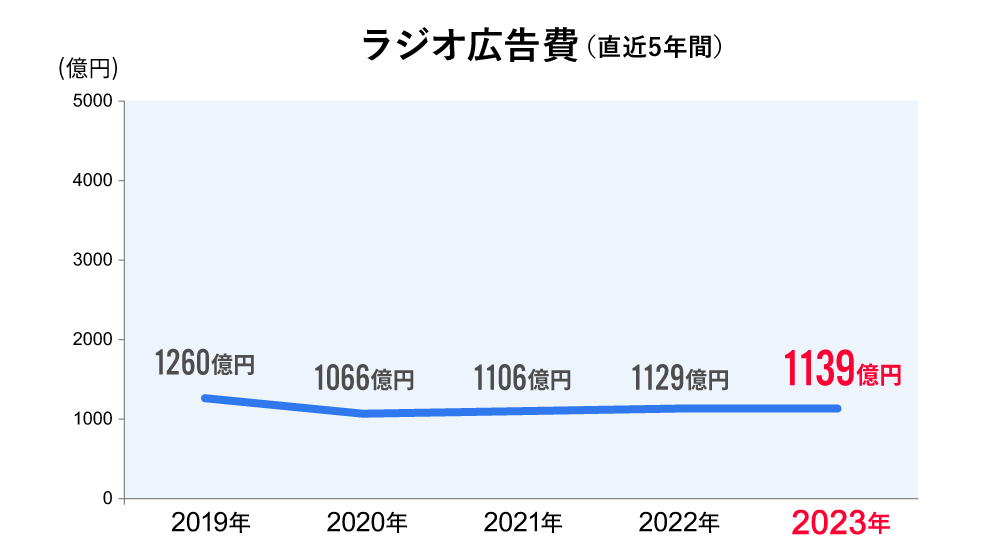
Radio advertising expenditure exceeded the previous year for the full year, reaching ¥113.9 billion, a 100.9% increase year-on-year. This marks the third consecutive year of positive growth since 2020.
By industry, sectors like fashion/accessories and dining/various services saw growth due to recovery from the pandemic and increased demand for outings and leisure, driving up radio advertising spending.
●Advertising Expenditures Across Four Major Media <TV Media Advertising Expenditures>
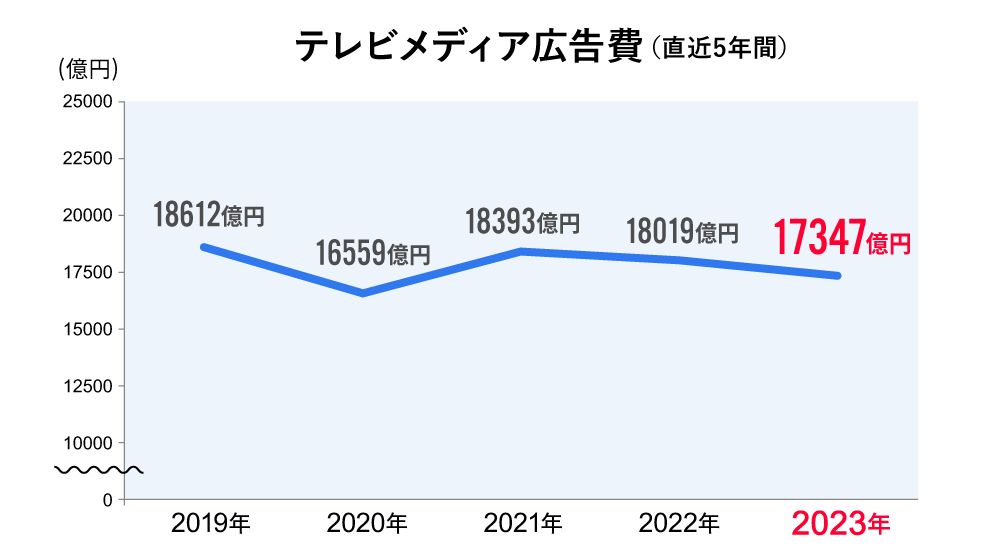
Television media advertising expenditure (terrestrial TV + satellite media-related) was ¥1.7347 trillion, 96.3% of the previous year. For terrestrial TV alone, it was ¥1.6095 trillion, 96.0% of the previous year.
2023 saw major sporting events and various other events, including the 2023 World Baseball Classic, the 2023 World Athletics Championships in Budapest, and the FIBA Basketball World Cup 2023.
However, time advertising spending on terrestrial television did not fully offset the decline resulting from the absence of major events like the Beijing 2022 Winter Olympics and Paralympics and the 2022 FIFA World Cup Qatar.
Similarly, for terrestrial TV spot advertising spending, the downgrading of COVID-19 to Category 5 led to increased advertising volume for travel-related services and major movie titles. As a result, transportation and leisure advertising is also showing signs of recovery.
A notable topic was the strong advertising demand for alcohol products following the revision of the Liquor Tax Act, which took effect on October 1. On the other hand, the information and communications sector, which accounts for a large share of terrestrial TV advertising revenue, remained sluggish.
Internet Advertising Expenditures: Maintaining Over 3 Trillion Yen Amid Society's Digitalization
Internet advertising expenditure reached 3.333 trillion yen. Of this, media fees accounted for 2.687 trillion yen.
Although the growth rate itself slowed compared to the previous year due to factors like yen depreciation, rising raw material costs, and inflation, significant growth continues against the backdrop of rapidly advancing societal digitalization.
Video services, in particular, saw an increase in both users and usage time following the COVID-19 pandemic, leading to significant growth in video advertising figures.
Furthermore, the use of digital tools in corporate sales promotion activities has advanced, and as a result of the growth in digital sales promotion figures, advertising media costs have increased overall.
● Digital Advertising Spending Originating from the Four Mass Media
Amid declining advertising spending across the four major media outlets, Dentsu Inc.'s survey consistently highlights the so-called "digital advertising spending originating from the four major media outlets."
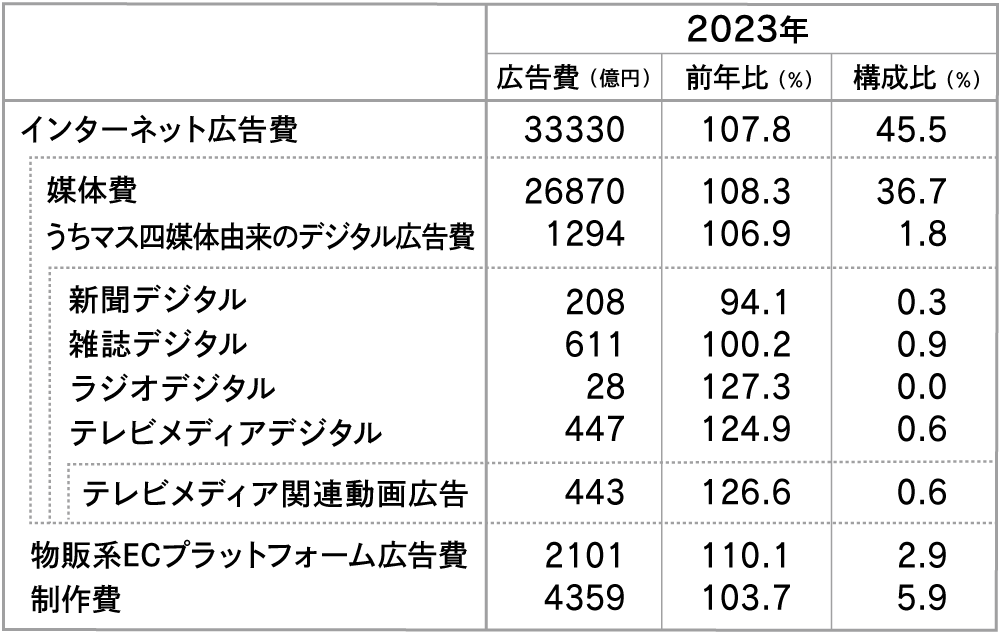
This category includes program streaming services by TV and radio stations, digital newspapers provided by the Media Services / Newspaper Division, and magazine websites by publishers.
Digital advertising originating from the four major media outlets is not counted as advertising expenditure for those media, but rather included in internet advertising media expenditure. It increased to ¥129.4 billion, a 106.9% year-on-year increase.
● Newspaper Digital Advertising Expenditures
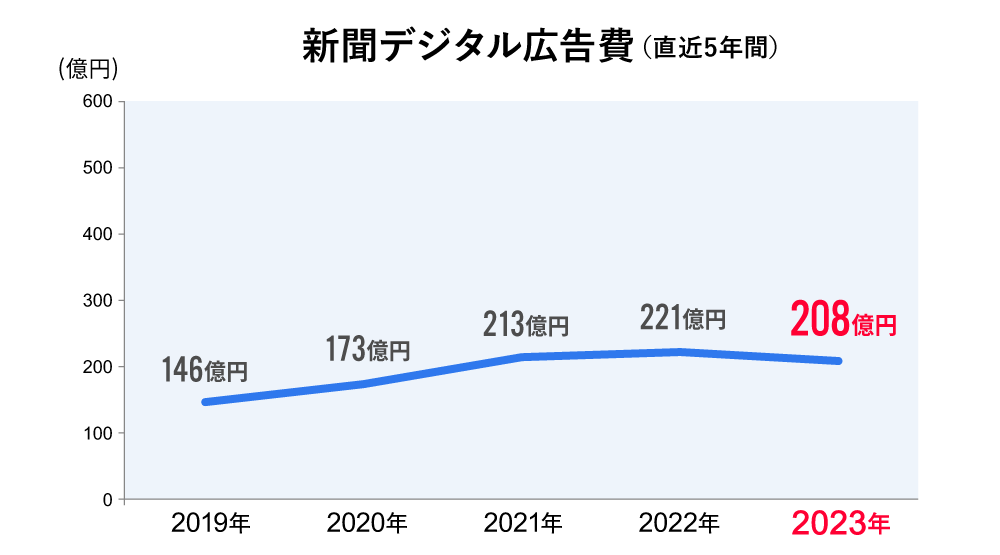
"Newspaper digital" advertising faces stagnant ad rates due to the maturing digital ad market and the impact of cookie-less environments. A shift toward video ads has also reversed the previous growth trend. Spending decreased to ¥20.8 billion, a 94.1% year-on-year decline.
●Magazine Digital Advertising Expenditures
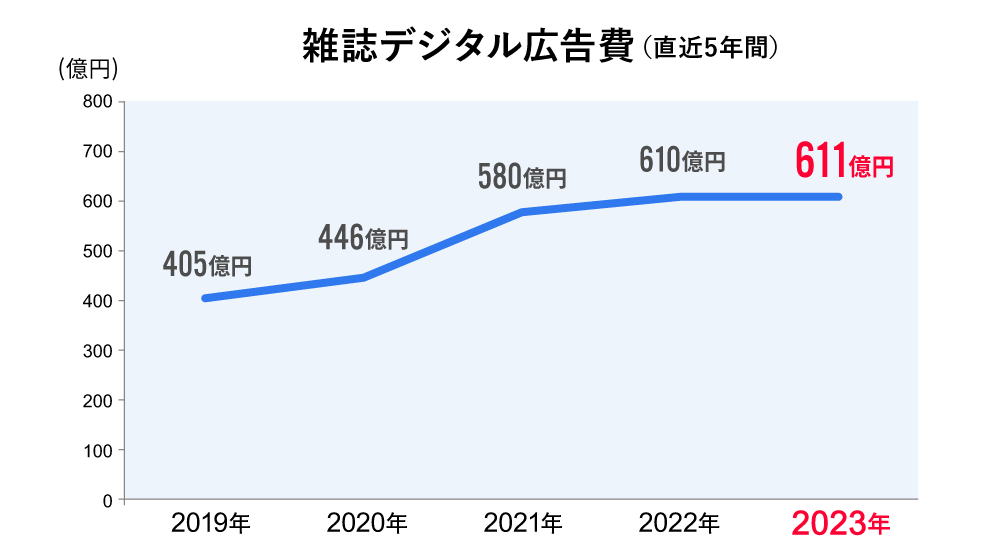
Among digital advertising spending originating from the four major media outlets, "Magazine Digital" holds the largest market share. It accounts for approximately half of the ¥129.4 billion total, at ¥61.1 billion.
Page views on major web media operated by publishers and follower counts on major SNS platforms are trending steadily. Additionally, advertising initiatives that are entirely self-contained within SNS, such as planning product development and events within SNS communities, are beginning to emerge.
SNS campaigns linked with print media are a particular strength of publishers. Such initiatives, leveraging publishers' cultivated content creation capabilities and community-building strengths, are highly valued as digital media and support advertising revenue.
Furthermore, while manga dominates the e-book market, the rising global popularity of manga and anime content will likely drive new revenue streams through overseas IP exports and advertising distribution.
●Radio Digital Advertising Expenditures
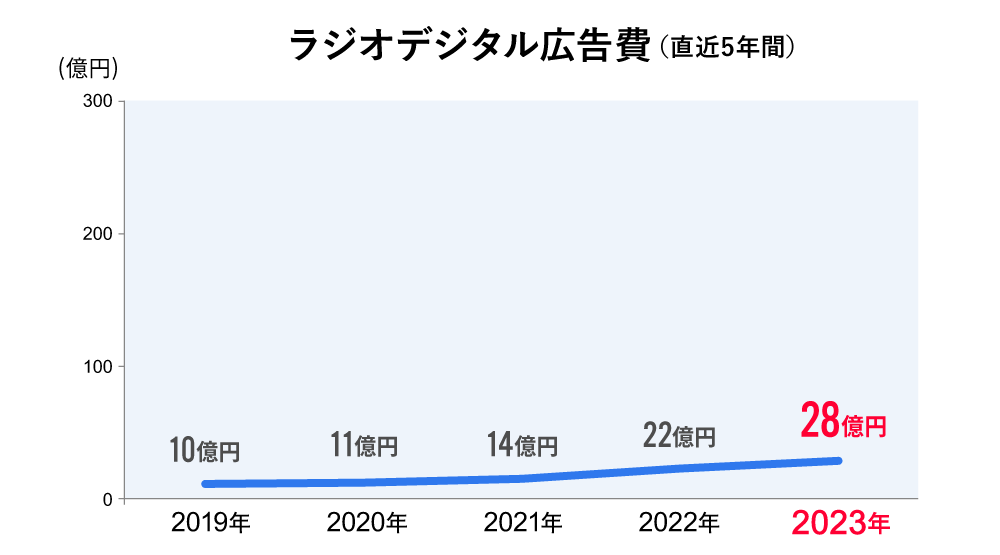
Radio digital advertising spending reached ¥2.8 billion, a 127.3% increase year-on-year, continuing significant growth from the previous year.
Continuing from the previous year, digital initiatives in audio media, including podcasts, maintained high visibility, and an increasing trend was observed in new advertising placements for radio digital advertising, including radiko. The growth potential of audio media as a whole is noteworthy.
●TV Media Digital Advertising Expenditures
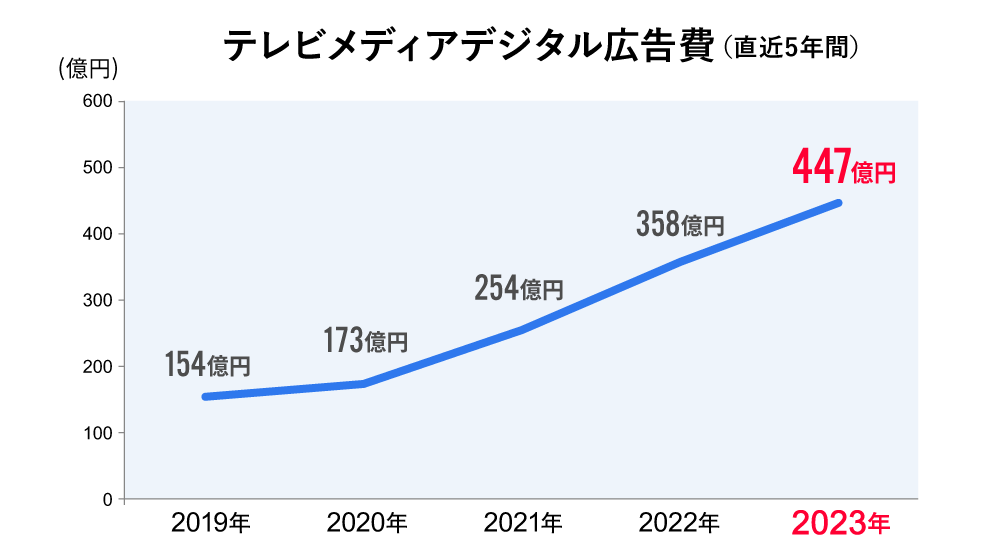
Within TV media digital, "TV media-related video advertising" reached ¥44.3 billion (126.6% YoY), showing substantial growth for the second consecutive year.
This category estimates advertising expenditure primarily on internet video streaming services operated by TV broadcasters, such as free catch-up streaming services for TV programs. The growth in advertising spending here is driven by an increase in viewers enjoying not only dramas but also variety shows and live sports broadcasts.
Internet TV services also offer viewers a wider range of choices, expanding beyond dating reality shows, dramas, and variety programs to include sports-related programming. User numbers are steadily increasing. The significant boost from viewers who tuned in for the 2022 FIFA World Cup Qatar and have since remained loyal is also a major factor.
●Merchandise-Based E-Commerce Platforms
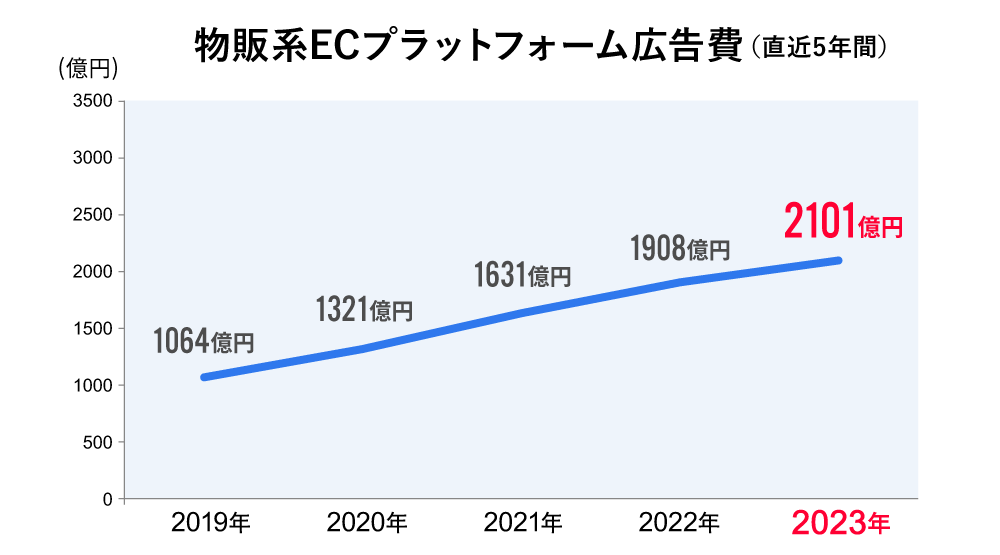
Advertising spending on product-based e-commerce platforms reached ¥210.1 billion, a 110.1% increase year-on-year, showing higher growth than the overall internet advertising market (107.8% year-on-year).
Driven by the pandemic solidifying e-commerce as a shopping habit, advertising spending on product-based e-commerce platforms continues to grow at double-digit rates. The market size has nearly doubled over the four years since 2019 (pre-pandemic), making it one of the fastest-growing categories within internet advertising.
However, as the surge in e-commerce demand gradually subsided, certain product categories that primarily grew due to stay-at-home demand faced challenges.
●Internet Advertising Production Costs
Driven by the revival of consumer activity following the reclassification of COVID-19 to Category 5, demand for internet advertising production continued to expand from the previous year.
By production type, web video ad production continues to expand, albeit at a slower growth rate. Notably, the upward trend in the number of video ads produced for display within content on video sites and apps remains steady.
However, partly due to stagnant unit prices for ad production, internet advertising production costs have shown relatively modest growth compared to other media in recent years, reaching ¥435.9 billion (103.7% year-on-year). In the programmatic advertising sector, AI adoption is gaining momentum, warranting future attention.
For details, please await the explanation of internet advertising expenditures to be released in March.
Promotional Media Advertising Expenditures: First Positive Growth in Four Years Due to Recovery in Foot Traffic
Promotional media advertising expenditure, which had declined in recent years due to pandemic-related restrictions on going out, recovered to positive growth in 2023, reaching ¥1.6676 trillion, a 103.4% increase year-on-year.
●Promotional Media Advertising Expenditures <Outdoor Advertising, Transportation Advertising>
Outdoor advertising continued its growth, reaching ¥286.5 billion, a 101.5% increase year-on-year. Demand recovered across various industries, including beverages and apparel, in addition to luxury brands and entertainment, primarily in urban areas. Advertising demand is particularly high for products targeting younger demographics, who are harder to reach via TV and digital.
Beyond outdoor vision, advertising spending on large, high-visibility OOH media continued to increase. Network-based digital OOH media, which delivers a single creative across multiple locations, saw significant growth as its use expanded across diverse industries.
With the return of foot traffic, transit advertising also increased to ¥147.3 billion, a 108.3% increase year-on-year. Digital signage installed within major stations continues to see strong demand.
At airports, with the lifting of COVID-19 entry restrictions, advertising demand for international flights has recovered significantly, particularly for digital signage, returning to near pre-pandemic levels.
In taxis, while aggressive advertising by B2B companies has leveled off, usage by luxury goods and other sectors has increased, maintaining spending at roughly the same level as the previous year.
●Promotional Media Advertising Expenditures <Insert Ads, DM (Direct Mail)>
Newspaper insert advertising, which was expected to increase with the lifting of movement restrictions, decreased to ¥257.6 billion (97.1% of the previous year) due to rising expenses and paper costs. However, advertising demand from distribution and retail sectors selling daily necessities, such as supermarkets and drugstores, has grown as a household defense measure against rising prices. Advertising demand from the home renovation sector was also strong, driven by the start of government support programs for home renovations.
Direct mail (DM) spending reached ¥310.3 billion, down 8.2% year-on-year. With the downgrade of COVID-19 to Category 5, face-to-face sales resumed, reducing demand for DM targeting home-based recipients or B2B sales purposes, which had previously been substituted by DM. Additionally, soaring printing material costs contributed to a significant year-on-year decline. Conversely, personalized DM utilizing data marketing gained recognition. Particularly in the finance and insurance sector, coupled with expectations for new financial products, an upward trend was observed.
●Promotional Media Advertising Expenditures <Free Papers>
Free papers decreased to ¥135.3 billion, representing 96.3% of the previous year. While some industries have recovered and turned around as foot traffic improved, circulation and publication frequency remain low due to the lingering effects of COVID-19 and high prices. Free papers focused on local information recovered as one medium supporting regional revitalization, but their inherently low circulation numbers prevented a significant overall boost.
●Promotional Media Advertising Expenditures <POP>
POP advertising expenditure was ¥146.1 billion, representing 96.5% of the previous year's level. Following the reclassification of COVID-19 to Category 5, highly entertaining initiatives, such as POP advertising integrated with digital elements, have been implemented for in-store product experiences. However, many of these are still in the proof-of-concept stage and have not yet driven significant increases in advertising expenditure.
●Promotional Media Advertising Expenditures <Events, Exhibitions, Video, etc.>
This category saw a significant increase to ¥384.5 billion, a 128.7% year-on-year increase. Within the event sector, the rebound effect from the resumption and scaling up of events, particularly the holding of the Japan Mobility Show 2023, contributed significantly.
While physical events themselves are expected to recover going forward, hybrid events combining online and offline formats have become established. It will likely take time for spending to return to pre-pandemic levels.
COVID-19 downgraded to Category 5. Will advertising spending return to pre-pandemic levels?
In 2023, advertising expenditure increased for the second consecutive year and reached a record high, partly due to a significant recovery in human flow following the COVID-19 downgrade. By industry, advertising expenditure increased year-on-year in sectors such as transportation/leisure and food service/various services.
Particularly noteworthy this year is advertising spending for events and exhibitions. After continuous declines since the pandemic began in 2020, spending rebounded significantly in 2023—the year COVID-19 was reclassified—reaching ¥384.5 billion, a 128.7% increase year-on-year.
However, advertising spending still falls significantly short of the pre-pandemic 2019 level (¥567.7 billion). This is largely attributed to the widespread adoption and continued popularity of online events among the public during the pandemic.
Since events are fundamentally experiential, demand for in-person events will certainly recover going forward, targeting customers seeking real-world communication. On the other hand, for so-called seminar-style events, holding them exclusively online or as hybrid events combining in-person and online formats is entirely feasible. Online events also have the advantage of attracting participants nationwide, increasing total attendance. Therefore, hybrid formats are expected to continue. Furthermore, the pandemic not only boosted online events but also remote work, meaning transit advertising has not fully returned to pre-pandemic levels either.
As outlined above, even after the pandemic subsides, some aspects will return to pre-pandemic levels while others will not, and this is reflected in Japan's advertising expenditure. It is important to note that the post-pandemic era, for better or worse, is a different world from "pre-COVID."
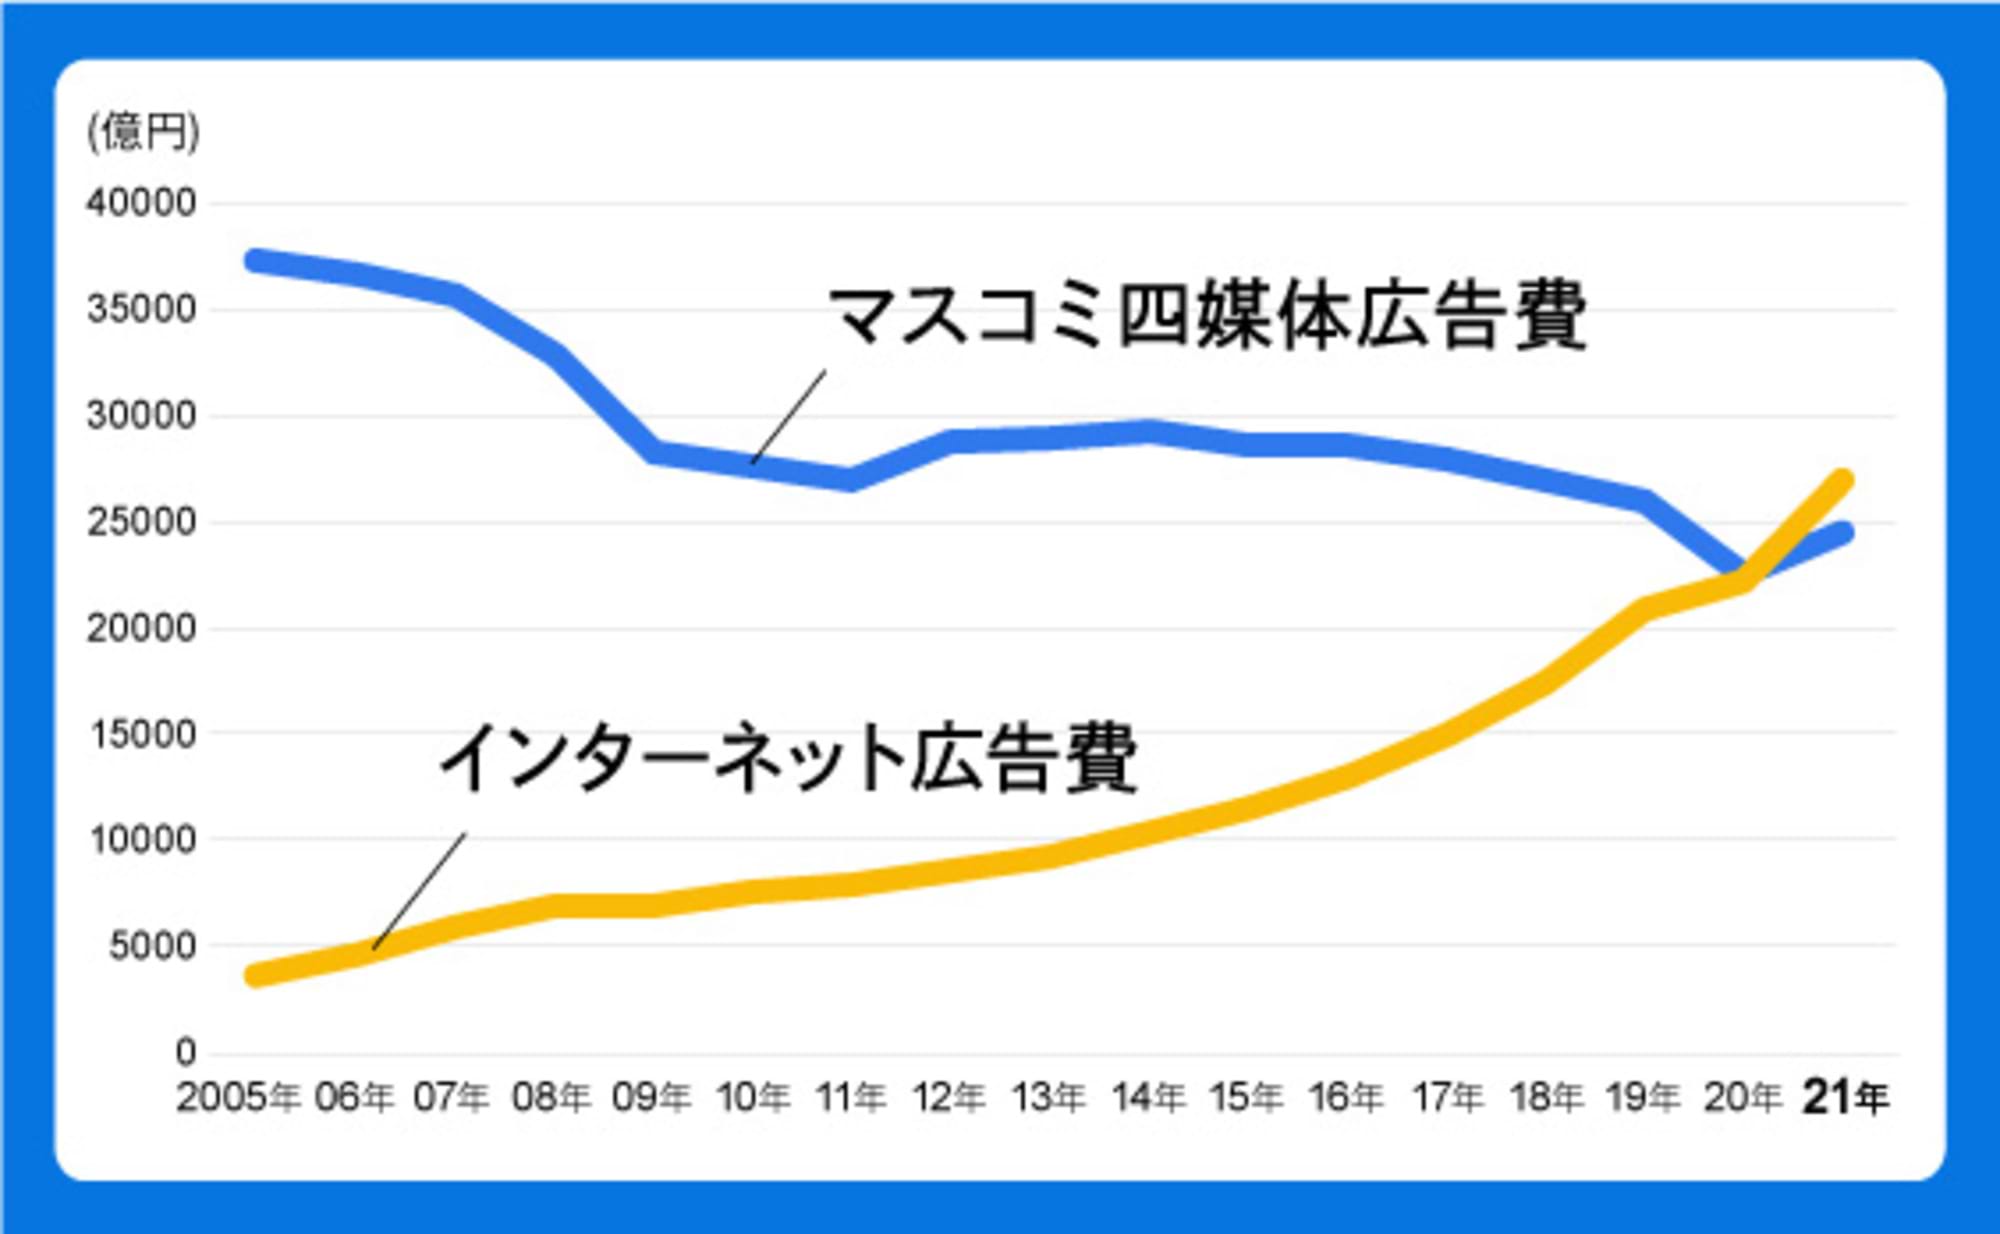
Looking at Japan's advertising expenditure in 2023, the overall trend has returned to pre-pandemic patterns: advertising spending on the four major media outlets has decreased, while internet advertising expenditure has increased. Within this, digital advertising spending originating from the four major media outlets continues to grow. This can be attributed to rising expectations for advertising effectiveness, driven by steady growth in internet video viewership, including free on-demand streaming services.
With COVID-19 reclassified as a Category 5 infectious disease, it remains to be seen how much of the significantly altered society of recent years will return to normal. Alongside the evolving nature of new media, this situation will likely require close monitoring for some time.
Details on "2023 Japan Advertising Expenditures" can be found here (Dentsu Inc. News Release).
"2023 Japan Advertising Expenditures" Booklet Report (PDF).
Related Articles:
Analysis of "2023 Internet Advertising Media Expenditures." Signs of Change in Video Advertising Breakdown
Interview with Nobuyuki Sakuma on the "Atmosphere" of Each Media. Special Discussion on "2023 Japan Advertising Expenditures"

Was this article helpful?
Share this article
Newsletter registration is here
We select and publish important news every day
For inquiries about this article
Back Numbers
2023/02/24
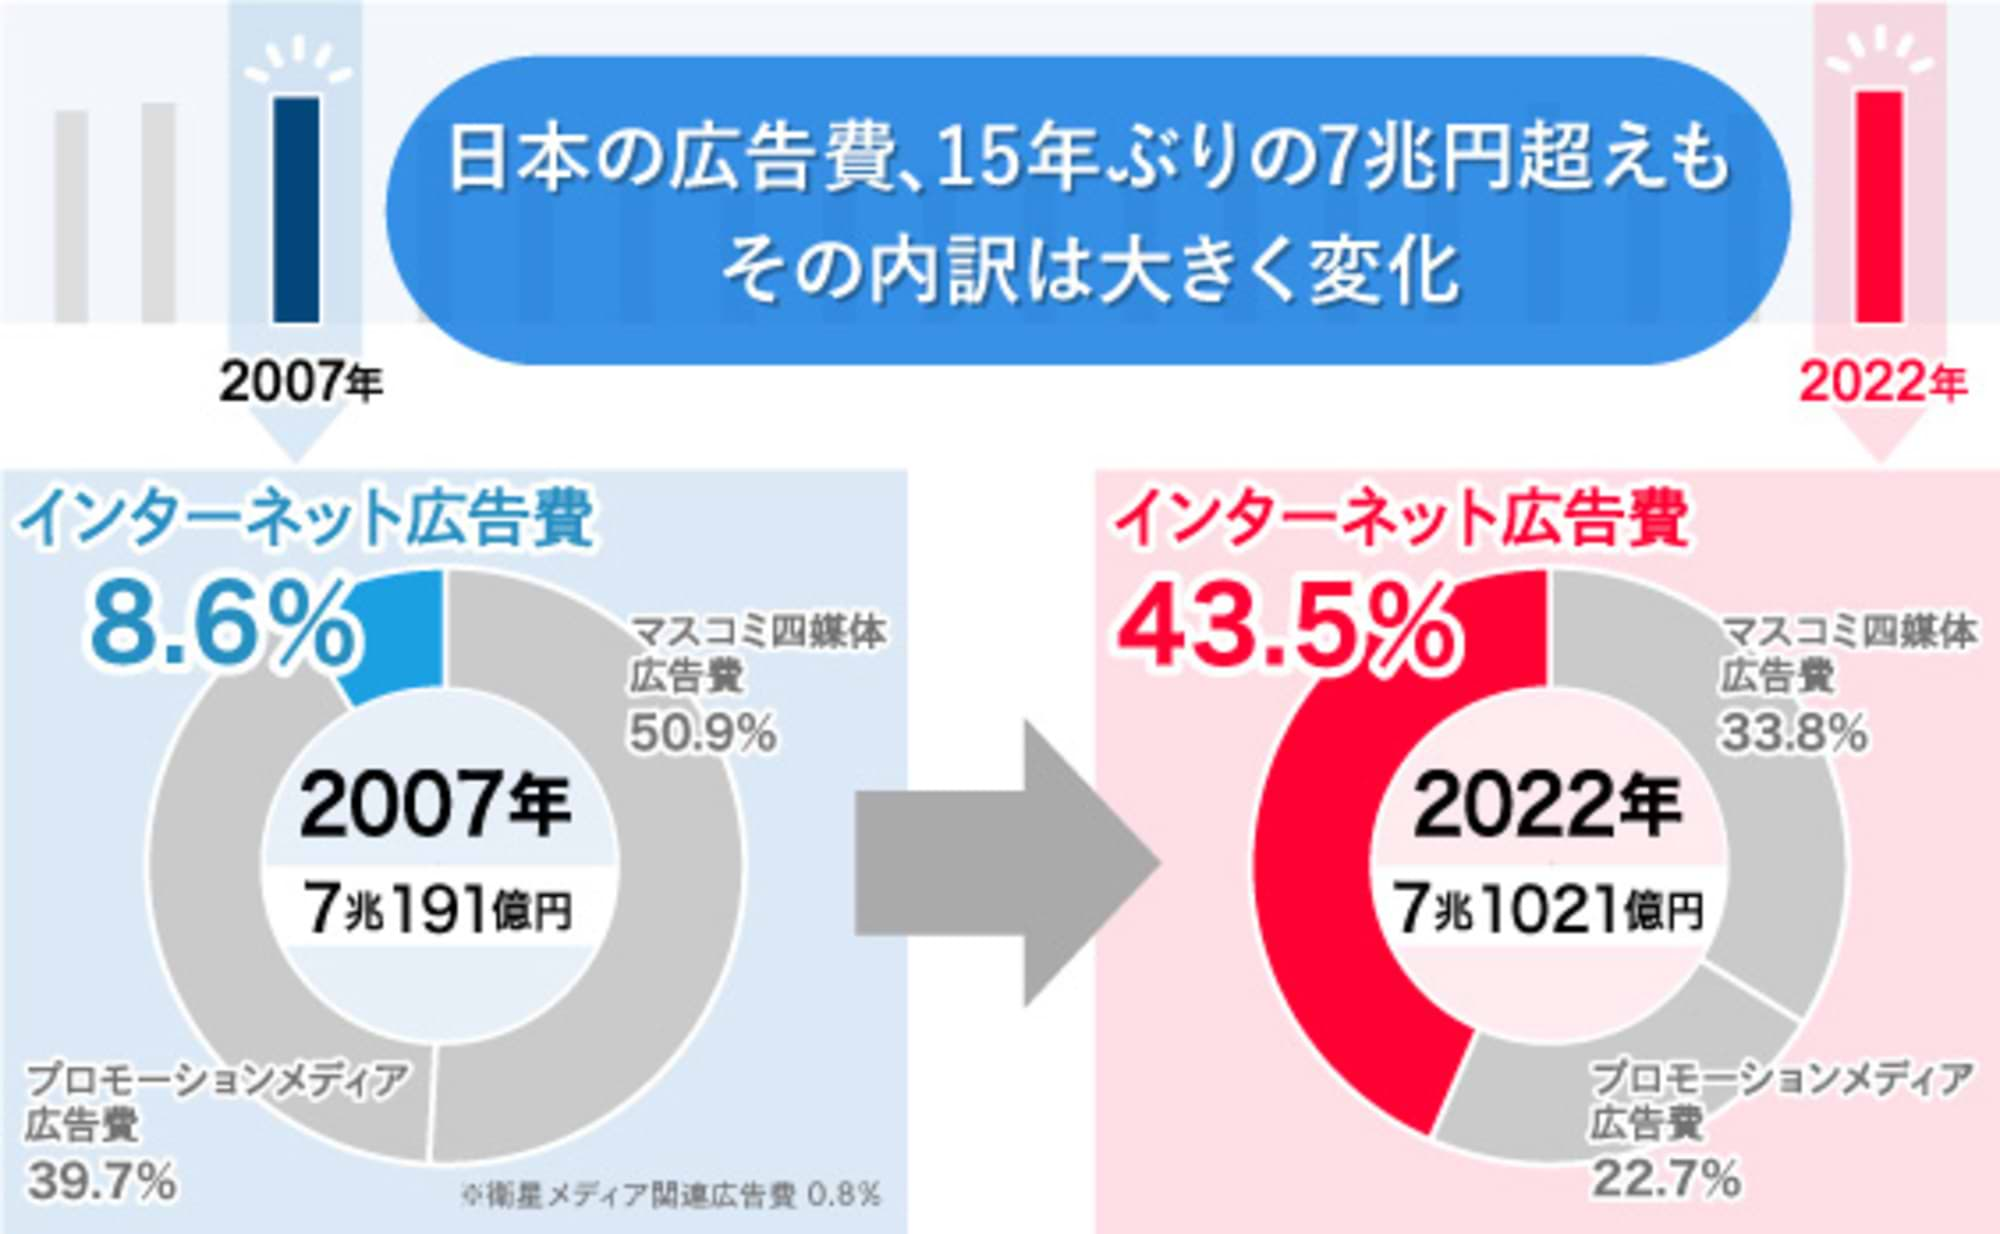
Analysis of "2022 Japan Advertising Expenditures" – Exceeding 7 Trillion Yen, the Highest in 15 Years. Internet Advertising Surpasses 3 Trillion Yen
2022/02/24
Analysis of "2021 Japan Advertising Expenditures" - Advertising Market Shows Significant Recovery. Internet Advertising Expenditures Surpass Total of Four Mass Media for the First Time
Author

Toshiyuki Kitahara
Dentsu Inc.
Dentsu Inc. Media Innovation Lab
Principal Researcher
After working in the Information Systems Department and the Management Planning Department, he joined the Research and Development Department. He has held his current position since 2011. Engaged in research on mass media and communication, consulting for media companies, organizational and personnel system consulting, and advertising and related market/industry trend research. Responsible for "Japan's Advertising Expenditures" in the 'Information Media White Paper'. Author of numerous books and papers, including 'Information Innovators: Leaders of the Co-Creation Society' (co-authored, 1999, Kodansha). Also engaged in various surveys and projects related to newspaper companies, primarily regional papers.
Articles by this person

What's the true intent behind the "Declaration to Quit Mass Media"? The current state of local media. Special Discussion: "Japan's Advertising Expenditures in 2024"
