Note: This website was automatically translated, so some terms or nuances may not be completely accurate.
Explanation of "2024 Japan Advertising Expenditures"──Third Consecutive Year of Record Highs. Mass Media Advertising Expenditures Grow for First Time in Three Years
On February 27, 2025, " 2024 Japan Advertising Expenditures " was announced. Rikichiro Morinaga of Dentsu Inc. Media Innovation Lab explains the changes in each advertising market: mass media, internet, and promotional media.

Want a quick overview? Check out the simple explanation here!
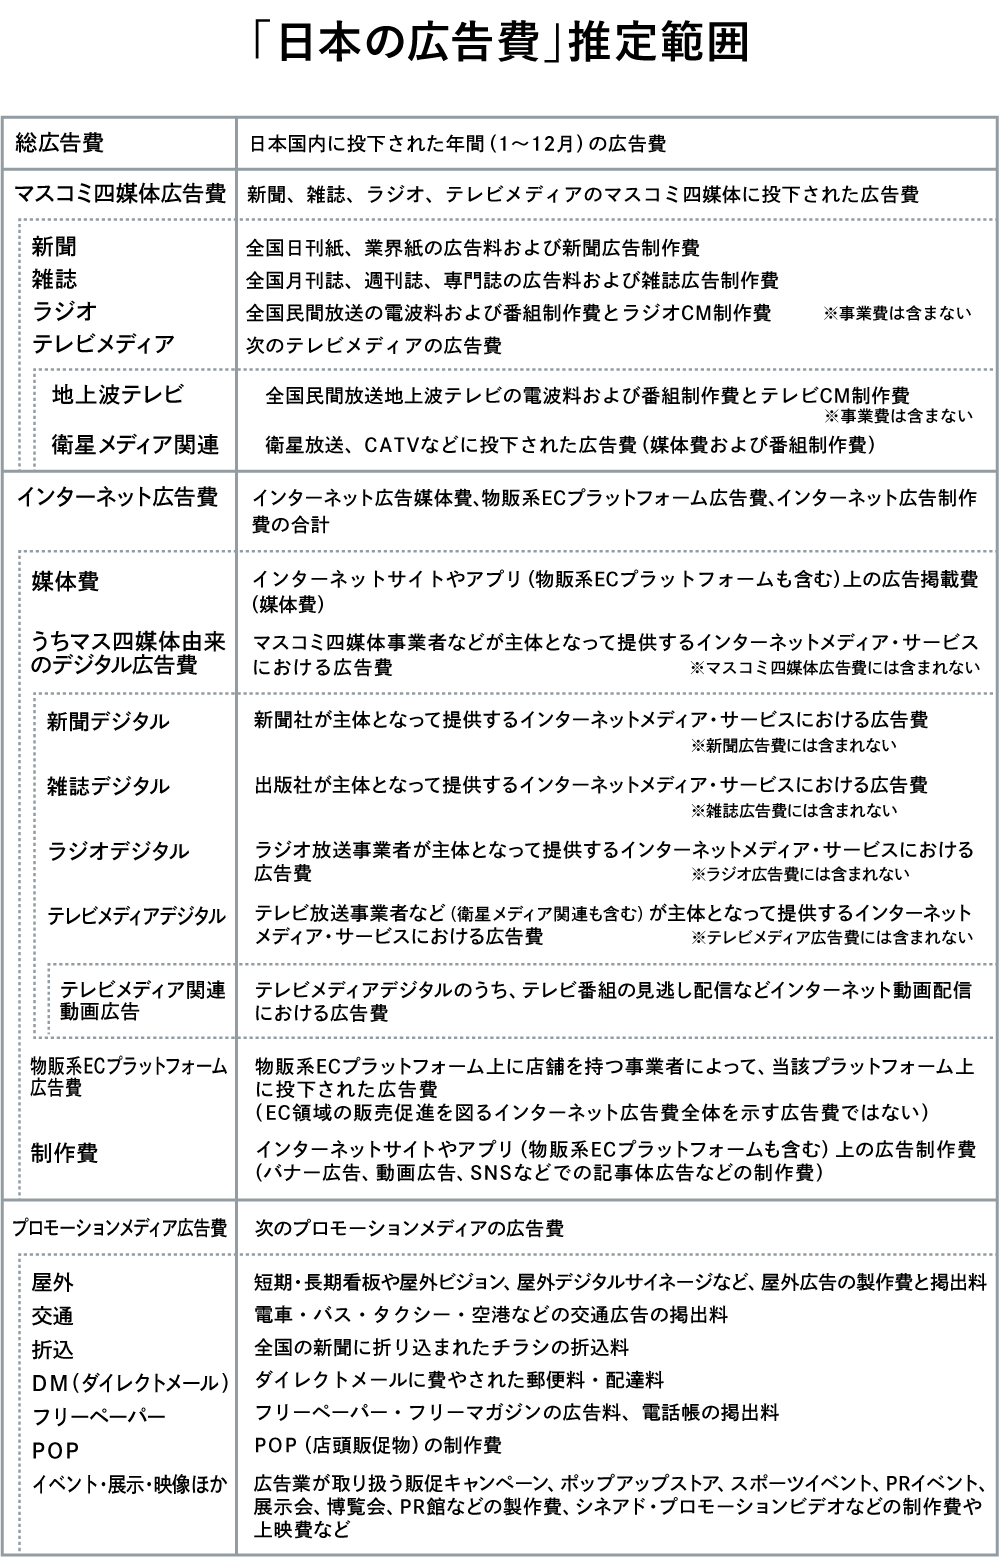
▼What is "Japan's Advertising Expenditures"?
▼ Three Key Points of "Japan's Advertising Expenditures 2024"
<Table of Contents>
▼Overview of "2024 Japan Advertising Expenditures"──Advertising Demand Expands Amid Strong Corporate Earnings
▼ "Mass Media Advertising Expenditures": Magazines, Radio, and TV Media Increase, Marking First Positive Growth in 3 Years
▼ "Internet Advertising Expenditures": Video ad demand surges further, driving significant growth
▼ "Promotional Media Advertising Expenditures": With foot traffic returning, transit advertising also shows recovery trends
▼Digital and non-digital convergence advances across sectors. Advertising utilization of "TV sets" shows an expanding trend
Overview of "2024 Japan Advertising Expenditures"──Advertising Demand Expands Amid Strong Corporate Earnings
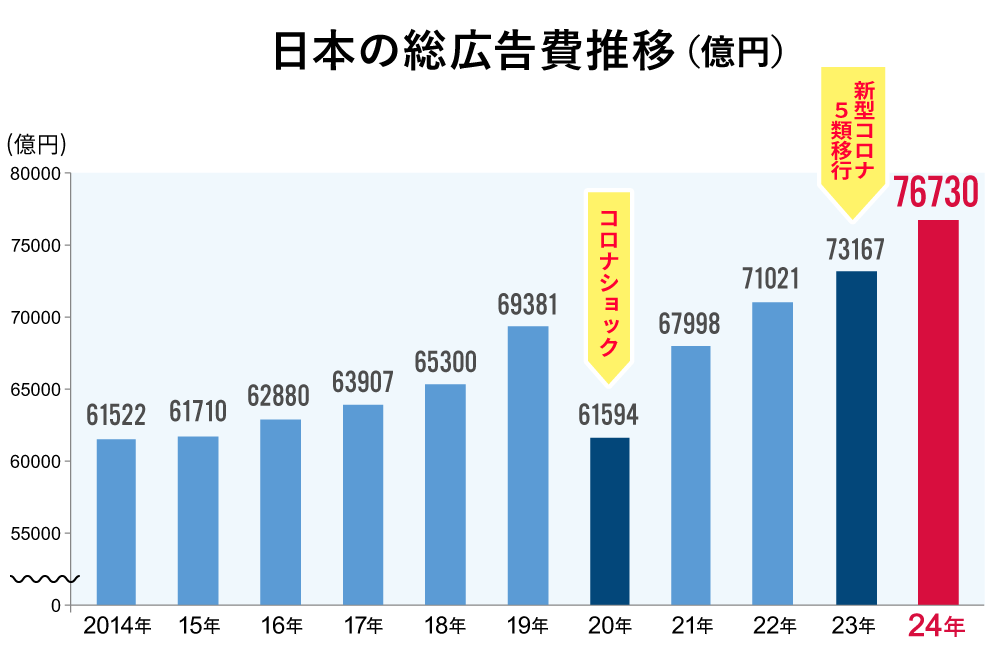
Japan's total advertising expenditure for 2024 (January-December) reached ¥7.673 trillion, a 4.9% increase year-on-year. This marks the fourth consecutive year of growth since 2021 and the third consecutive year of record highs since 2022.
This growth is underpinned by robust corporate earnings, driven by post-pandemic consumer enthusiasm, global events, and rising inbound demand. While the Noto Peninsula Earthquake early in 2024 and persistent inflation throughout the year had an impact, overall, the positive factors mentioned above prevailed.
Japan's advertising expenditure is broadly categorized into
- "Mass Media Advertising Expenditures"
- "Internet Advertising Expenditures"
- "Promotional Media Advertising Expenditures"
This year, all three categories—led by internet advertising, which continued its steady growth—saw increases. Notably, mass media advertising, which had been declining in recent years, also grew.
This year, all three categories grew, led by Internet advertising expenditure, which continued its steady increase. Particularly noteworthy is the shift to positive growth for mass media advertising expenditure, which had been trending downward in recent years.
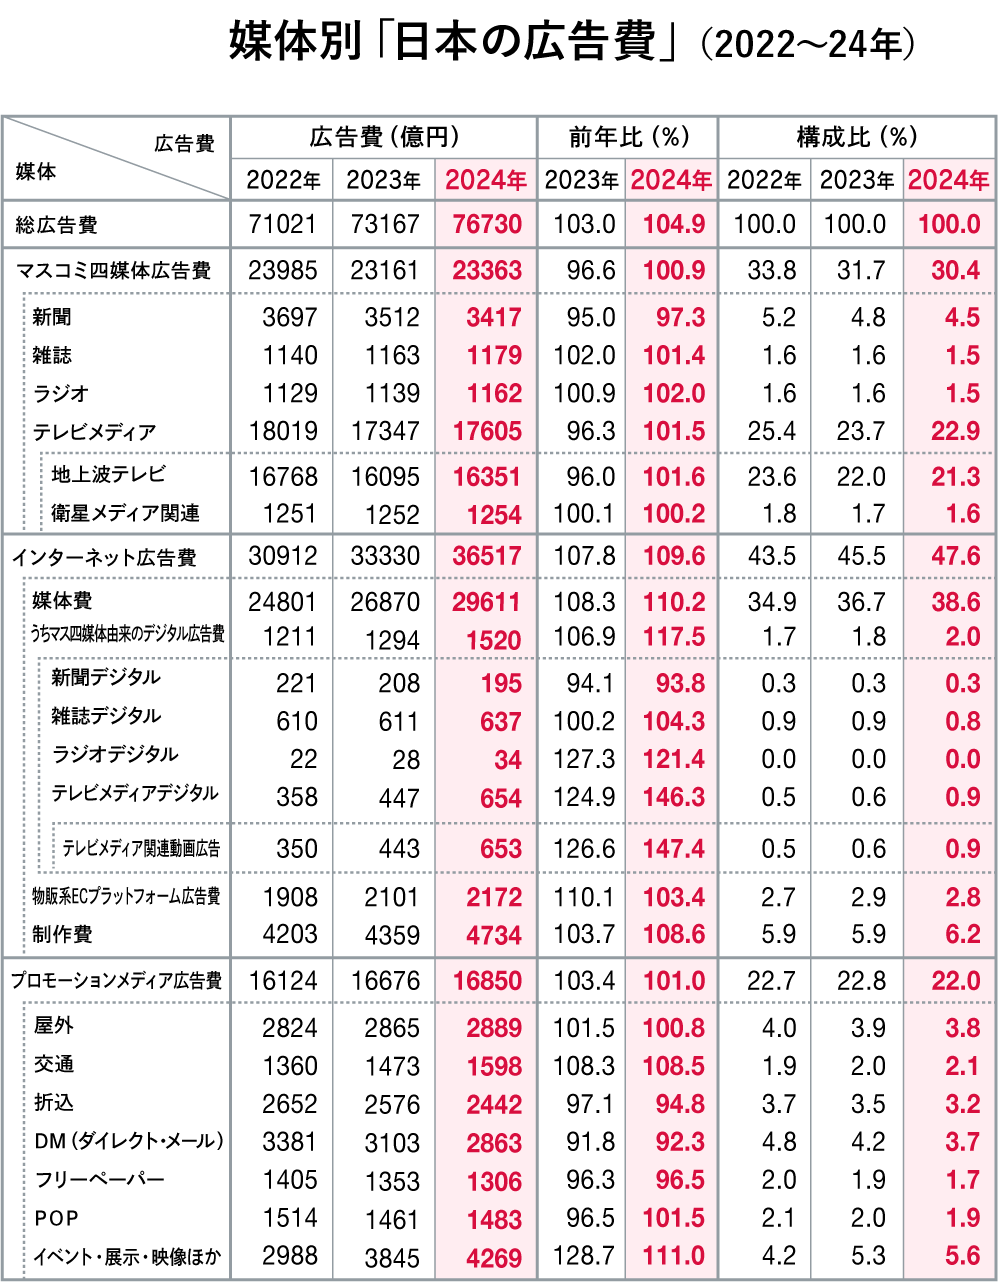
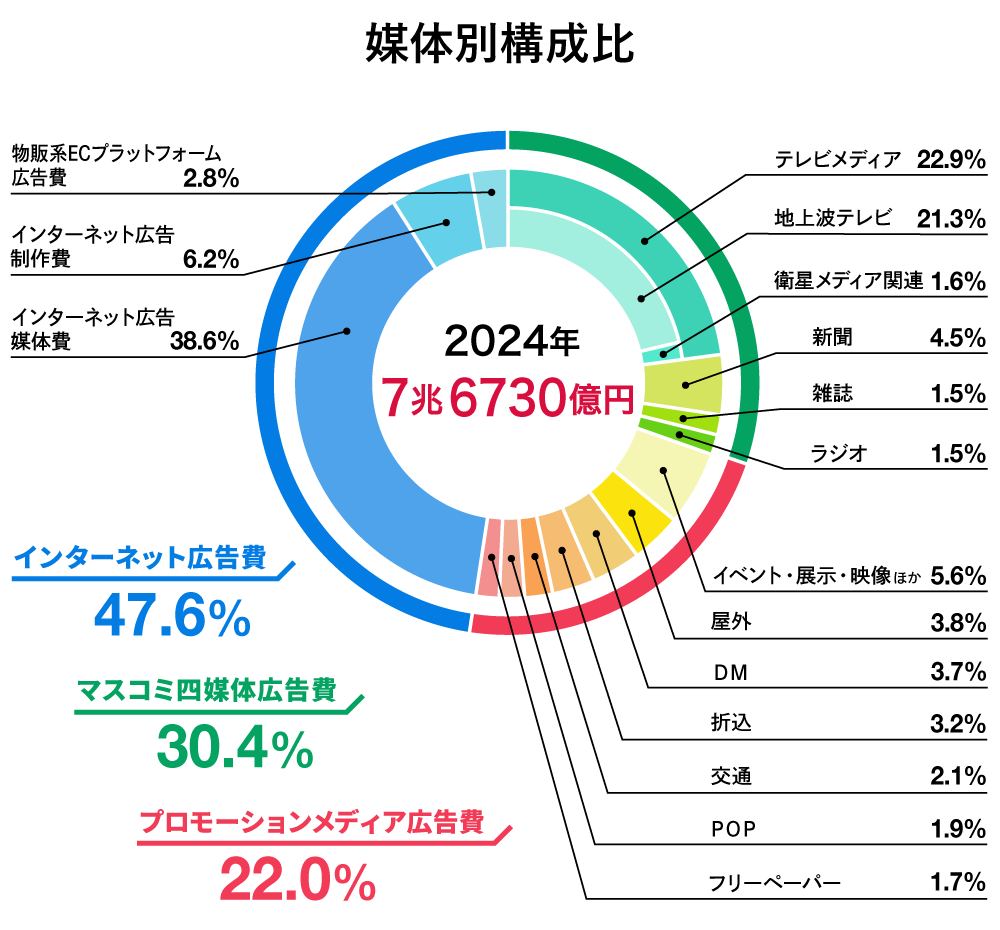
The respective shares of total advertising expenditure are: mass media 30.4%, internet 47.6%, and promotional media 22.0%.
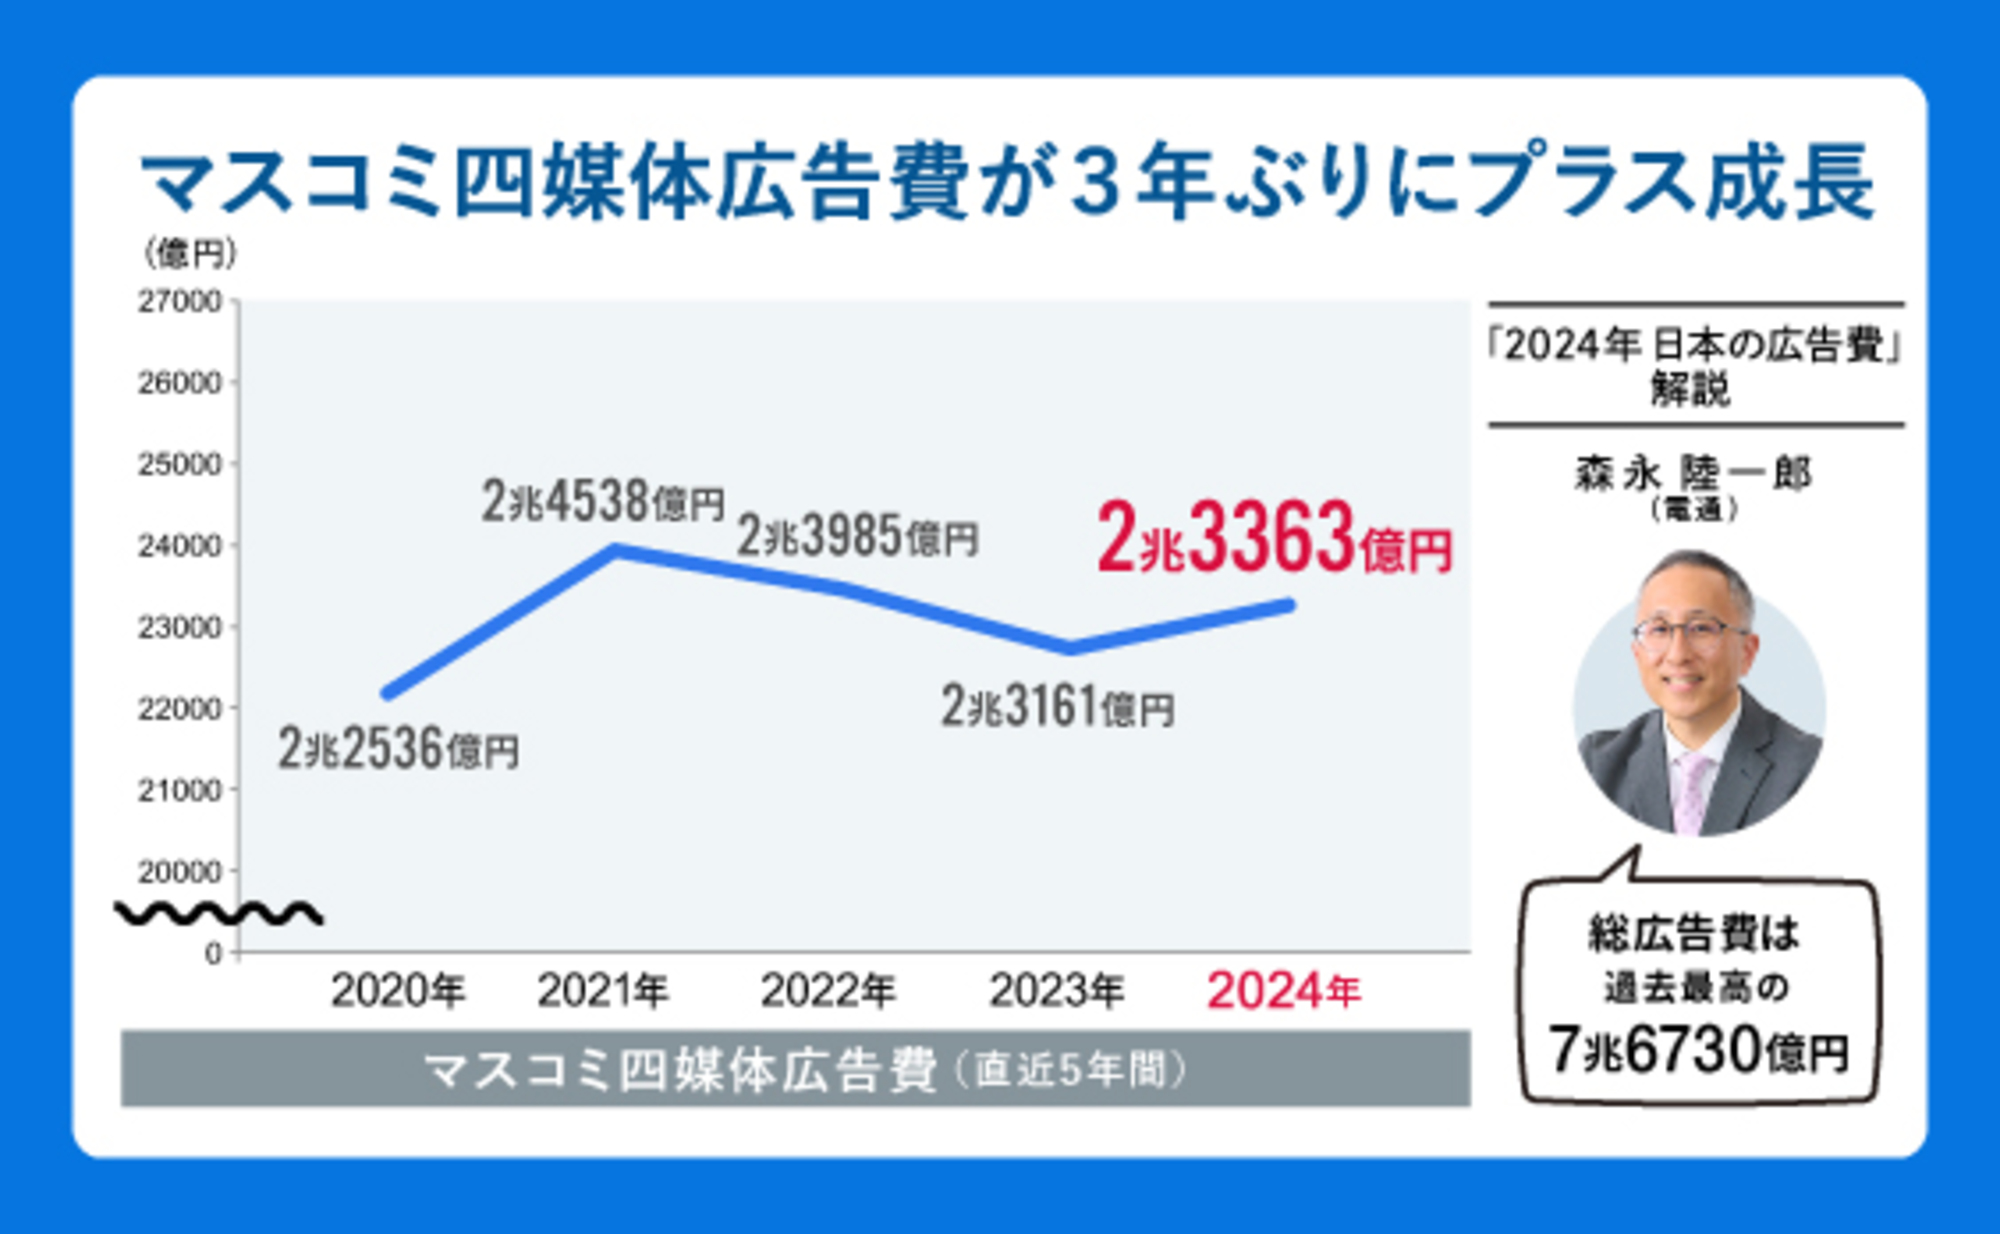
As mentioned earlier, a key feature of 2024 is that mass media advertising spending reached ¥2.3363 trillion, a 100.9% increase year-on-year, marking its first positive growth in three years.
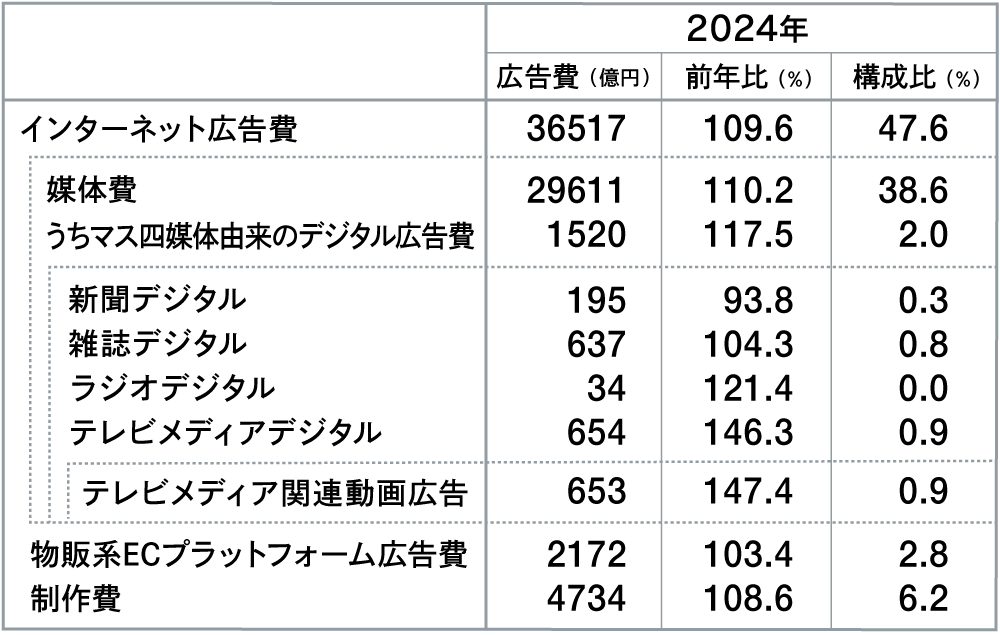
However, the pattern where internet advertising expenditure significantly drives overall advertising growth remains unchanged. Internet advertising expenditure increased by 109.6% year-on-year to 3.6517 trillion yen, an increase of 318.7 billion yen over the previous year.It now accounts for 47.6% of total advertising expenditure, approaching the 50% mark. Demand for video advertising continues to rise, fueled by the growing use of vertical video ads on social media and connected TVs (TVs connected to the internet).
Promotional media advertising expenditure reached ¥1.685 trillion. While this has not yet returned to the pre-pandemic level of over ¥2 trillion (¥2.2239 trillion in 2019), it grew by 101.0% year-on-year.
●Mass Media Advertising Expenditures
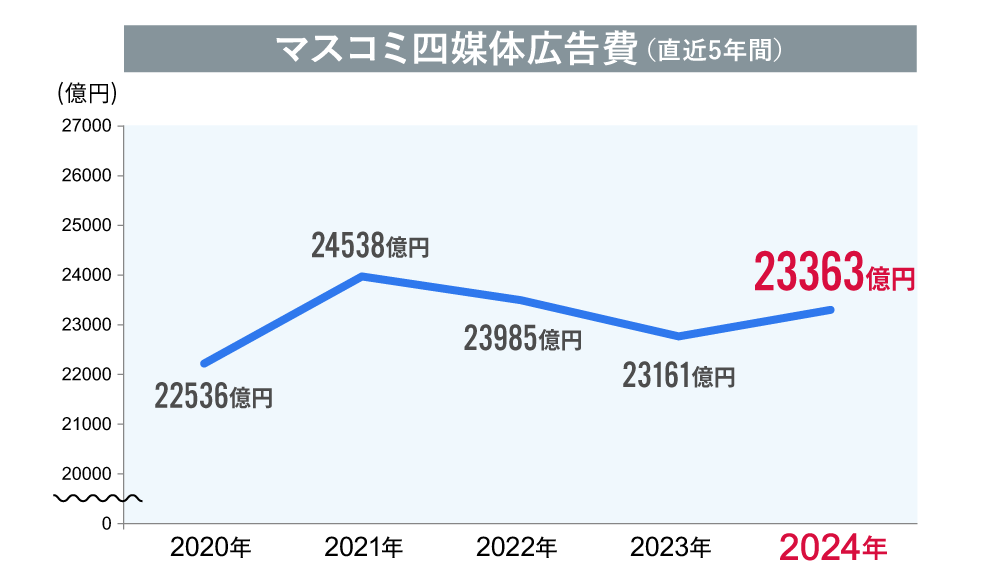
Advertising expenditure for the four major media outlets—newspapers, magazines, radio, and television—totaled ¥2.3363 trillion, a 0.9% increase year-on-year.
Year-on-year changes by medium were: newspapers 97.3%, magazines 101.4%, radio 102.0%, and television media (combining terrestrial and satellite) 101.5%. While newspaper advertising expenditure was the only category to decrease, advertising expenditure for magazines, radio, and television media increased. This marks the first time in three years that the total has exceeded the previous year's level.
●Internet Advertising Expenditures
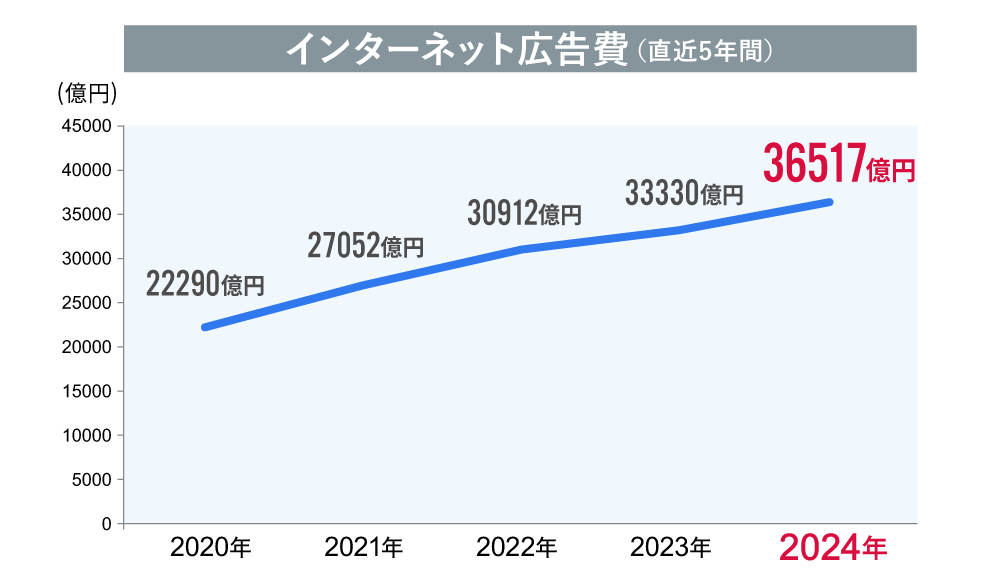
Internet advertising expenditure is the sum of "Internet advertising media fees," "Internet advertising production fees," and "E-commerce platform advertising fees for product sales." It reached ¥3.6517 trillion, a 109.6% year-on-year increase, continuing significant growth, particularly driven by video advertising demand. Notably, Internet advertising media fees saw double-digit growth at ¥2.9611 trillion (110.2% year-on-year).
One area we monitor annually is digital advertising spending originating from the four major media outlets. As discussed later, "TV media-related video advertising spending" stands at ¥65.3 billion (147.4% YoY), showing substantial growth following the strong performance in 2023.
Details on internet advertising media spending will be announced and explained separately in March, as is customary each year. We encourage you to stay tuned for this as well.
●Promotional Media Advertising Expenditures
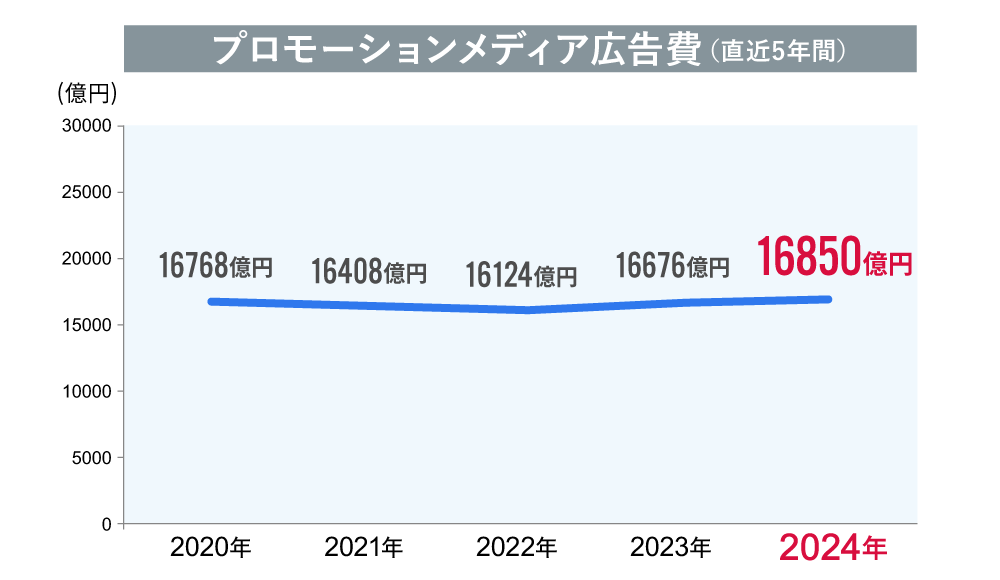
Advertising spending on media not classified as mass media or internet, such as outdoor and transit advertising, is estimated as promotion media advertising spending. This reached ¥1.685 trillion, a 101.0% increase year-on-year.
With foot traffic returning to pre-pandemic levels, growth was particularly noticeable in areas showing renewed vitality in physical settings, such as transit advertising, outdoor advertising, and POP displays. Furthermore, the "Events, Exhibitions, Video, etc." category also exceeded the previous year's figures due to an increase in event planning by overseas apparel brands, hotels, corporate PR facilities, and automotive-related stores.
Below, we provide a more detailed breakdown by category.
"Mass Media Advertising Expenditures": Magazines, radio, and television media increased, achieving positive growth for the first time in three years
●Mass Media Advertising Expenditures: Newspaper Advertising
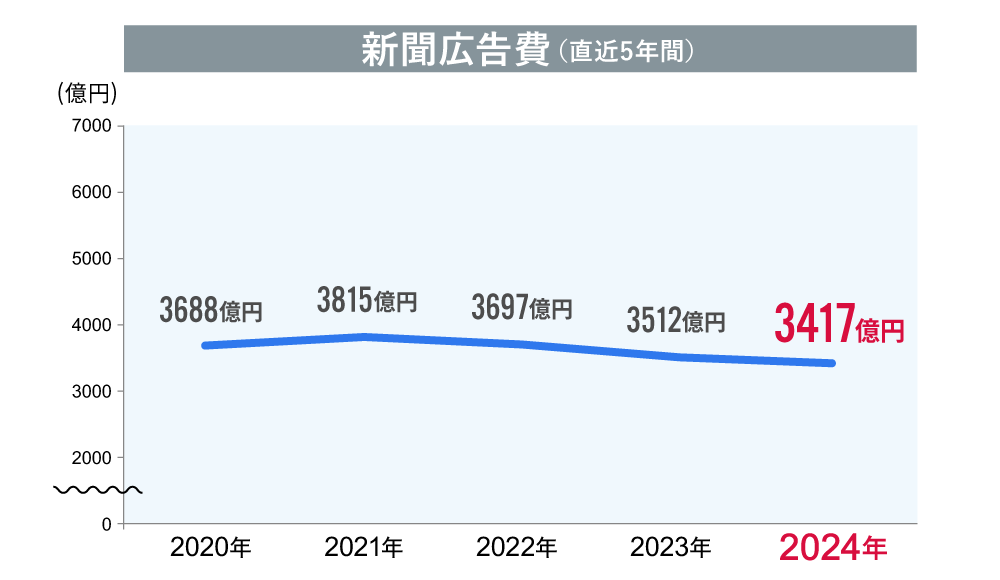
Newspaper advertising expenditure was ¥341.7 billion, representing 97.3% of the previous year's level. Newspaper advertising placements struggled to grow, impacted by declining circulation and rising prices.
In 2024, major sporting events like the Paris 2024 Olympics and Paralympics, along with the House of Representatives general election in October, led to increased election bulletin placements. However, this was not sufficient to significantly boost advertising spending.
However, by industry, distribution and retail saw a significant recovery, increasing to 106.9% of the previous year. On the other hand, while the transportation and leisure sector was expected to be robust due to recovery from the COVID-19 pandemic, it slightly decreased to 98.9% of the previous year.
●Advertising Expenditures Across Four Media Types〈Magazine Advertising Expenditures〉
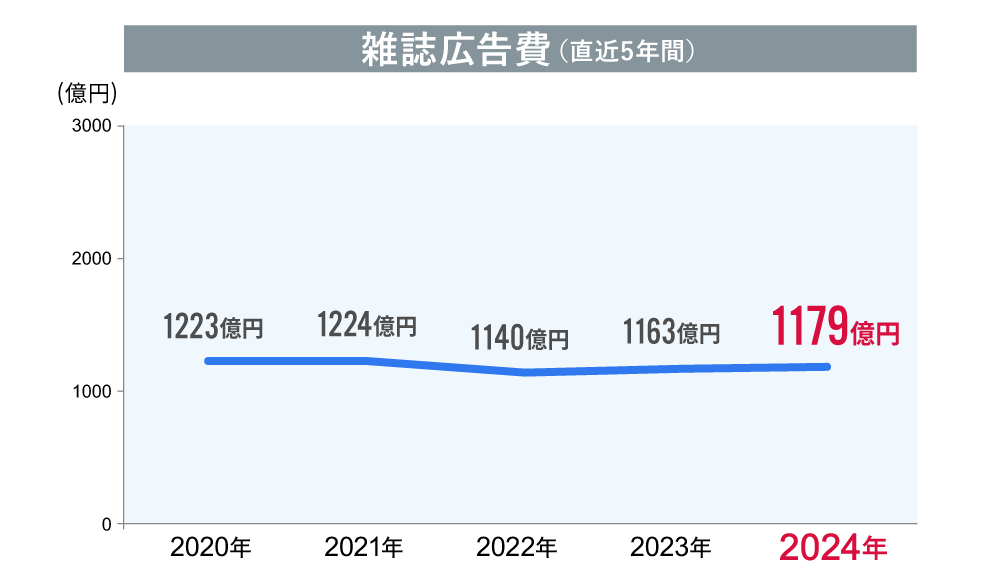
Magazine advertising spending increased to ¥117.9 billion, a 101.4% year-on-year increase, continuing the growth trend from last year.
Publishers are increasingly offering bundled proposals combining magazine advertising with digital initiatives, such as promotions utilizing SNS. They are also conducting sales promotions leveraging intellectual property (IP), like manga characters, in collaboration with media beyond magazines. These developments clearly show the expansion of initiatives that cannot be fully captured within the traditional framework of magazine advertising.
Particularly rapid in recent years is the integration of print and digital. For example, tie-in projects with magazines no longer conclude solely within the print pages; they often involve launching original websites or repurposing content for social media. While this trend isn't limited to magazines, it should be viewed within a broader context, including the "Digital Advertising Expenditures Originating from the Four Mass Media" discussed later.
Meanwhile, the publishing market itself continues to decline. The estimated sales value of paper publications in 2024 was 94.8% of the previous year (Source: Publishing Science Institute, "Quarterly Publishing Indicators," Winter 2025 issue). In contrast, the e-publishing market grew to 105.8% of the previous year, continuing its expansion. However, the overall publishing market, combining paper and digital, stood at 98.5% of the previous year, falling below the prior year's level.
By advertising industry, "Precision Equipment & Office Supplies" and "Beverages & Luxury Goods" saw growth. Conversely, "Fashion & Accessories" and "Cosmetics & Toiletries," which hold high shares of magazine advertising spending, declined.
●Mass Media Advertising Expenditures: Radio Advertising
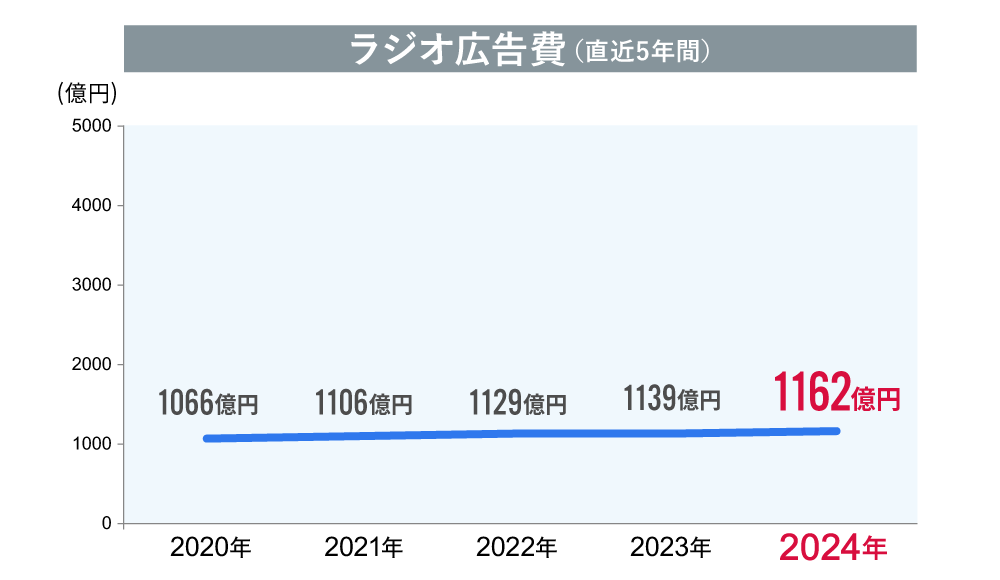
Radio advertising expenditure exceeded the previous year for the full year, reaching ¥116.2 billion, a 102.0% increase year-on-year. Among the four major media, this category remained relatively resilient during the COVID-19 pandemic and has shown a gradual upward trend over the past few years.
Similar to other categories, there has been increased activity in collaborative projects with digital media, such as "audio ads" on podcasts and other audio platforms. Furthermore, broadcast revenue itself has also seen growth. Podcasts are a system allowing users to stream or download programs from various audio media platforms. Since the audience engaging with "radio programs and radio ads" through non-traditional broadcast formats like podcasts tends to be younger, more advertisers are seeking to leverage this appeal to that demographic.
By advertising sector, "Food" (up 117.8% year-on-year), heavily used by health food mail-order companies, and "Transportation/Leisure" (up 116.6% year-on-year) both saw double-digit growth, showing significant expansion.
●Advertising Expenditures Across Four Mass Media Platforms〈TV Media Advertising Expenditures〉
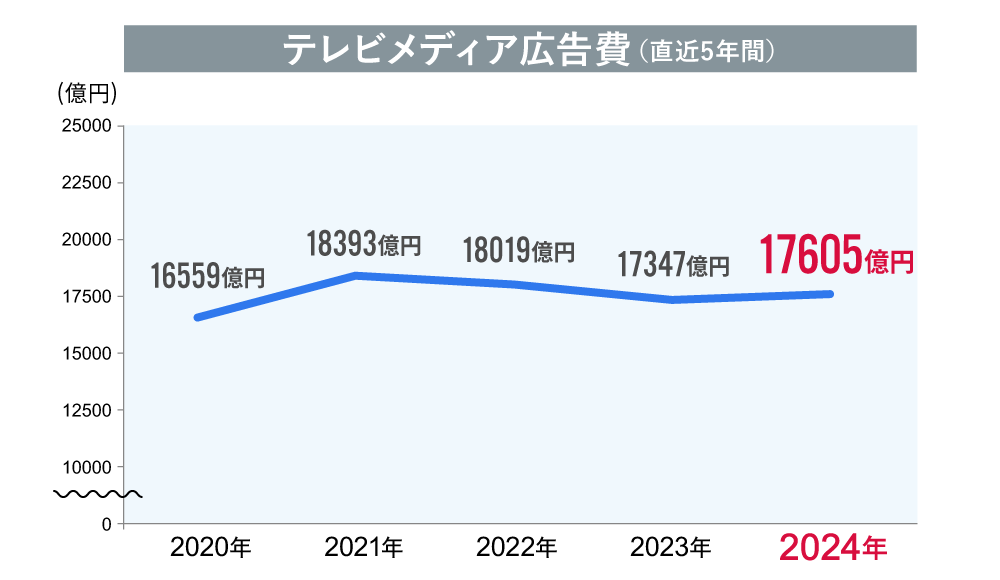
Television media advertising expenditure (terrestrial TV + satellite media-related) reached ¥1,760.5 billion, a 101.5% increase year-on-year, marking positive growth for the first time in three years. Terrestrial TV alone accounted for ¥1,635.1 billion, a 101.6% increase year-on-year.
Spot advertising spending, buoyed by robust corporate earnings, drove the growth in TV media advertising. Notably, brand advertising by B2B companies stood out, a point covered in the summary of this article.
Conversely, program (time) advertising spending ultimately fell below the previous year's level, despite major events like the Paris 2024 Olympics and Paralympics. Compared to earlier periods, the gap in viewer numbers between programs has widened, leading to an overall contraction trend.
By industry, "Automobiles & Related Products" recovered, aided by the easing of semiconductor shortages. "Pharmaceuticals & Medical Supplies," "Cosmetics & Toiletries," and "Transportation & Leisure" also performed well, with the latter continuing to benefit from high demand for outings and leisure activities as the pandemic recovery continued.
Satellite media-related advertising exceeded the previous year, driven by steady performance in BS and CS home shopping programs. However, CS and CATV continue to show a gradual decline.
Internet Advertising Expenditures: Video Advertising Demand Further Increases, Leading to Significant Growth
Internet advertising expenditure, which continues to strongly drive Japan's advertising spending, reached 3.6517 trillion yen, setting a new record high this year. Media fees alone accounted for 2.9611 trillion yen, representing double-digit growth at 110.2% year-on-year.
A major trend in recent years has been the exceptionally strong performance of video advertising. This includes both "in-stream ads" that play between video content on video-sharing sites and "out-stream ads" displayed on social media timelines and websites. Demand for vertical video ads on social platforms, in particular, surged, driving significant growth in figures.
● Digital Advertising Spending Originating from the Four Major Media
Amidst the continued decline in advertising spending across the four major media outlets, Dentsu Inc.'s survey also highlights the so-called "digital advertising spending originating from the four major media outlets" as an area of annual focus. This segment expanded to ¥152 billion, a 117.5% increase year-on-year.
This category includes program distribution services by TV and radio stations, digital editions of newspapers provided by publishers, and magazine websites operated by publishers.
Such digital advertising originating from the four major media outlets is not counted as advertising expenditure for the four major media outlets themselves, but rather as part of internet advertising media expenditure.
● Newspaper Digital Advertising Expenditures
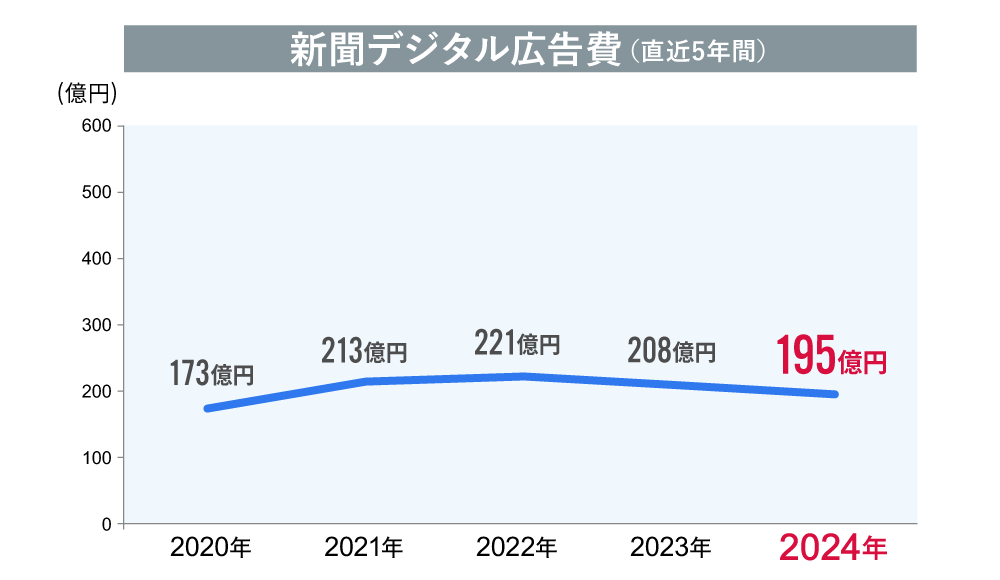
"Newspaper digital" saw a significant impact from declining advertising rates, resulting in a year-on-year decrease to 93.8%. However, reserved advertising showed signs of recovery through tie-up advertising, and there was an increase in "planned" advertising placements such as online seminars.
●Magazine Digital Advertising Expenditures
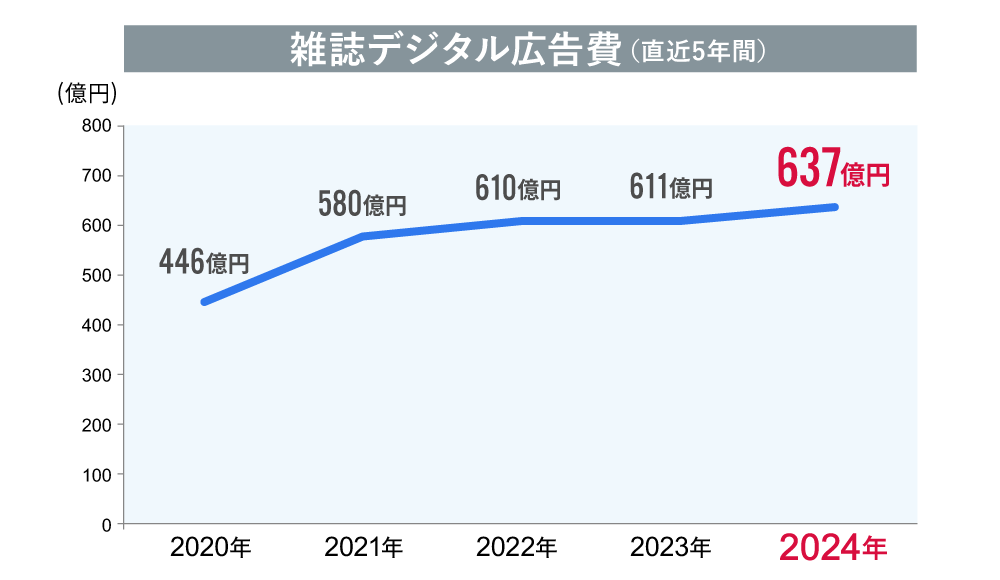
"Magazine Digital" performed well, growing to 104.3% year-on-year.
As mentioned in the "Magazine Advertising Spending" section for the four mass media categories, it is important to note that publishers' handling of digital advertising is increasingly difficult to categorize simply as "magazines versus the internet."
In recent years, magazine media suspensions and changes in publication formats have driven web media revamps and increased resource allocation to SNS accounts. These efforts, particularly the expansion of content on SNS, have sustained steady growth in follower counts. Some magazines are now initiating advertising projects that exist entirely within SNS communities, such as product development and event planning within these communities.
Additionally, there is a notable increase in initiatives leveraging publishers' strengths—namely, "content production capabilities" and "community building power"—such as producing advertiser-owned content and creating/distributing video content.
● Radio Digital Advertising Expenditures
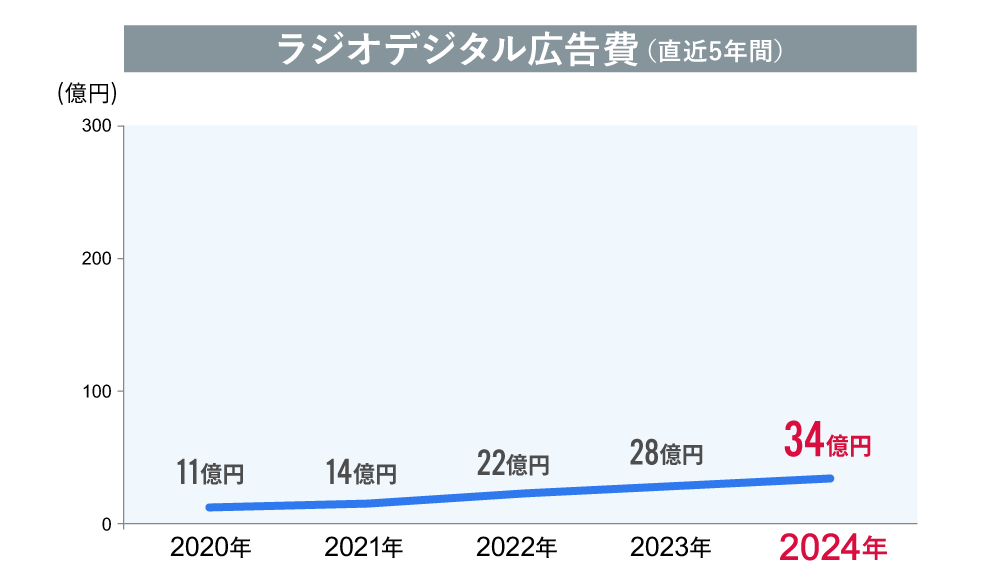
Radio digital advertising spending reached ¥3.4 billion, a 121.4% increase year-on-year, showing steady growth. Demand for radio digital advertising, including radiko, continues to rise steadily, following the previous year's trend.
Radio programs are not limited to broadcast and radiko; their digital expansion through audio media, including podcasts, continues to attract significant attention. It is believed that many people now enjoy content (radio programs) through audio media such as podcasts.
● Television Media Digital Advertising Expenditures
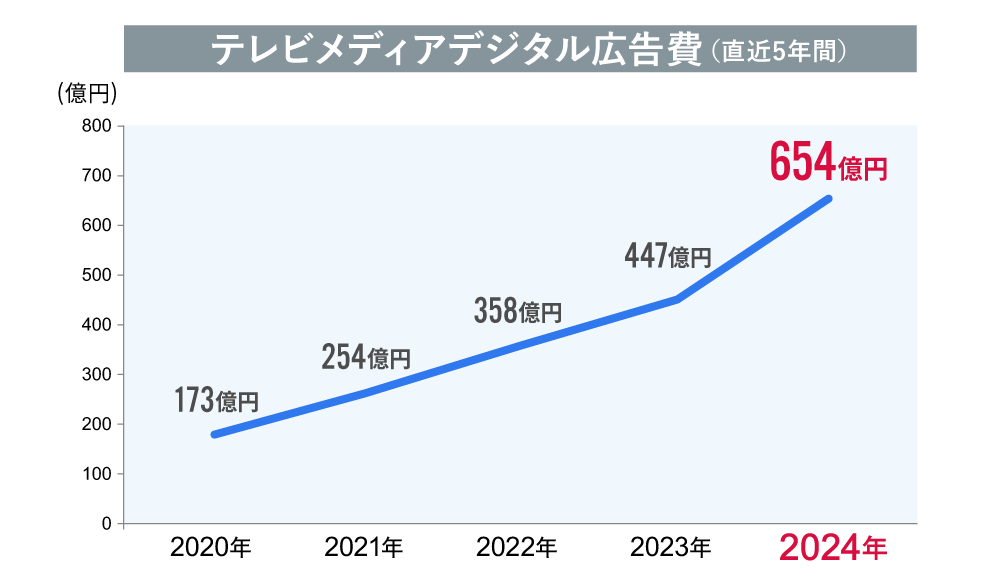
"TV Media Digital" saw a remarkably large increase, reaching 65.4 billion yen, a 146.3% increase year-on-year. As evident even from just the growth over the past five years, this is a category expected to grow, riding the tailwind of the overall video shift on the internet.
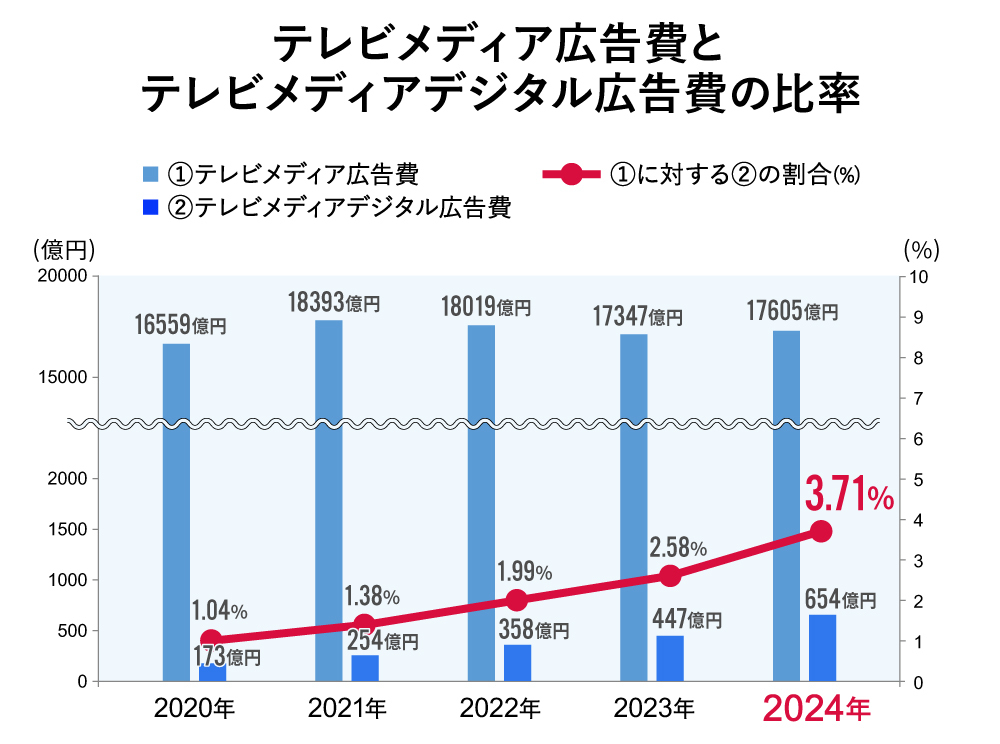
Within this, "TV Media-Related Video Advertising" accounted for the majority at ¥65.3 billion. "TV Media-Related Video Advertising" refers to advertising spending primarily on internet video distribution by TV broadcasters, such as free catch-up streaming services for TV programs.
These catch-up streaming services, primarily funded by TV stations, offer not only missed terrestrial broadcasts but also popular content like the fastest-released anime and original dating reality shows. Furthermore, during major events like sports, "co-viewing" on large screens like connected TVs increases, boosting advertising value. We'll revisit this point later.
●Merchandise-Based E-Commerce Platforms
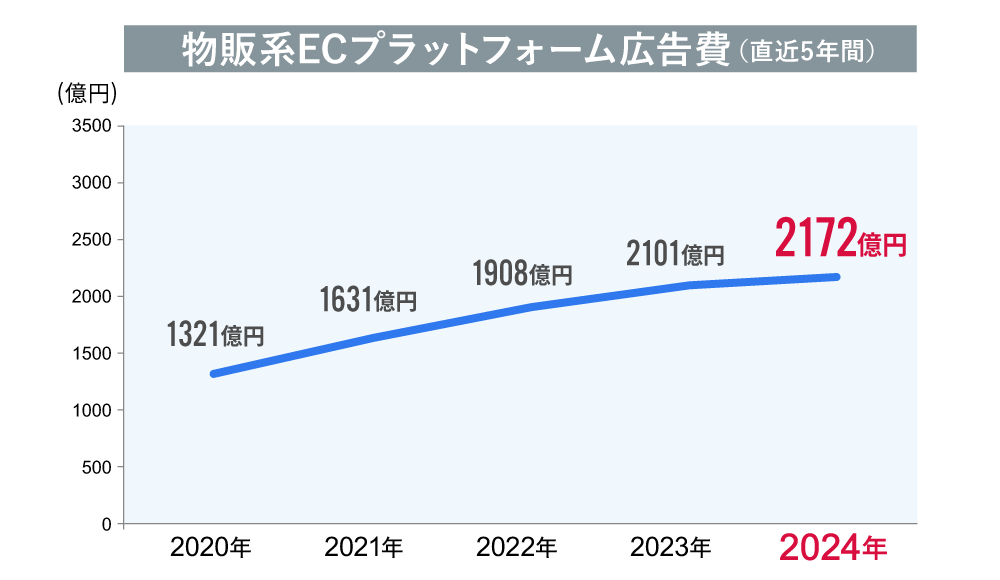
Advertising spending on merchandise-based e-commerce platforms remained steady at ¥217.2 billion, a 3.4% increase year-on-year. However, this growth rate is somewhat slower compared to previous years. This is likely because online shopping, which saw a surge in demand during the pandemic, has become a "daily routine" and established itself for many people.
Regarding the term "merchandise-based e-commerce platform advertising expenditure": In "Japan's Advertising Expenditure," e-commerce platforms selling goods such as home appliances, sundries, books, clothing, and office supplies are termed "merchandise-based e-commerce platforms." "Merchandise-based e-commerce platform advertising expenditure" is defined as the advertising budget invested within these platforms by businesses that have "opened shops" on them.
For example, "PR" products that appear prominently in search results within an e-commerce platform are included in this advertising expenditure. Conversely, advertising expenditure placed outside the platform, utilizing data from the platform for targeting, is not included.
●Internet Advertising Production Costs
Internet advertising production costs have grown steadily, reaching 108.6% of the previous year's level, similar to media costs. The significant annual increase in demand for video advertising is driving this growth in production costs.
Currently, "rich content"—high-budget video production—has become mainstream. At the same time, demand is growing for producing large volumes of videos in quick cycles, such as short-form vertical videos often called "short videos." Additionally, there are emerging cases where video assets created for internet advertising are also being used for television commercials.
For details, please await the explanation of internet advertising spending to be released in March.
"Promotional Media Advertising Expenditures": Foot traffic returns, transit advertising shows recovery trend
Promotional media advertising expenditure, which had declined due to COVID-19 restrictions on going out, turned positive in 2023, the year COVID-19 was reclassified as a Category 5 infectious disease, led by "events, exhibitions, video, etc." In the following year, 2024, it exceeded the previous year, reaching 1.685 trillion yen, a 101.0% increase year-on-year.
While still far from pre-pandemic levels, it is returning to a growth trajectory.
●Promotional Media Advertising Expenditures (Outdoor Advertising, Transportation Advertising)
Outdoor advertising (OOH) grew slightly year-on-year to ¥288.9 billion (100.8% of the previous year). It was utilized across various industries, particularly in urban areas, including luxury brands, beverages, content, and recruitment.
Additionally, increased inbound demand and revitalized consumer spending have spurred advertising activity in transportation and leisure-related sectors. Demand rose for large-scale boards installed in high-traffic commercial districts for short-term signage.
High-visibility outdoor digital displays were heavily utilized in major metropolitan areas like the Kanto region (Shibuya, Shinjuku, Omotesando), Osaka, Sapporo, Nagoya, and Fukuoka, with selling prices also rising.
Digital OOH, which has seen significant evolution in recent years, is expanding its usage as a medium capable of data-driven planning and ad delivery.
*Related Series:OOH Beyond the Pandemic - A DX-Based Perspective
While remote work became widespread during the pandemic, the subsequent return to office-based work at many companies has contributed to an increase in transit advertising, reaching ¥159.8 billion, a 108.5% increase year-on-year. A notable feature for 2024 is the particularly high demand for advertising inside trains. In metropolitan areas, "station takeover" style advertising, which uses large-scale signage and billboards to transform stations themselves into media platforms, was also widely utilized.
Airports saw a recovery, primarily driven by digital signage, as many advertisers placed ads. This was fueled by rising inbound demand and the recovery of outbound travel within Japan.
Conversely, taxi interior advertising declined. While this category saw increased B2B corporate advertising in recent years due to more taxi companies installing digital displays, it is presumed that these companies have achieved sufficient brand awareness and are now adjusting their advertising volume.
●Promotional Media Advertising Expenditures (Newspaper Inserts, DM (Direct Mail))
Newspaper insert advertising, like newspaper advertising itself, decreased to ¥244.2 billion, a 94.8% year-on-year figure. This is also thought to be linked to declining newspaper circulation.
On the other hand, advertising from food supermarkets, electronics retailers, and family restaurants has increased. Rising prices have heightened thriftiness, boosting demand for coupons in insert ads.
A notable feature in 2024 was the robust performance of resellers, leading to increased flyer placements. Additionally, placements surged in October due to the House of Representatives general election.
Direct mail (DM) decreased to ¥286.3 billion, representing 92.3% of the previous year's level. This decline was influenced by rising printing material and production costs, as well as the October 2024 postal rate revision.
However, DM is increasingly used not as a standalone measure but as part of data marketing. With the advancement of DX (Digital Transformation), DM has shifted from traditional mass-mailing to being used only for high-impact DM targeting purchasing decisions, leading to a trend of reduced mailing volumes. Including related costs like production fees and data marketing, the market remains substantial and is considered robust.
Demand for unaddressed DMs posted to specific areas is growing, particularly in sectors like real estate.
●Promotional Media Advertising Expenditures 〈Free Papers〉
Free paper advertising expenditure decreased to ¥130.6 billion, representing 96.5% of the previous year's level. However, demand for locally focused free papers remains high, with numerous examples of their use as media for regional revitalization.
Another characteristic of 2024 is the emergence of free papers targeting highly specific demographics (e.g., affluent consumers).
Furthermore, printing companies are actively utilizing free papers, and proposal-based initiatives that bundle them with marketing strategies to secure advertising placements are beginning to take root. Here too, we see an increase in composite advertising projects that integrate digital initiatives rather than standalone free paper campaigns, making it difficult to gauge the full impact based solely on individual figures.
●Promotional Media Advertising Expenditures (POP)
POP advertising used at retail store locations reached ¥148.3 billion, a 101.5% increase year-on-year. This figure is limited to traditional physical POP materials. It also includes experiential sales areas and pop-up stores.
Since the pandemic, demand has grown for real-world communication between companies and consumers, such as in-store initiatives at physical locations. Collaborative campaigns featuring IP like manga, anime, and movie characters are thriving here, significantly boosting sales.
Amid this high demand for "real experiences," coupled with the impact of rising material costs, advertising expenditure on POP increased.
●Promotional Media Advertising Expenditures (Events, Exhibitions, Video, etc.)
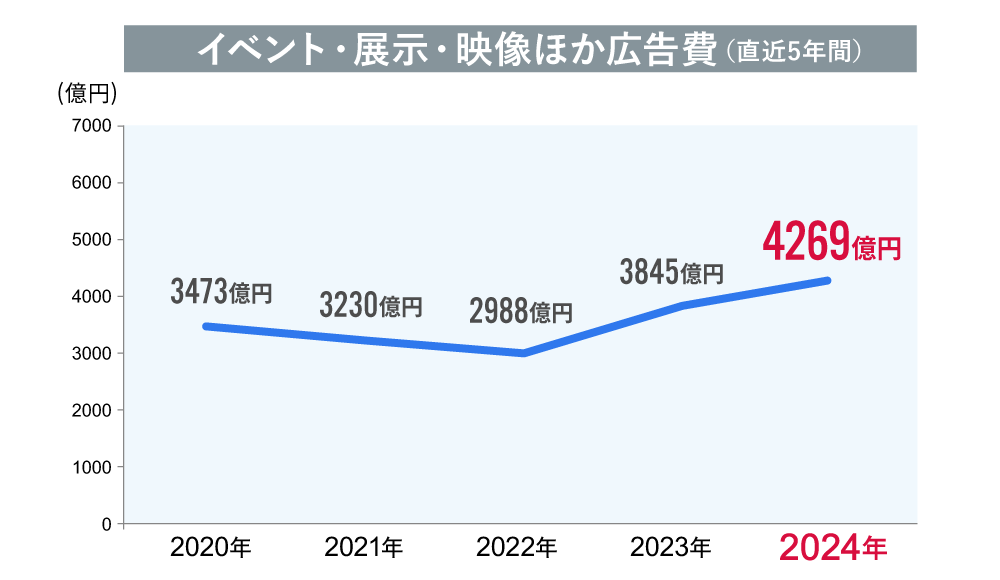
This category grew to ¥426.9 billion, a 111.0% increase year-on-year. While the category recovered significantly after the pandemic, the event segment alone saw a decline to ¥165.6 billion (97.2% of the previous year). This is likely due to a slight decrease in major events compared to 2023. However, private events hosted by companies and product brands have become more active.
The exhibition segment expanded, driven by continued large-scale investments in theme parks, as well as renovations and refurbishments by overseas apparel brands, hotels, and automotive retailers.
Promotional video-related spending increased mainly due to more streaming videos accompanying online exhibitions, web conferences, and seminars. Educational entertainment-related spending also showed an expansion trend.
Finally, regarding cinema advertising, the release of many popular films, particularly Japanese animated films, led to an increase over the previous year. Conversely, foreign films did not see any major hits.
Digital and non-digital convergence is advancing across various sectors. Advertising utilization of "television sets" is expanding.
As mentioned at the outset, a defining feature of 2024 was the first positive growth in mass media advertising spending in three years. The primary driver was increased TV spot advertising.
Automotive and beverage sectors were particularly impacted, but spot ads from energy, materials, and machinery manufacturers also increased significantly. Since many companies in these sectors are B2B, they are generally unknown to the public. These ads are likely branding efforts aimed at recruitment and raising general awareness. We also believe there is a strategy to reach middle-aged and older demographics—the parents of new graduates—to position the companies as potential employers for their children.
While performance-based digital advertising continues to drive Japan's advertising spending, decades after digital advertising began, a conscious differentiation in usage has become established. For instance, TV commercials are now commonly used for branding targeting middle-aged and older demographics. However, the simple formula of "online = conversion, TV = branding" is no longer holding true.
Traditional TV's strengths included large screens and the potential for multiple viewers to watch together. Against this backdrop, the proliferation of internet-connected TVs, or "Connected TVs," in households has increased opportunities to "watch internet videos on TV." Consequently, branding ad placements on internet video-sharing sites are also growing.
※Web Dentsu-ho News "Connected TV" related articles
Considering this situation, it seems likely that for users, the categories of "terrestrial broadcast
Given this situation, it seems likely that for "ads appearing on large screens," categories like "terrestrial broadcast," "BS satellite," "free video," and "paid streaming services" will become irrelevant to users going forward. Advertisers, too, will increasingly focus their strategies not on "media" but on the "device" – the television set itself – meaning they will center their thinking around the user.
Furthermore, from a generational perspective, the pandemic has broadened the user base for internet video, gradually blurring the traditional distinction between "TV viewers" and "internet users." In the sense that users are consuming content rather than media, demand for "video ads designed to be viewed on TV sets" is likely to grow significantly. The recent increase in "ad-supported plans" offered by paid subscription-based video streaming services is also noteworthy.
Finally, beyond television, as society's digital transformation advances, the distinction between digital and non-digital is blurring, making classification increasingly difficult each year. It could be said that the convergence of digital and non-digital is progressing in line with consumers' information-seeking behaviors.
The integrated, cross-media strategies of publishers introduced here, the emergence of programmatic DOOH, and direct mail (DM) that digitally guides targets identified from data via QR codes, for example, increasingly demand perspectives beyond convenient classifications.
One example is the increasingly common media category called "retail media." The breakdown of advertising spend for retail media varies—sometimes classified as OOH, other times estimated as internet advertising spend—reflecting the diversification of how advertising budgets are allocated and perceived. However, this also stems from the lack of a shared definition for the term "retail media" itself.
The media introduced in "Japan's Advertising Expenditures" each have their own characteristics and strengths. Rather than simply leaning heavily toward digital, combining and leveraging the unique features of these media could enable highly cost-effective communication.
We intend to continue closely monitoring the environment surrounding advertising expenditures to capture a more accurate picture of "Japan's Advertising Expenditures."
Details on "2024 Japan Advertising Expenditures" can be found here (Dentsu Inc. News Release).

Was this article helpful?
Share this article
Newsletter registration is here
We select and publish important news every day
For inquiries about this article
Back Numbers

2024/02/27
Analysis of "2023 Japan Advertising Expenditures"──The downgrade of COVID-19 to Category 5 provided tailwinds, setting a new record high. How did advertising expenditures change during the pandemic?
2023/02/24
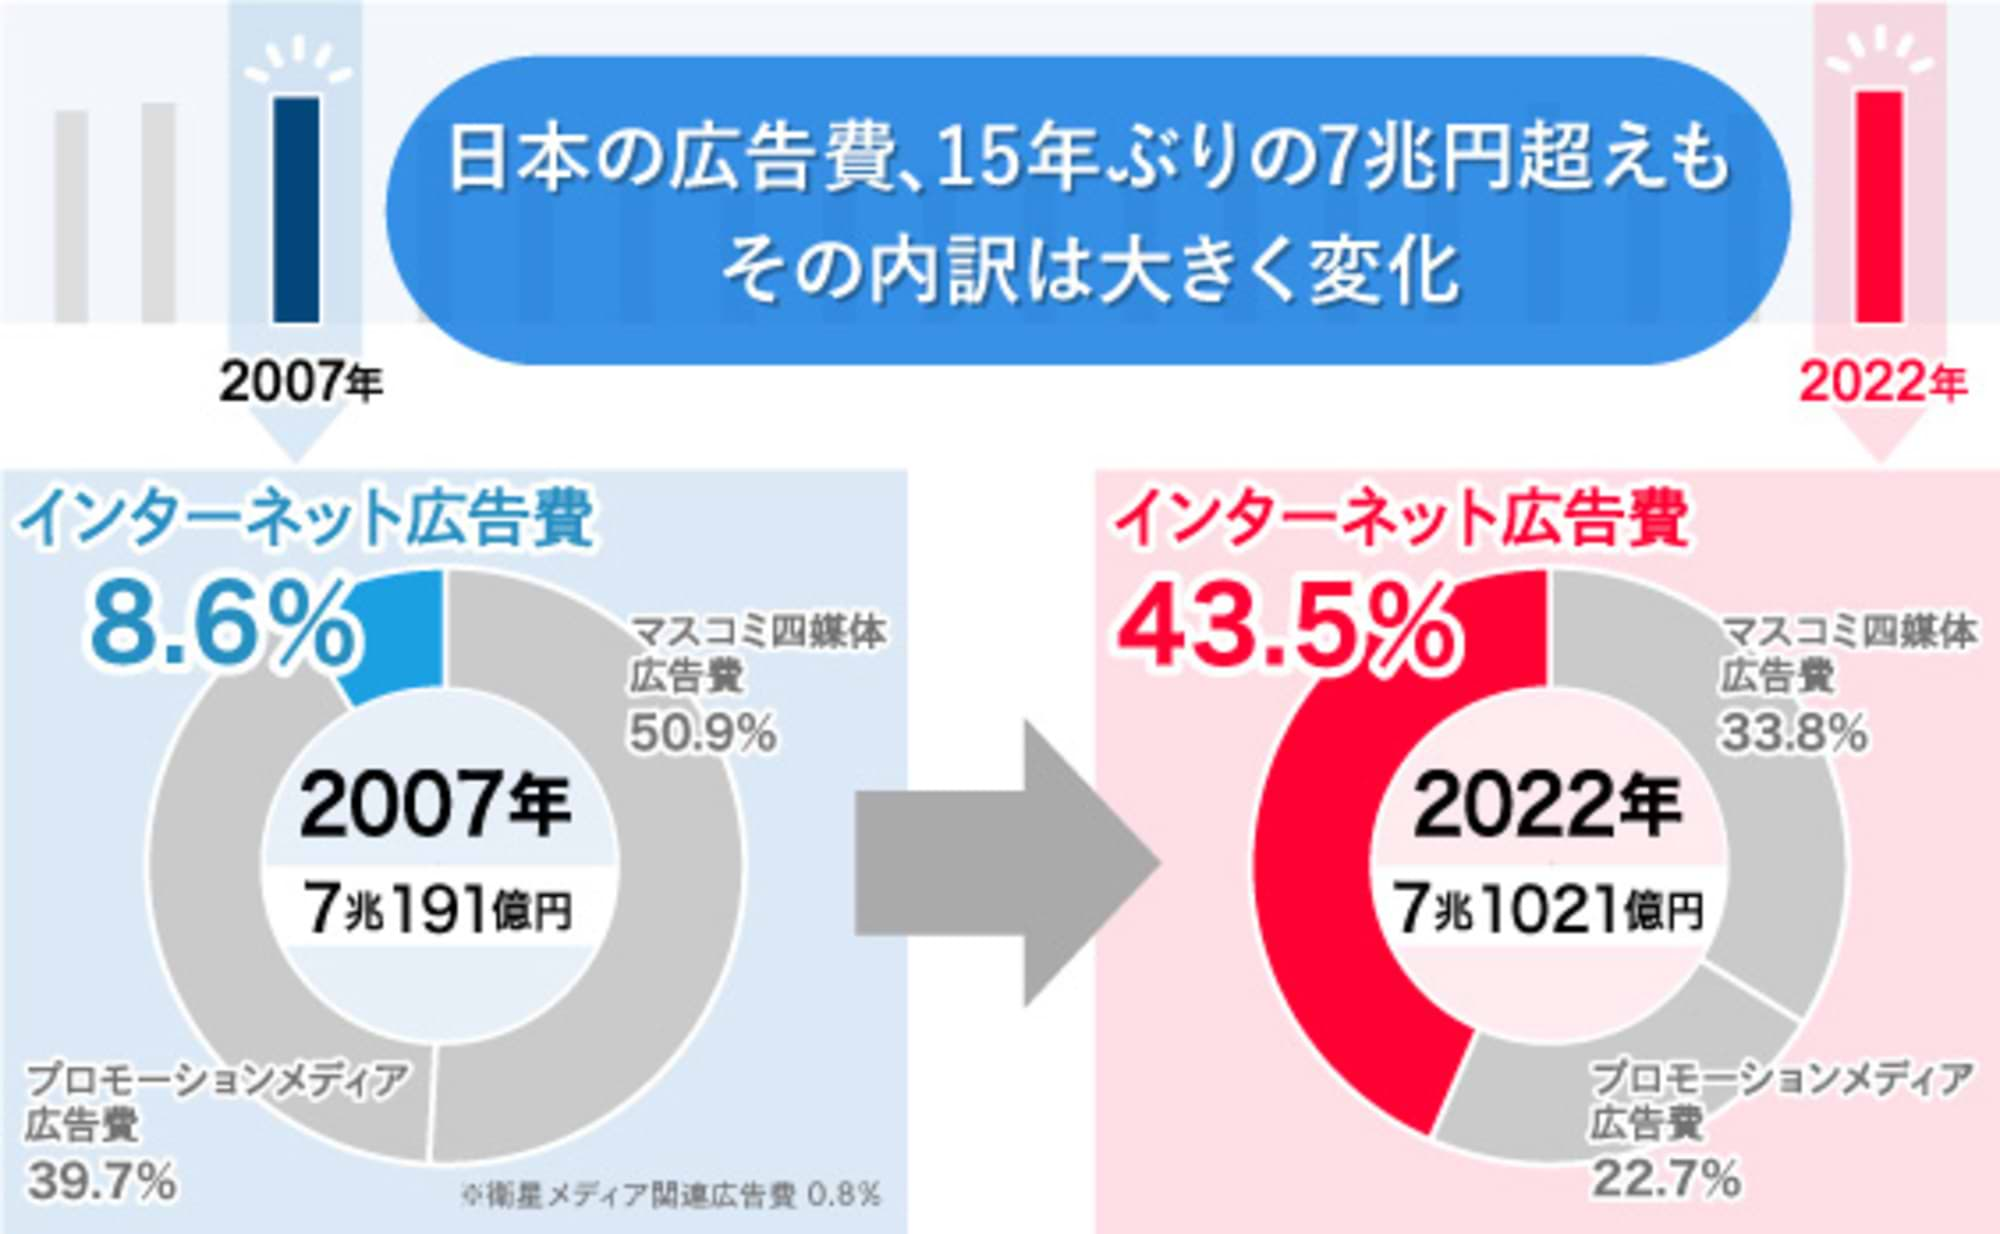
Analysis of "2022 Japan Advertising Expenditures" – Exceeding 7 Trillion Yen, the Highest in 15 Years. Internet Advertising Surpasses 3 Trillion Yen
Author

Rikuichiro Morinaga
Dentsu Inc.
Dentsu Inc. Media Innovation Lab
Principal Researcher
Responsible for research and studies on Japan's advertising media market and marketing-related fields. Annually publishes "Japan's Advertising Expenditures," "Detailed Analysis of Internet Advertising Expenditures," and "Global Advertising Expenditure Forecasts." Collaborates with external research institutions to analyze future trends in the advertising market.
Articles by this person
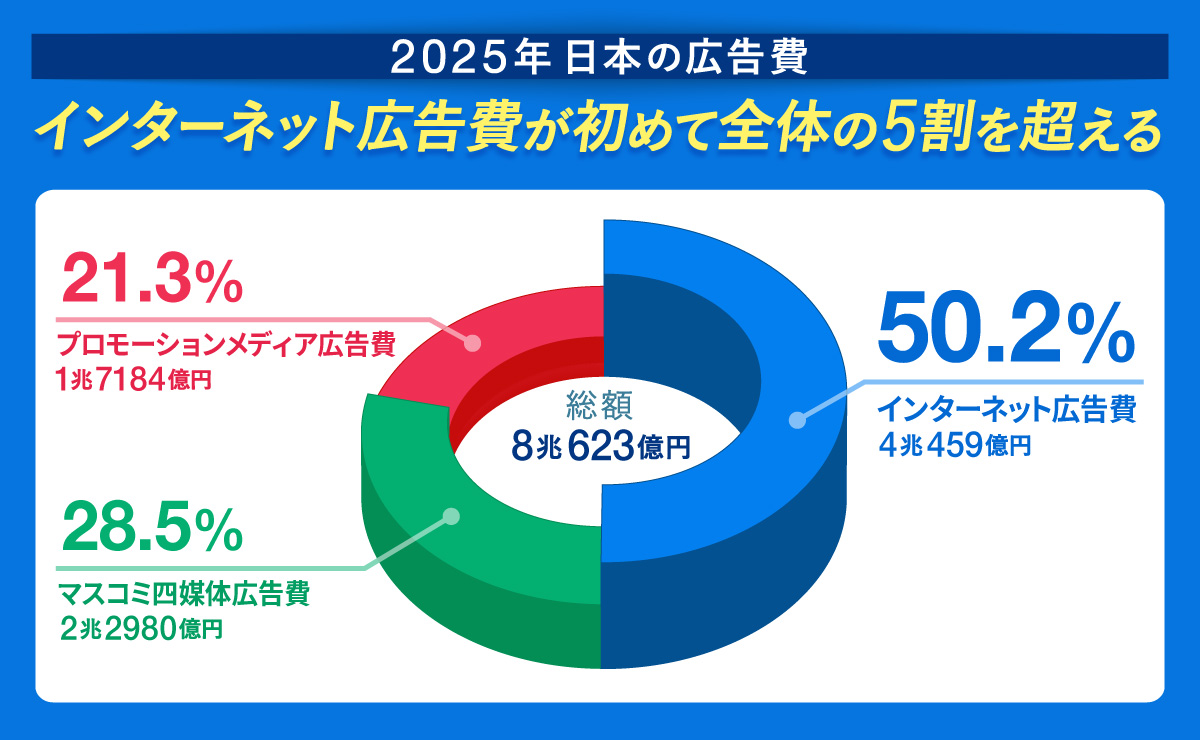
"2025 Japan Advertising Expenditures Analysis"──Exceeding 8 Trillion Yen for a Record High. Internet Advertising Expenditures Surpass 50% of Total Composition