Note: This website was automatically translated, so some terms or nuances may not be completely accurate.
Analysis of "2022 Japan Advertising Expenditures" – Exceeding 7 Trillion Yen, the Highest in 15 Years. Internet Advertising Surpasses 3 Trillion Yen
On February 24, 2023, " 2022 Japan Advertising Expenditures " was announced. Toshiyuki Kitahara of Dentsu Inc. Media Innovation Lab explains the changes in each advertising market: the four mass media, internet, and promotional media.
Related Article
Interview with CyberAgent President Shin Fujita on the Current State of Advertising: Special Discussion on "2022 Japan Advertising Expenditures"
Analysis of "2022 Internet Advertising Media Expenditures." What's the Breakdown of the Record-Breaking ¥3.0912 Trillion?

Overview of "2022 Japan Advertising Expenditures" — The Advertising Market Returns to Growth Trajectory.
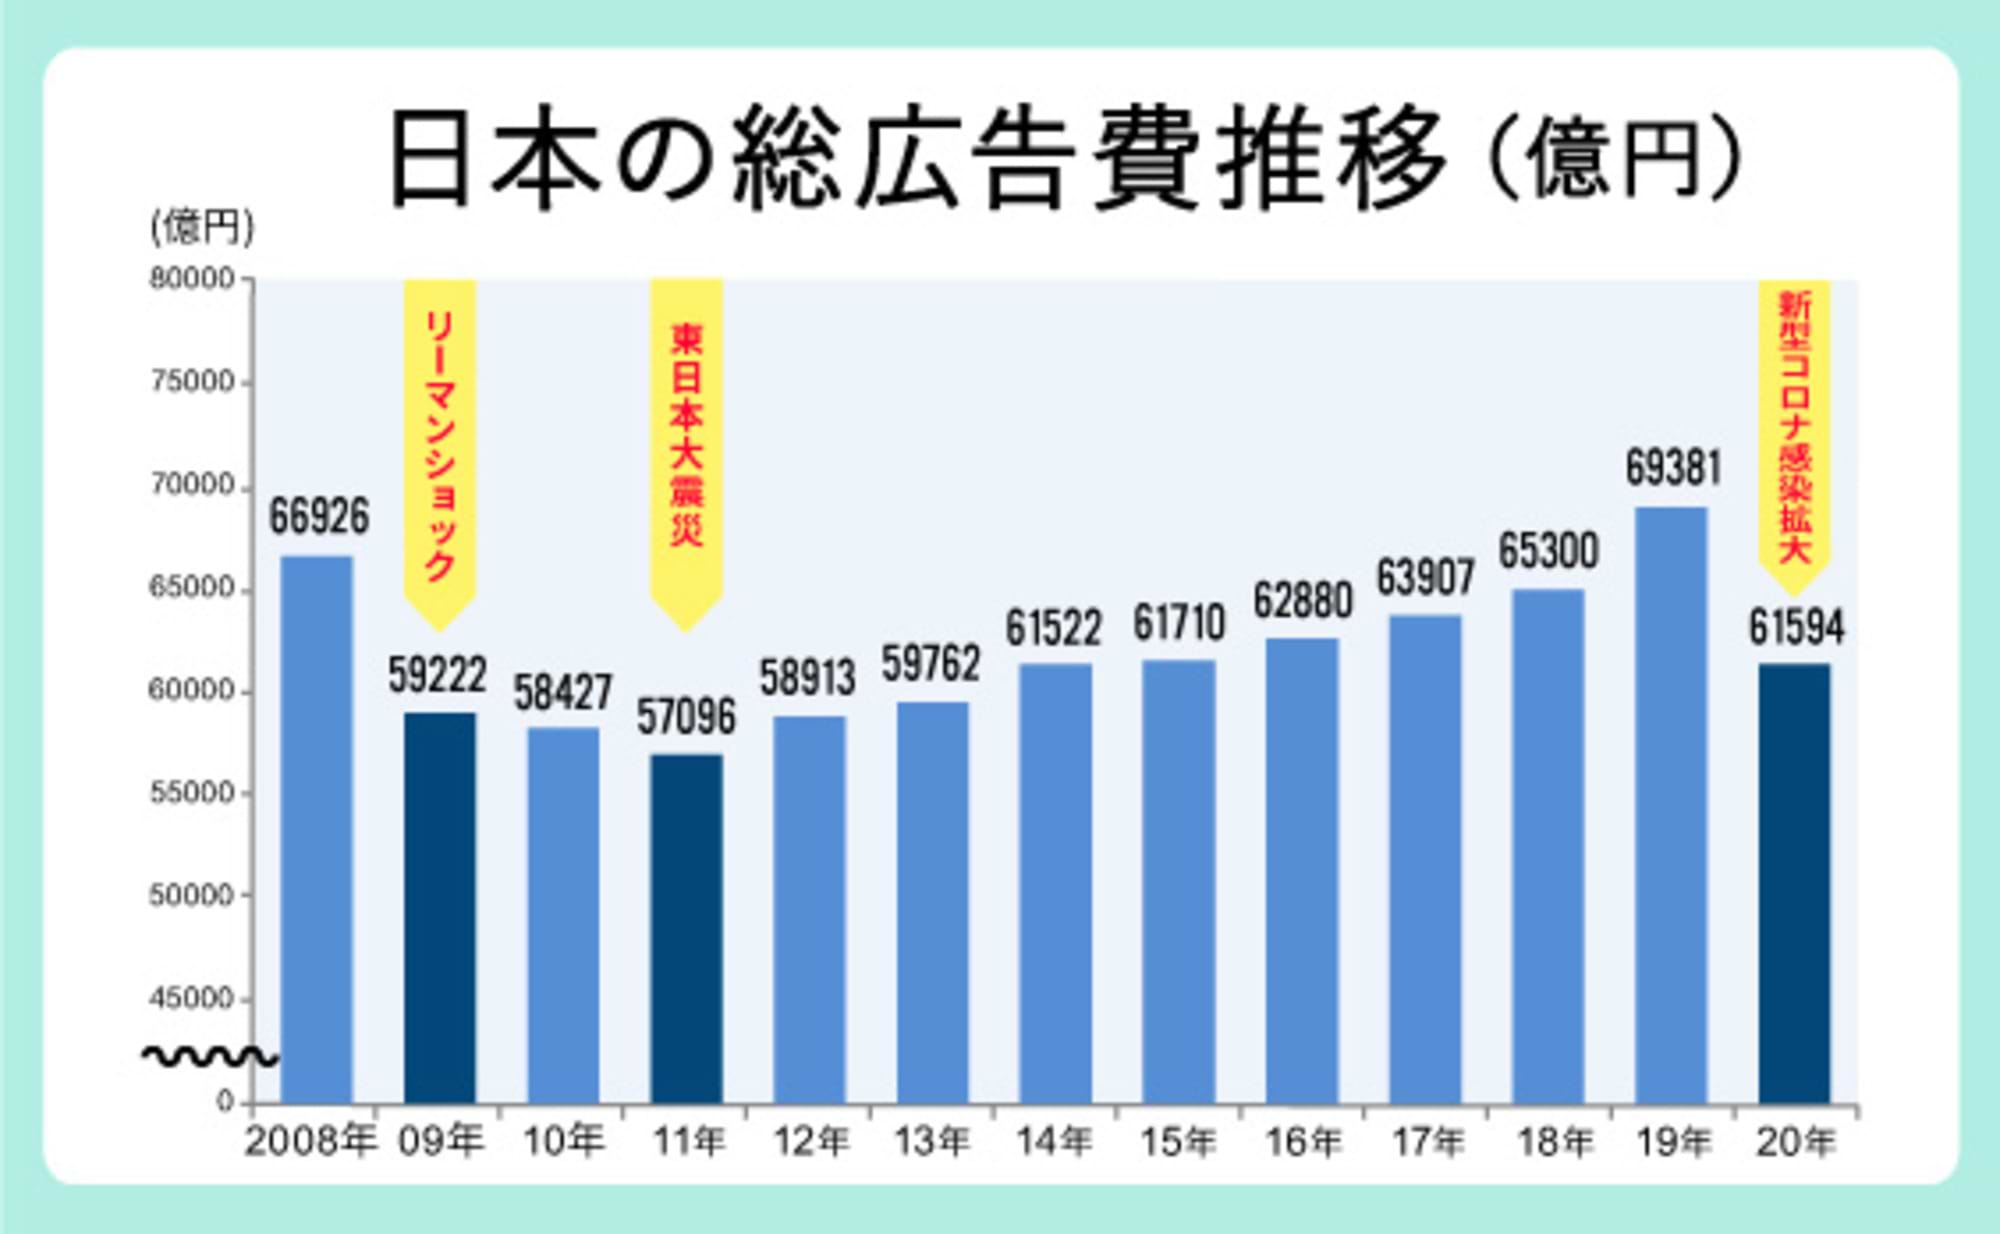
Japan's total advertising expenditure for 2022 (January-December) reached 7.1021 trillion yen. This marks the highest figure since estimates began in 1947(※).
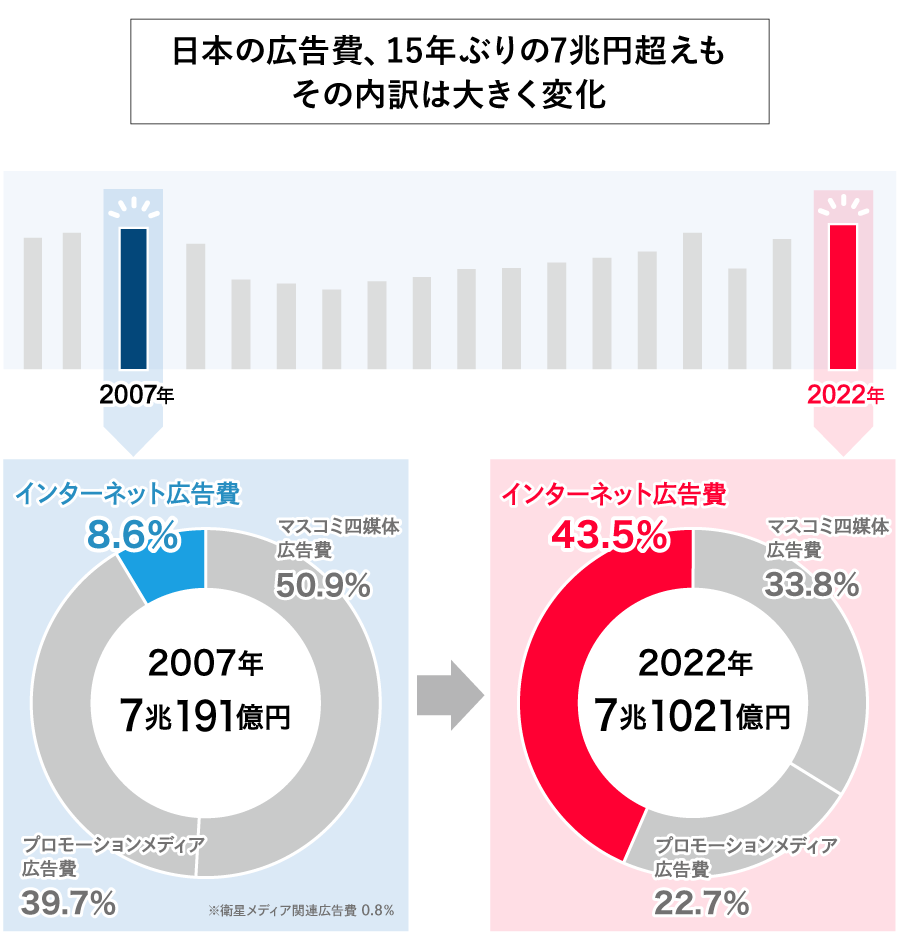
It surpassed the previous record of 7.0191 trillion yen set in 2007, marking the first time in 15 years that spending exceeded 7 trillion yen. Year-on-year, it increased by 4.6%. Following the decline in 2020 due to the spread of the novel coronavirus, Japan's advertising expenditure is clearly back on a growth trajectory.
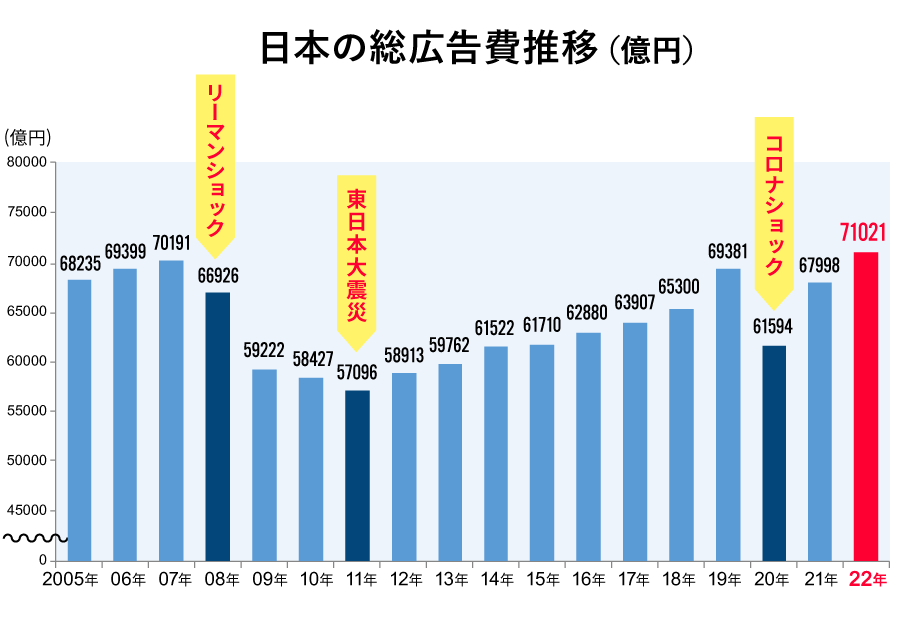
Looking back at 2022, the first half was generally strong, partly due to events like the Beijing 2022 Winter Olympics and Paralympics held in February and March. However, the year was also significantly impacted by various negative factors stemming from overseas developments, including the situation in Ukraine, and faced considerable economic pressure.
For the full year, the economy saw a gradual recovery, with figures returning to pre-pandemic 2019 levels. Markets such as food service, transportation, and leisure recovered notably as restrictions on outings and movement eased.
Furthermore, the digitalization of society, accelerated by the pandemic, continued to advance rapidly, contributing to the growth of internet advertising spending.
Among these, "TV media-related video advertising expenditure" showed high growth, reaching ¥35 billion, a 140.6% increase year-on-year. This figure primarily estimates advertising expenditure on internet video streaming services operated by TV media broadcasters, such as catch-up streaming of TV programs.
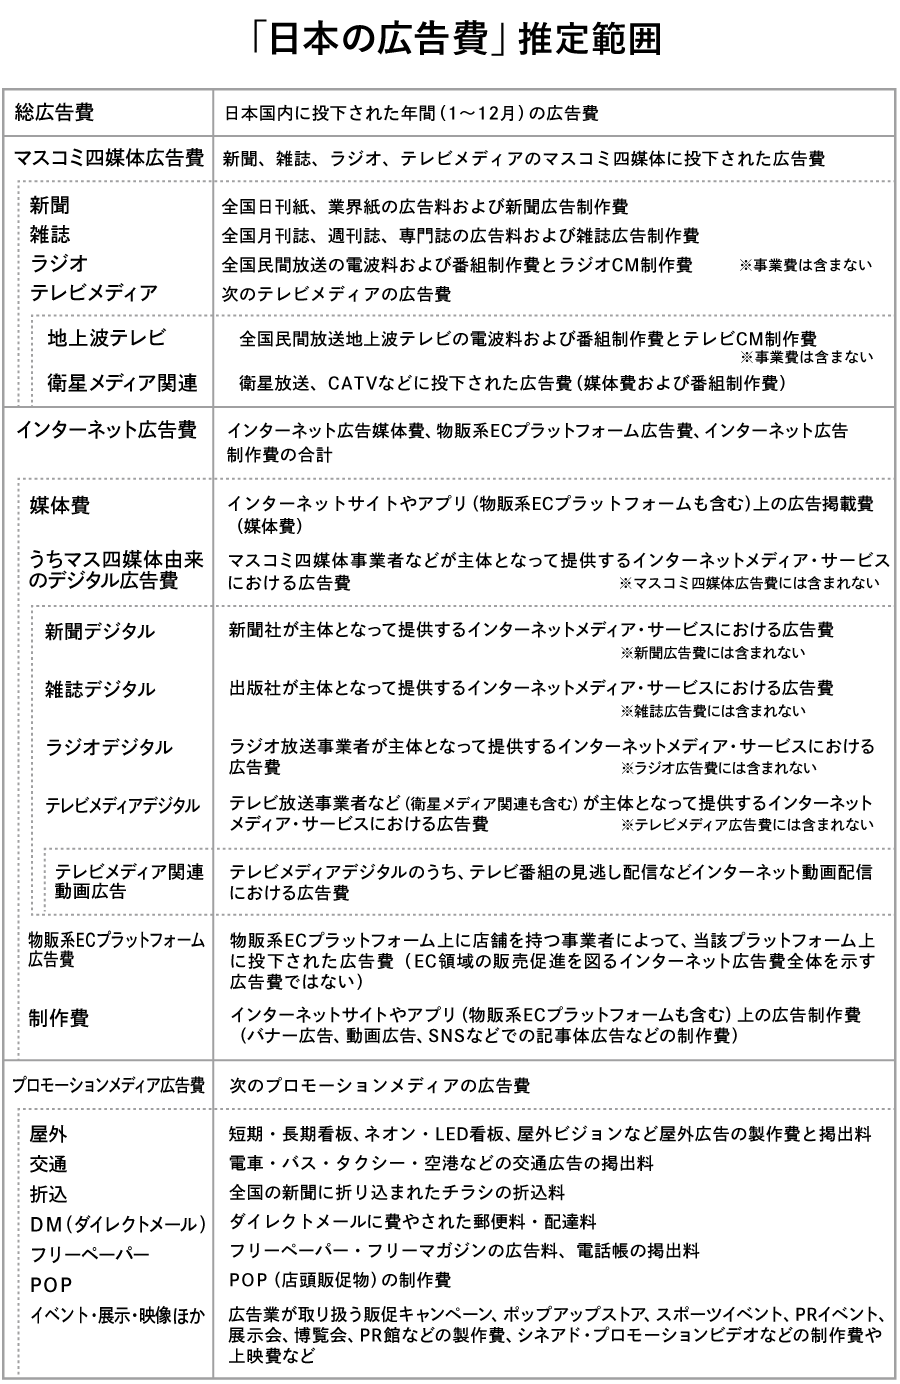
Japan's advertising expenditure is broadly categorized into
- "Mass Media Advertising Expenditures"
- "Internet advertising spending
- "Promotional Media Advertising Expenditures"
.
The respective shares of advertising expenditure are: mass media at 33.8%, internet at 43.5%, and promotional media at 22.
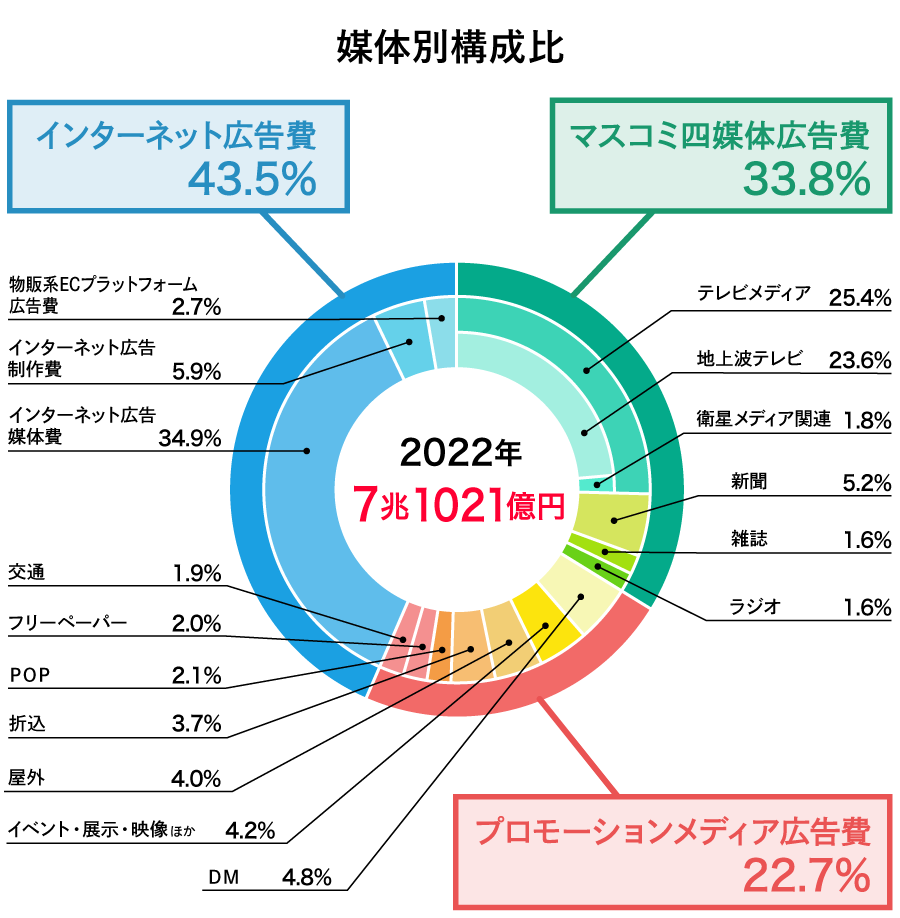
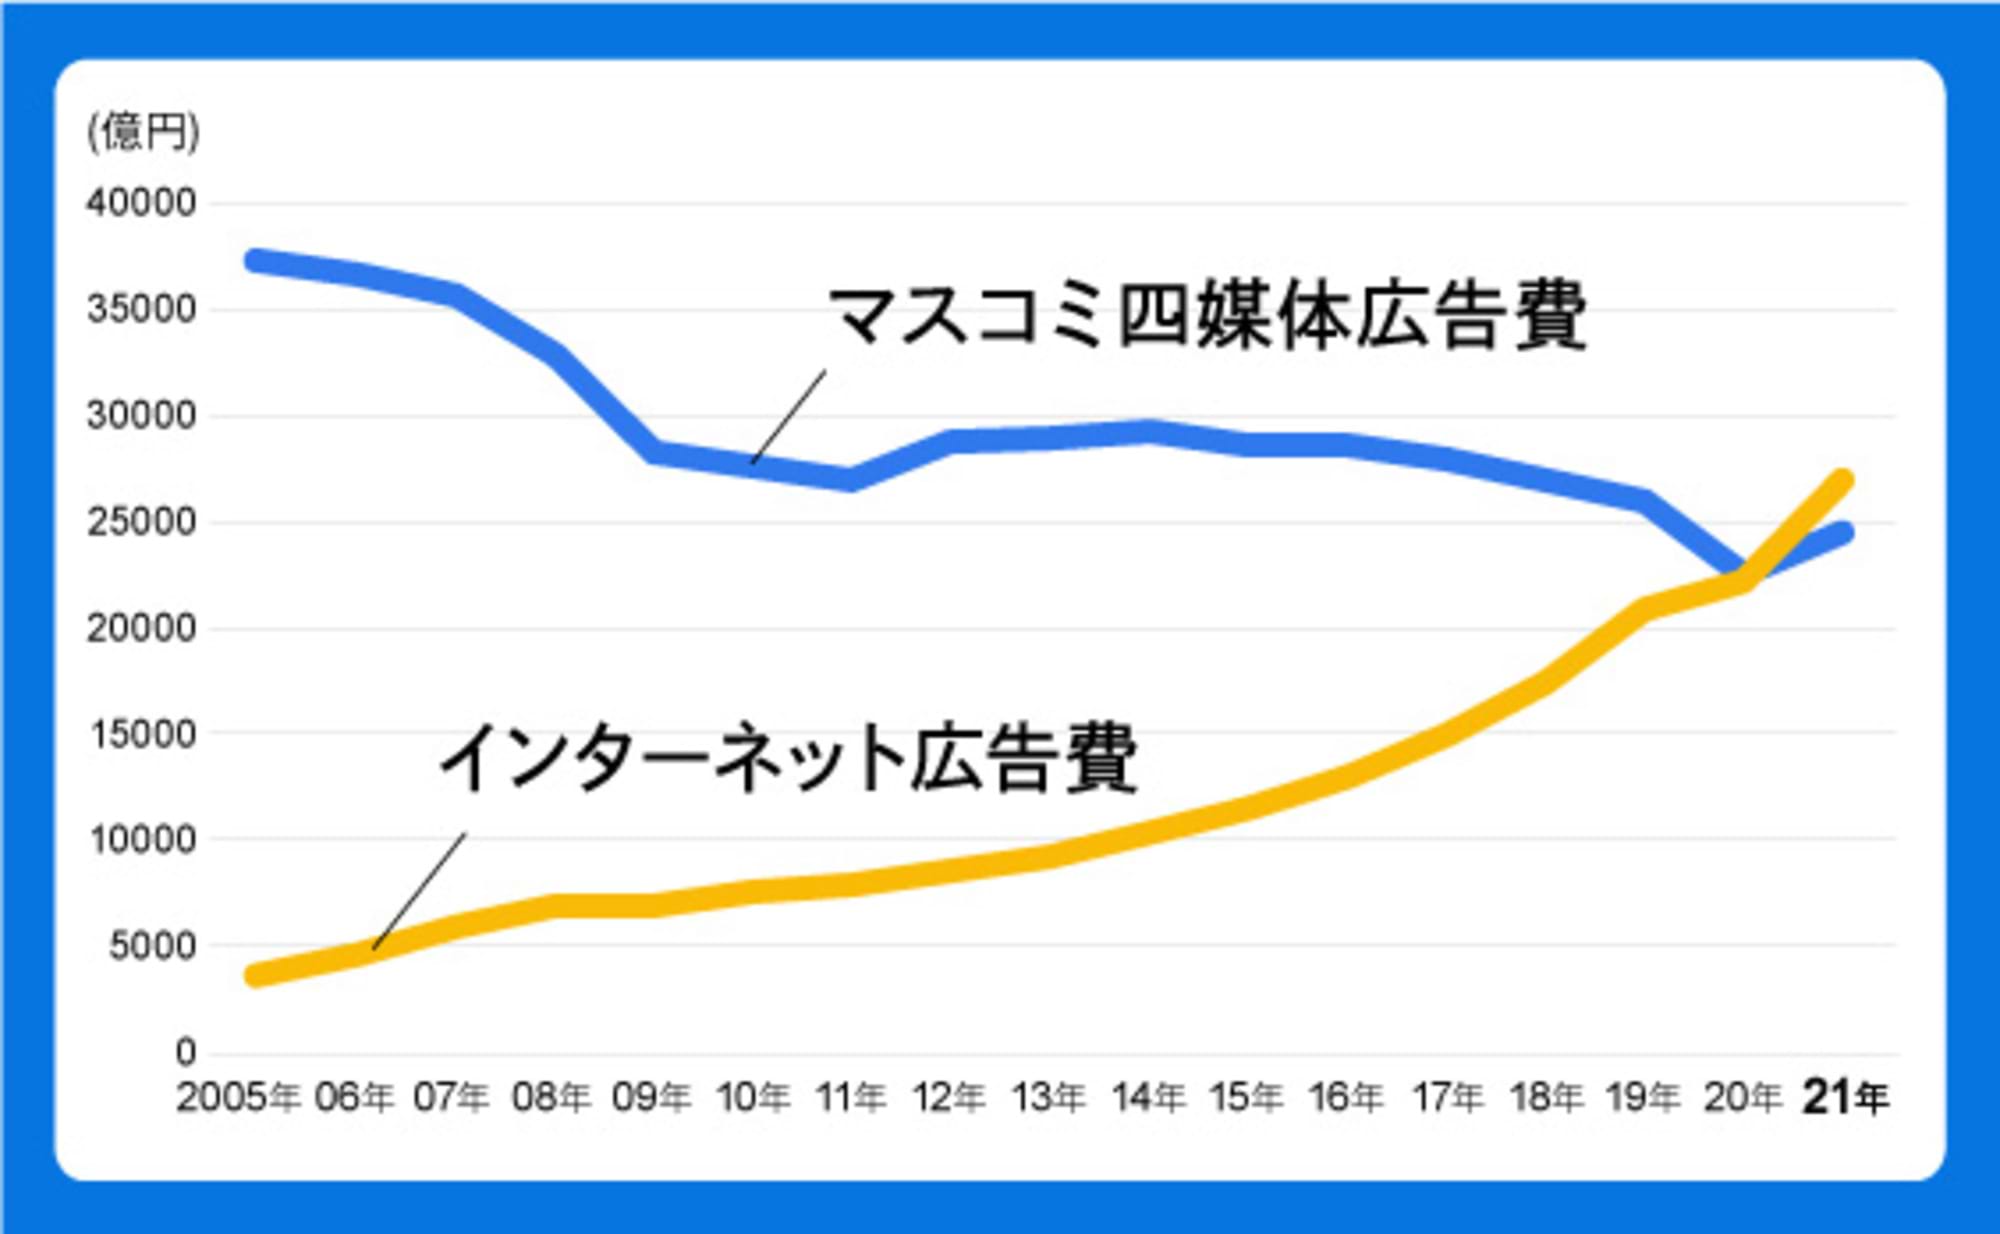
The proportion of internet advertising expenses within total advertising expenses continued to increase, rising from 39.8% in 2021 to 43.5% in 2022.
●Mass Media Advertising Expenditures
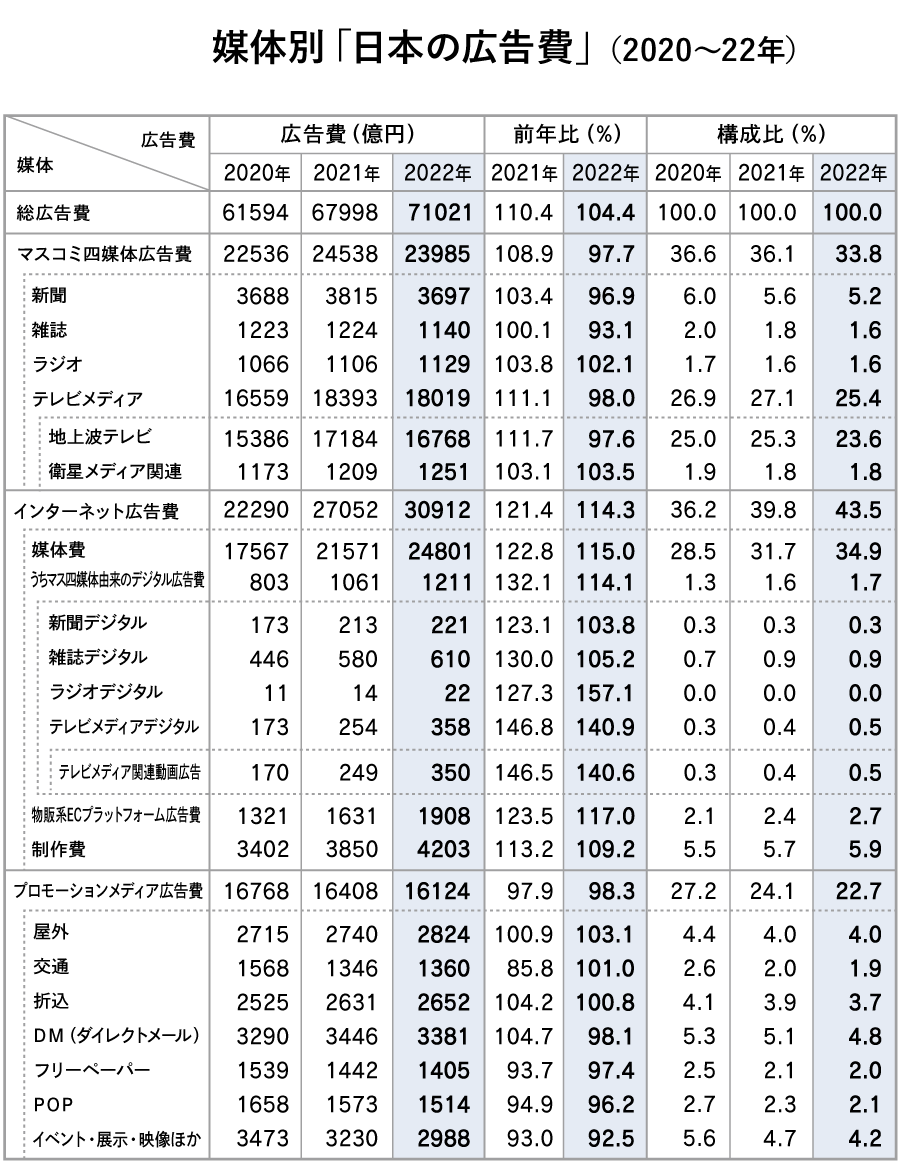
Advertising expenditure for the four mass media outlets—newspapers, magazines, radio, and television—totaled ¥2.3985 trillion, representing 97.7% of the previous year's figure. This expenditure includes both media fees and production costs.
Year-on-year changes by medium were: newspapers 96.9%, magazines 93.1%, radio 102.1%, and television media (combining terrestrial and satellite) 98.0%. Only radio advertising expenditure increased.
●Internet Advertising Expenditures
Internet advertising expenditure (combined internet advertising media fees, internet advertising production fees, and e-commerce platform advertising fees) reached ¥3.0912 trillion, a 114.3% year-on-year increase, continuing to drive market expansion.
This represents growth of approximately ¥1 trillion (¥986.4 billion) in just three years since surpassing ¥2 trillion in 2019. Globally, digital media spending tends to account for about half of all advertising expenditure, and Japan is also shifting towards this pattern.
●Promotional Media Advertising Expenditures
This reached ¥1.6124 trillion, a 98.3% year-on-year figure. With various restrictions eased, events and traditional advertising/promotional campaigns resumed. As foot traffic returned, media such as "outdoor advertising," "transportation advertising," and "insert advertising" continued to show positive growth compared to the previous year.
Below, we provide a more detailed breakdown by category.
Mass Media Advertising Expenditures – Overall Decline, but Radio Advertising Expenditures Show Growth
●Mass Media Advertising Expenditures <Newspaper Advertising Expenditures>
Newspaper advertising spending decreased year-on-year to ¥369.7 billion (96.9% of the previous year). The Tokyo 2020 Olympic and Paralympic Games, held domestically in 2021, generated exceptionally high advertising spending, and 2022 saw a corresponding decline.
On the other hand, positive factors in 2022 included sports events like the Beijing 2022 Winter Olympics and Paralympics and the FIFA World Cup Qatar 2022, which contributed to increased advertising spending. Additionally, the 26th House of Councillors election took place, and elections generally have a positive impact on newspaper advertising.
By industry, advertising spending for transportation and leisure saw a significant recovery, reaching 117.8% of the previous year's level. Newspapers traditionally carry substantial advertising spending from the travel/accommodation and transportation sectors, clearly showing the return of people flow that had declined during the COVID-19 pandemic.
●Mass Media Advertising Expenditures < Magazine Advertising Expenditures>
Magazine advertising expenditure was ¥114 billion, a 93.1% year-on-year figure. By industry, similar to newspaper advertising, transportation and leisure saw increases, while sectors with a high share of magazine advertising, such as cosmetics and toiletries, continued to decline.
Not only advertising, but the publishing market itself continues to shrink. Estimated sales of paper publications in 2022 were 93.5% of the previous year. Magazines, in particular, were 90.9% of the previous year. In contrast, the electronic publishing market grew to 107.5% of the previous year, surpassing ¥500 billion. However, the total "publishing market" (combining paper and electronic) was 97.4% of the previous year, marking the first year-on-year decline in four years. (Source: "Publishing Monthly Report," January 2023 issue)
●Advertising Expenditures for Four Major Media <Radio Advertising Expenditures>
Radio advertising expenditure was the only one of the four major media to increase, reaching ¥112.9 billion, a 102.1% increase year-on-year.
By industry, significant growth in sectors like Fashion & Accessories, Food Service & Various Services, and Cosmetics & Toiletries drove the increase in radio advertising spending.
●Advertising Expenditures Across Four Major Media <TV Media Advertising Expenditures>
Television media advertising expenditure (terrestrial TV + satellite media-related) was ¥1,801.9 billion, a 98.0% year-on-year figure. For terrestrial TV alone, it was ¥1,676.8 billion, a 97.6% year-on-year figure.
While major events like sports returned significantly in 2022, time-based advertising failed to fully offset the rebound decline, as the substantial boost from the Tokyo 2020 Olympic and Paralympic Games in 2021 set a high bar.
Spot advertising spending saw strong growth driven by demand for human resources and recruitment services as the economy recovered from the pandemic, particularly during the January-March quarter when recruitment demand peaks. However, it slowed somewhat in the latter half of the year due to deteriorating economic conditions. A major contributing factor was the lack of growth in advertising spending for the information and communications sector, which has a large market share. On the other hand, signs of recovery were visible in the automotive sector.
Internet Advertising Expenditures: Growing Against the Backdrop of Society's Digitalization, Exceeding 3 Trillion Yen
Internet advertising expenditure reached ¥3.0912 trillion. Of this, media fees accounted for ¥2.4801 trillion. It continued to perform well against the backdrop of rapidly advancing societal digitalization.
A notable trend is the increasing demand for video advertising, partly due to platform operators and media companies focusing on video services.
Search-linked listing ads and digital promotions also performed well. Advertisers are increasingly prioritizing digital promotions for customer retention/acquisition and sales expansion.
● Digital Advertising Spending Originating from the Four Mass Media
Digital advertising originating from the four major media outlets (these are included in internet advertising media costs, not the four major media advertising costs) reached ¥121.1 billion, a 114.1% increase year-on-year.
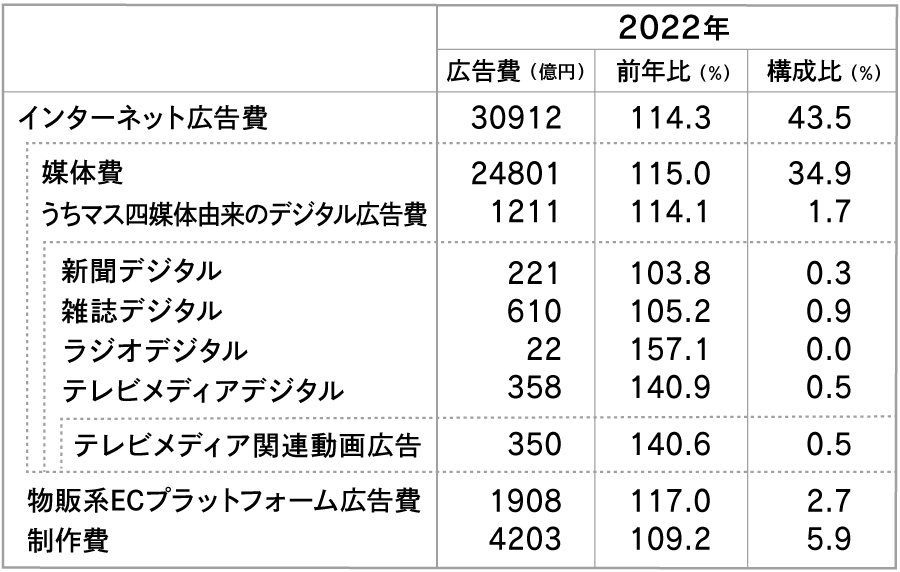
Within this segment, "magazine digital" represents the largest market, accounting for over half of the total—¥61 billion out of ¥121.1 billion.
The e-publishing market continues to grow annually, and the digitization of content is progressing steadily, suggesting it has entered a period of stable growth. The use of publishing-related web media and content apps is becoming increasingly common.
While manga dominates the e-book market, when digitizing traditional print content, publishers are moving away from simply replicating the print layout. Instead, they are developing formats optimized for smartphone reading. For example, apps enabling vertical-scroll manga optimized for smartphones are seeing significant growth.
Magazines, being inherently segmented media, also have high affinity with social media and fan communities. They can enhance reader engagement across various digital touchpoints while leveraging user data for content creation and marketing. Centered around content, businesses are expanding by utilizing digital tools, such as linking with e-commerce sites.
This time, we particularly want to highlight "TV Media Digital." Video advertising expenditure related to TV media grew significantly, reaching ¥35 billion, a 140.6% increase year-on-year.
As mentioned earlier, TV media-related video advertising primarily refers to estimated advertising spending on internet video streaming by TV media broadcasters. Representative examples include video ads on "TV program video platforms" like TVer.
ABEMA significantly increased its presence by recording its highest-ever Weekly Active Users (WAU) during the FIFA World Cup Qatar 2022 period.
Furthermore, the practice of enjoying internet video content on internet-connected TV sets, known as "connected TV," is also gaining popularity. This category warrants continued attention.
Reference:Connected TV Related Articles
Advertising spending on "Radio Digital" also grew significantly, reaching ¥2.2 billion, a 157.1% increase year-on-year. While radiko is a key player, audio media like podcasts are growing, with examples of other media, such as newspapers, also engaging in podcasts. Advertising on music streaming services is also increasing.
"Newspaper Digital" also continued to grow, reaching ¥22.1 billion, a 103.8% increase year-on-year.
●E-commerce Platforms for Physical Goods
Advertising spending on product-based e-commerce platforms grew to ¥190.8 billion, a 117.0% increase year-on-year, outpacing the overall growth rate of internet advertising spending (114.3% year-on-year).
Driven by "stay-at-home demand" during lockdowns, e-commerce platforms have gained widespread adoption across diverse demographics in recent years. Even as opportunities to go out have increased, the habit of using these platforms has become firmly established. Consequently, sales volumes are rising in categories traditionally associated with going out, such as cosmetics, fashion, travel, and sports-related goods.
●Internet Advertising Production Costs
Internet advertising production costs reached ¥420.3 billion, a 109.2% increase year-on-year. Demand for video content continues to rise, with particularly notable growth in production costs for in-stream web video ads that play within content. This trend is strengthening year by year.
Promotional Media Advertising Expenditures: Outdoor Advertising Gains Attention with Recovery in Foot Traffic
Promotional media advertising expenditure, which had declined in recent years due to pandemic-related restrictions on going out, reached ¥1.6124 trillion in 2022, a 98.3% year-on-year figure. With the recovery in foot traffic, several categories are showing growth.
●Promotional Media Advertising Expenditures <Outdoor Advertising, Transportation Advertising>
Outdoor advertising is particularly noteworthy, reaching ¥282.4 billion, a 103.1% increase year-on-year. Advertising spending has increased for large, eye-catching OOH media, including outdoor vision displays. 3D street content also generated significant buzz in 2022.
Reference:OOH-related articles
Transportation advertising also increased, reaching ¥136.0 billion (101.0% YoY), partly due to the return of passenger traffic. Demand concentrated on impactful OOH media installed in high-traffic locations like major stations.
In taxis, in-cab digital signage advertising has become established, with many so-called B2B advertisements being placed.
●Promotional Media Advertising Expenditures<Inserts, DM (Direct Mail)>
Newspaper insert advertising saw a slight increase to ¥265.2 billion, up 0.8% year-on-year. Advertising appetite has recovered significantly among distribution and retail sectors selling everyday goods, such as supermarkets and home centers. Advertising from industries like secondhand dealers, travel/hotels, and mail order also performed well.
DM advertising reached ¥338.1 billion, a 98.1% year-on-year figure. While the numbers show a slight decrease, this occurred amid various factors such as rising logistics costs due to higher resource prices and changes in various delivery service models. DM continues to receive a certain level of recognition from advertisers and cannot be considered uniformly sluggish.
Noteworthy are personalized DM campaigns that use data marketing to extract and optimize targets, as well as DM integrated with digital initiatives. Promotional strategies combining digital and analog approaches continue to evolve annually. Examples include sending DM or catalogs with messages tailored based on purchase history and attributes, or reaching out to users who have abandoned items in their shopping carts on e-commerce sites.
●Promotional Media Advertising Expenditures <Free Papers>
Free paper advertising spending decreased to ¥140.5 billion, representing 97.4% of the previous year's level. While foot traffic has recovered somewhat, overall circulation and frequency have declined. This is partly due to a reassessment of distribution methods following the pandemic, with materials previously distributed in offices or placed at stations being reevaluated. On the other hand, free papers focused on local information often lack viable alternatives. As a medium playing a role in regional revitalization, they have remained relatively stable.
●Promotional Media Advertising Expenditures <POP>
POP advertising expenditure was ¥151.4 billion, representing 96.2% of the previous year's level. While the use of interactive communication tools, such as digital signage and smartphones, has advanced, and experiential initiatives allowing customers to touch actual products have increased in physical stores due to the recovery in foot traffic, advertising expenditure for traditional in-store POP has decreased.
The advertising utilization of in-store signage as so-called retail media is likely still in an exploratory phase.
●Promotional Media Advertising Expenditures <Events, Exhibitions, Video, etc.>
This segment decreased to ¥298.8 billion, representing 92.5% of the previous year's level.
For the event sector, a significant portion of this decrease can be attributed to the rebound effect following the Tokyo 2020 Olympic and Paralympic Games held in 2021.
While foot traffic is recovering, it has not yet returned to pre-pandemic levels, and the number of exhibitors at trade shows has also decreased. However, hybrid events combining online and offline formats have become established, and the recovery of physical events themselves is expected going forward.
A society increasingly digitized. How will our relationship with content evolve?
In 2022, as restrictions eased and foot traffic returned, advertising spending recovered in tandem with this movement. By industry, advertising spending increased year-on-year in sectors such as Transportation & Leisure, Food Service & Various Services, Energy, Materials & Machinery, and Fashion & Accessories.
However, the society that has changed significantly over the past few years will not return to its pre-pandemic state. Digitalization has had a major impact on the new lifestyles that have emerged.
Looking ahead, I believe the growth of digital TV media deserves attention. Internet connectivity for TV sets now exceeds 50%, and the style of "enjoying internet content on a large TV screen" is becoming established. Particularly in 2022, the FIFA World Cup Qatar 2022 drew massive attention, rapidly popularizing online video viewing that allows both live and catch-up viewing.
Watching online videos on TV sets is easily accepted even by generations raised on traditional television, ushering in an era where connected TVs are enjoyed by middle-aged and senior demographics. The environment is maturing where a single TV set can seamlessly access both terrestrial broadcasts and online video streaming, and online video viewing on TV sets is likely to increase further. Furthermore, even when viewing the same content, viewing time tends to be longer on TV sets, suggesting potential advertising effectiveness in this regard.
As consumer viewing behaviors diversify, particularly with the streaming of sporting events and other video content, how to position advertising effectively remains a challenge for the advertising industry.
Conversely, it's worth noting that advertising spending on radio—a medium not dominated by visual elements like text, images, or video—is growing. Radio's strengths as an auditory-focused medium, beyond its well-known "background listening" appeal, suggest further untapped potential.
As media evolves, advertising formats will change too. Pursuing new forms of media is another challenge for the advertising industry.
Details on "2022 Japan Advertising Expenditures" can be found here (Dentsu Inc. News Release).

Was this article helpful?
Share this article
Newsletter registration is here
We select and publish important news every day
For inquiries about this article
Back Numbers
2022/02/24
Analysis of "2021 Japan Advertising Expenditures" - Advertising Market Shows Significant Recovery. Internet Advertising Expenditures Surpass Total of Four Mass Media for the First Time
2021/02/25
Analysis of "2020 Japan Advertising Expenditures"──First Decline in Nine Years Amid Pandemic. Second Half Shows Resilient Recovery Trend
Author

Toshiyuki Kitahara
Dentsu Inc.
Dentsu Inc. Media Innovation Lab
Principal Researcher
After working in the Information Systems Department and the Management Planning Department, he joined the Research and Development Department. He has held his current position since 2011. Engaged in research on mass media and communication, consulting for media companies, organizational and personnel system consulting, and advertising and related market/industry trend research. Responsible for "Japan's Advertising Expenditures" in the 'Information Media White Paper'. Author of numerous books and papers, including 'Information Innovators: Leaders of the Co-Creation Society' (co-authored, 1999, Kodansha). Also engaged in various surveys and projects related to newspaper companies, primarily regional papers.
Articles by this person

What's the true intent behind the "Declaration to Quit Mass Media"? The current state of local media. Special Discussion: "Japan's Advertising Expenditures in 2024"
