Note: This website was automatically translated, so some terms or nuances may not be completely accurate.
How will consumer behavior change based on perceptions of the "100-Year Life" era?
Dentsu Inc. Desire Design (DDD) is an organization that develops various solutions and disseminates information based on the relationship between consumption and desire.
In this article, we analyze DDD’s “Emotionally Driven Consumption Survey” ( click here for survey overview) and share the insights and findings derived from the results.
This article focuses on “How to Live in the Era of the 100-Year Life.” Akane Yamada of DDD explores the relationship between this concept and the “desires” that drive consumers.
<Table of Contents>
▼How Do Consumers Perceive the “100-Year Life Era”?
▼What are the characteristics of the "Long Working Hours Group" and the "Leisurely Lifestyle Group" in terms of gender and age distribution?
▼ Differences Revealed by Attitudes Toward Rising Prices
▼Do They Check Before Buying? Differences in How They Use Word-of-Mouth and Reviews
▼Summary: How People Perceive the "100-Year Life Era" as Reflected in "Reevaluation" and "Verification"
How Do Consumers Perceive the "100-Year Life Era"?
The term “the 100-Year Life Era” has been in common use for quite some time now. In 1950, the average life expectancy in Japan was approximately 58 years for men and 61 years for women. However, according to data released by the Ministry of Health, Labour and Welfare in July 2025, it stands at approximately 81 years for men and 87 years for women. This means that over the course of roughly 75 years, average life expectancy has increased by more than 20 years.
Now that living to the age of 90 is no longer considered exceptional, the question of how to plan for this extended life is being posed to each individual. The confusion and uncertainty surrounding this situation likely underlie the widespread discussion of the “100-Year Life Era.”
However, how consumers actually perceive this extended lifespan has not yet been fully understood. In a society where longevity is increasing, the sense of “how to use the time of a long life” can become a key factor influencing behavior.
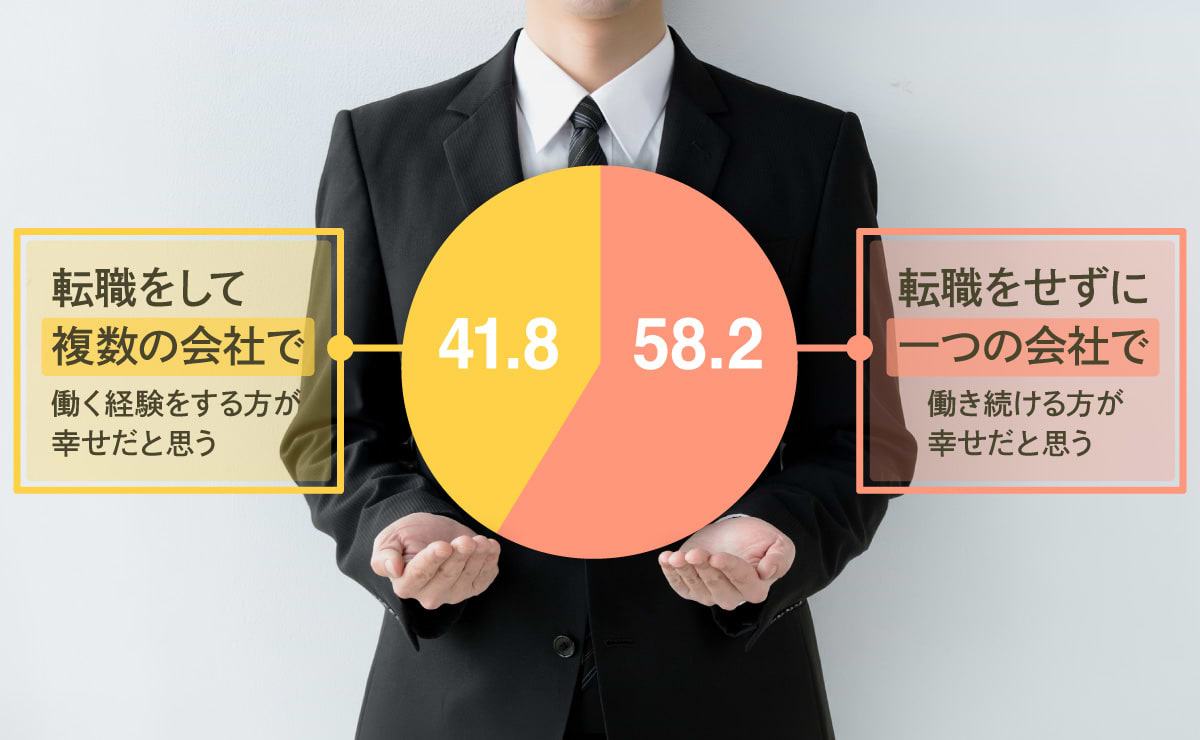
Therefore, in this survey, we asked questions about the “100-Year Life Era.” Specifically, regarding attitudes and behaviors related to daily life in general, we asked respondents to choose which of the following two options best described their views.
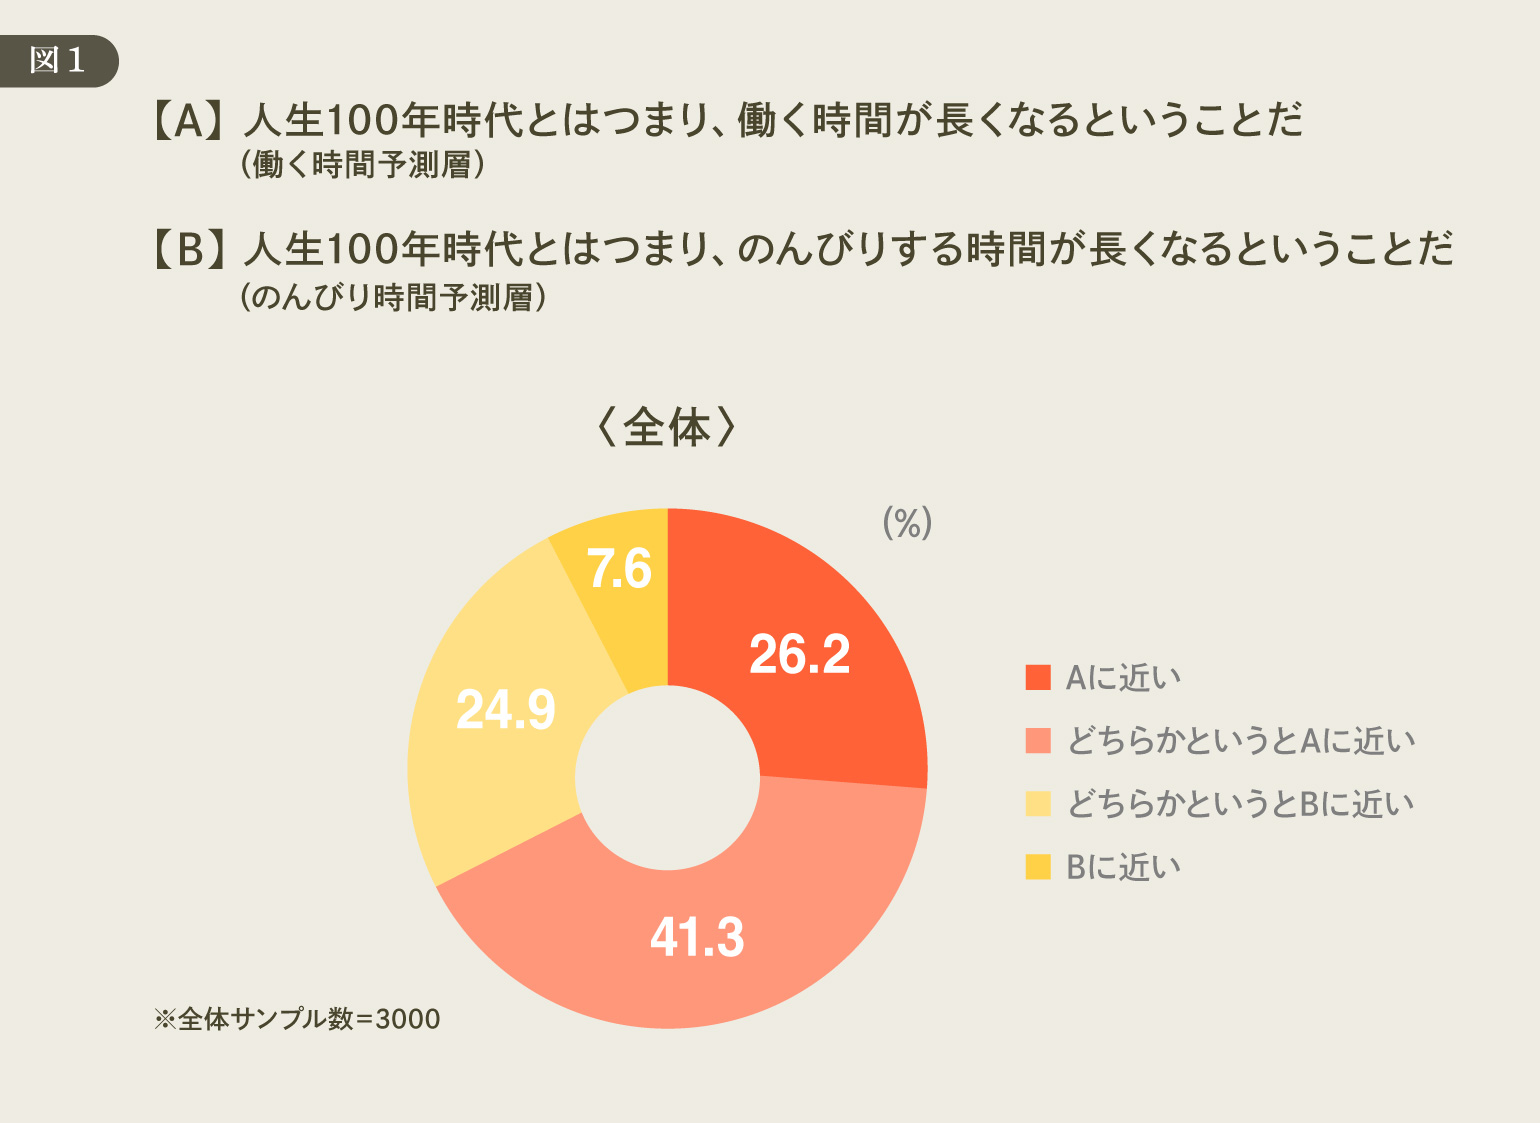
[A] The "100-Year Life Era" essentially means that the time spent working will increase
[B] The "100-Year Life Era" essentially means that the time spent relaxing will increase
The results showed that 67.5% of respondents answered “Close to A” or “Somewhat close to A,” while 32.5% answered “Close to B” or “Somewhat close to B.”
The group that believes “working hours will increase” (hereinafter the “longer working hours group”) and the group that believes “leisure time will increase” (hereinafter the “longer leisure time group”). When we analyzed and interpreted these results in conjunction with other survey findings, interesting differences in consumer behavior emerged between the two groups.
From here, we will examine how these differing outlooks manifest as differences in lifestyle values and behaviors, using questions related to consumer behavior as a guide.
What are the characteristics of the demographic composition (age and gender) for the “Work Time Prediction Group” and the “Leisure Time Prediction Group”?
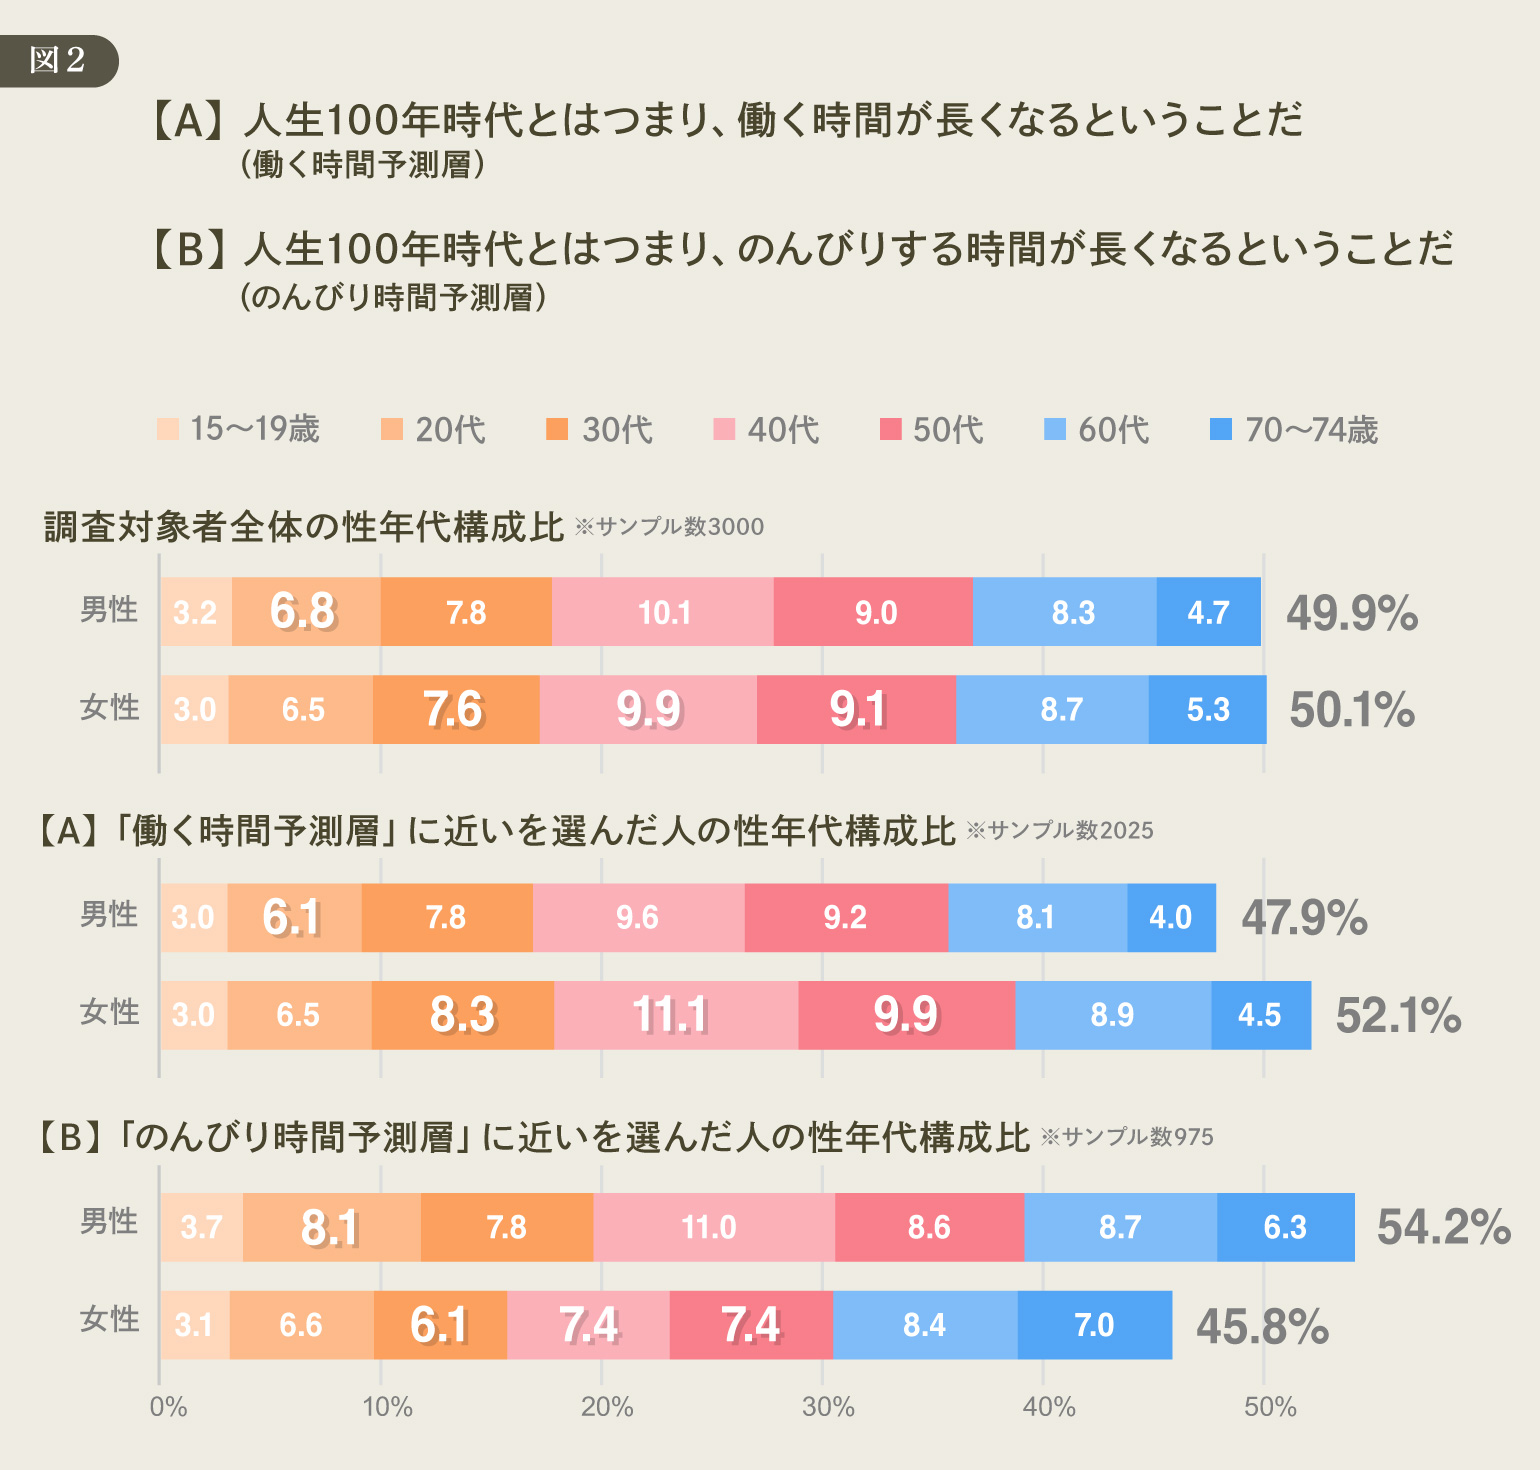
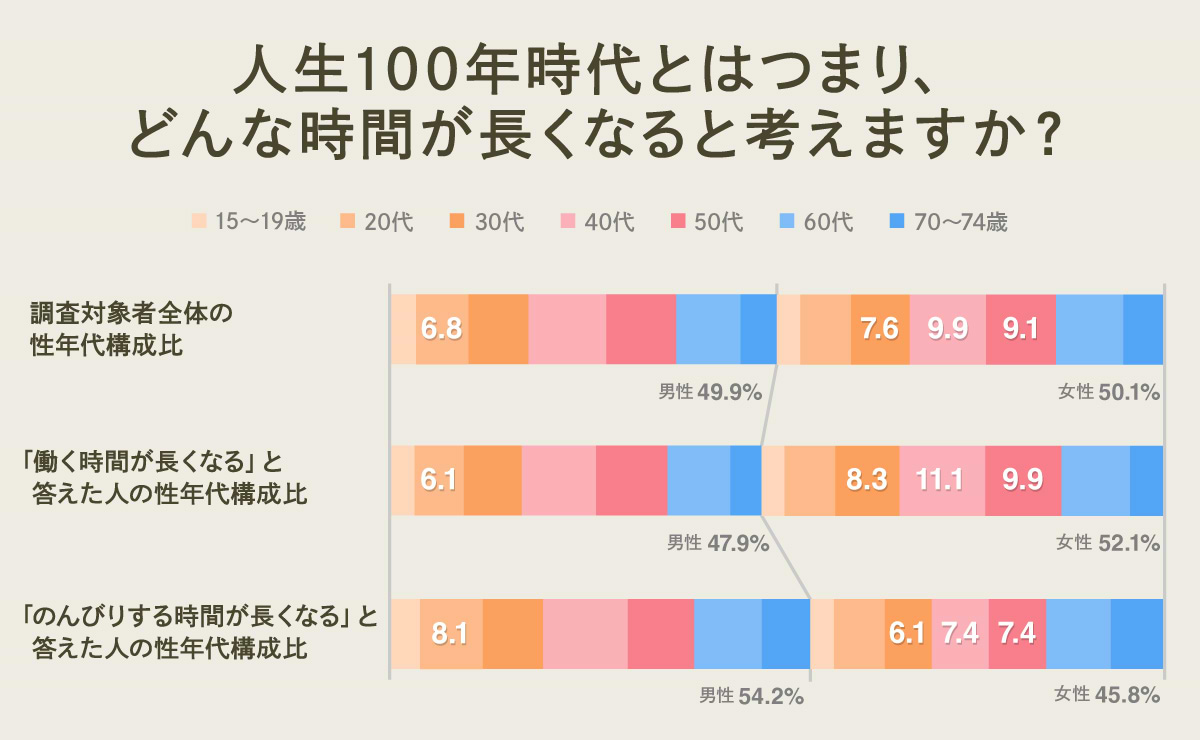
Looking at the gender and age distribution of the entire survey sample (3,000 respondents), men accounted for 49.9% and women for 50.1%, making up roughly equal proportions. In contrast, the group that expects “working hours to increase” consisted of 52.1% women, slightly higher than the overall average, with women in their 30s to 50s being particularly prominent.
For example, while women in their 40s account for 9.9% of the total survey population, they make up 11.1% of the group predicting longer working hours. Similarly, women in their 30s account for 7.6% of the total population but 8.3% of this group. This indicates that the proportion of women in the working-age population is slightly higher among those who believe their working hours will increase.
On the other hand, the gender composition of the group expecting to have more leisure time is slightly higher for men, at 54.2%. Similarly, men in their 20s account for 8.1% of the "leisure time" group, compared to 6.8% of the overall survey population.
Having noted these differences in gender and age composition, let’s now examine the characteristics of these two groups by comparing them with the results of other survey questions. While the differences in gender and age composition may also influence the following results, we will focus on questions where the differences are significant enough that they cannot be explained by those factors alone—specifically, items where the gap between the two groups is around 10 percentage points.
Differences Revealed by Perceptions of Rising Prices
First, the question that stood out due to the significant difference in responses between the two groups was whether they feel the need to adjust their consumption habits in the face of rising prices. When asked about their attitudes toward rising prices, the overall results showed that 55.9% felt the need to restrict their consumption due to high prices, while 17.9% said their consumption habits would not change even with rising prices (26.2% did not answer).
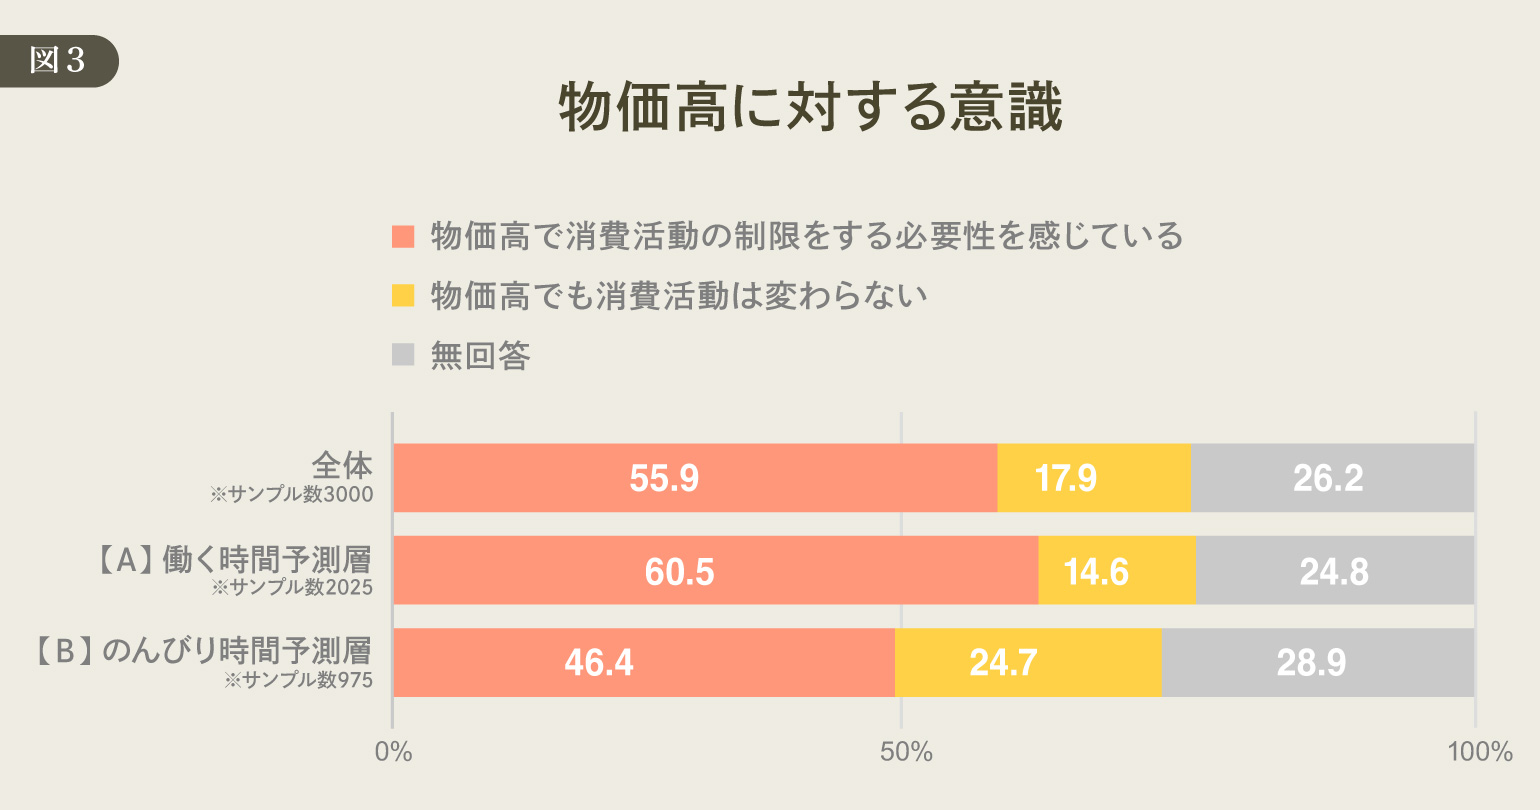
Among the “Work Hours Forecast” group, 60.5% responded that they “feel the need to restrict consumption,” which is about 5 percentage points higher than the overall trend, while 14.6% said “no change,” which is slightly lower than the overall trend.
In contrast, among the “Leisurely Time” group, 46.4% felt the need to restrict spending—about 10 percentage points lower than the overall trend—while 24.7% said their spending would remain unchanged, nearly 7 percentage points higher than the overall trend.
The proportion of people who feel the need to restrict their spending due to high prices is about 14 percentage points higher among the "Work Hours Forecast" group than among the "Leisurely Time Forecast" group.
The awareness of the need to reevaluate consumption, which is particularly evident among the "busy" group, may lead to practical actions such as adjusting purchase frequency, choosing where to shop, adjusting purchase quantities, or selecting substitutes—essentially, some form of "budgeting." On the other hand, the data suggests that a significant number of people in the "leisurely" group do not make major changes to their lifestyle even in the face of rising prices.
In other words, we can see a difference in attitude regarding the extent to which people view rising prices as a "catalyst for reevaluating their lifestyle" and how much they factor these changes into their daily management.
Do they check before buying? Differences emerge in how they use word-of-mouth and reviews
Next, questions regarding pre-purchase information-seeking behavior revealed distinct characteristics between the two groups. In response to the question, “Do you often check user-generated content such as social media posts and product reviews?”, the combined percentage of those who answered “Yes” or “Somewhat yes” was 47.9% overall. Among the “Work-Focused Time Forecasters,” this figure was 51.0%, while among the “Leisure-Focused Time Forecasters,” it was 41.7%.
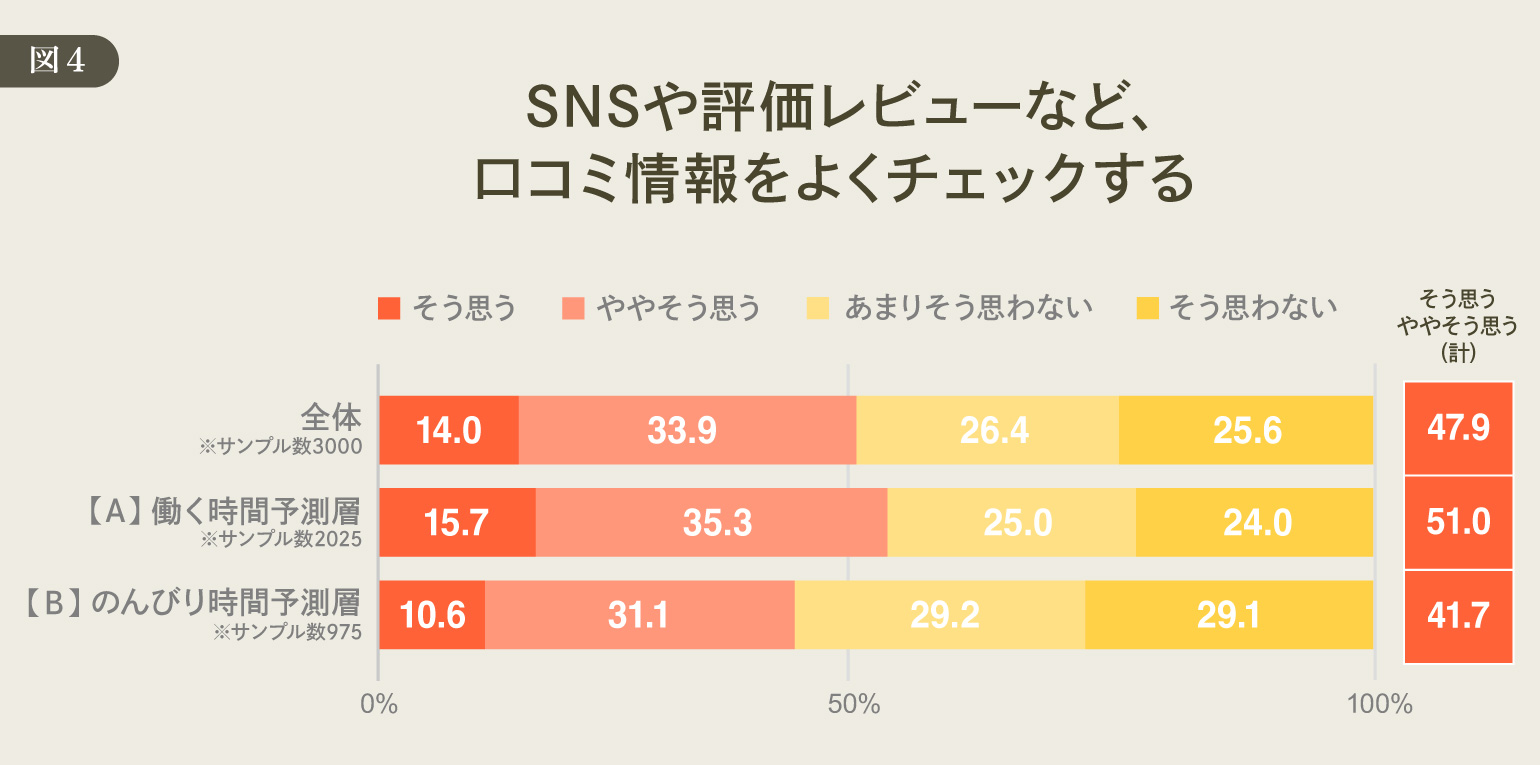
It is clear that the proportion of people who frequently check word-of-mouth information—such as social media and product reviews—is nearly 10 percentage points higher among the “Work-Focused Time Forecasters” than among the “Leisure-Focused Time Forecasters.”
This suggests an attitude of wanting to verify information before purchasing to minimize mistakes. Since the "Work-Time Forecasters" group—which includes a higher proportion of people considering adjusting their spending due to high prices—may consist of many individuals who want to gather as much information as possible and make informed choices for each individual purchase. Furthermore, the attitude of trying to adjust consumption in response to changes such as rising prices seems to align with an approach to shopping that involves thorough preparation, such as checking reviews and word-of-mouth information, to increase the basis for decision-making.
Regarding the responses to this question, considering the possibility that the differences in gender and age composition mentioned at the beginning might have influenced the results, we compared the two groups by gender and age. The results showed that even within the same gender and age group, the “Working Hours Forecast” group had a higher review-checking rate than the “Leisurely Time Forecast” group.
Summary: Perspectives on the "100-Year Life" Era Reflected in "Reevaluation" and "Verification"
What emerged from this data analysis was a trend showing that, depending on whether people perceive the 100-year life era as one where “working hours will increase” or “leisure time will increase,” there is a difference in the degree to which they feel the need to reevaluate their spending in the face of rising prices, as well as in the extent to which they check user reviews and ratings before making a purchase.The former group had a higher percentage of people who felt “restrictions are necessary” and a higher rate of checking reviews, while the latter group had a relatively higher percentage of people who felt “consumption habits will not change” and a lower rate of checking reviews.
This suggests that how people perceive the era of a 100-year lifespan may be reflected in their daily decision-making styles. In other words, it relates to whether they view changes like rising prices as an “opportunity to reevaluate their lifestyle” and how thoroughly they verify information before making a purchase.
While it is not easy for companies to directly grasp consumers’ perspectives, preparing multiple options for how consumers select products and services—tailored to their “approaches to reassessment” and “methods of verification,” which are likely to manifest as part of purchasing behavior—is considered an effective strategy.
For example, even during periods of rising prices, it would be beneficial to consider presentation methods that make it easier for each type to make a choice. Specifically, this involves organizing comparison points, making reviews easier to find, and clearly presenting information on price, quantity, and plan changes. Doing so will help reduce indecision among those who want to verify details and make an informed choice—a group that is common among the “Work-Time Predictors.”
On the other hand, by not overwhelming customers with too many options and clearly highlighting staples and recommendations, you can appeal to those in the “Leisurely Time Predictors” group who prefer not to make major changes to their lives. The key to design seems to lie in whether you can provide an “easy-to-decide experience” for both types of customers.
We need to support those who want to make informed choices by organizing comparison points and review pathways, while also ensuring that those who prefer to stick with “standard” options without major changes aren’t left feeling confused. In the market of the “100-year life” era, an experience that caters to both types of decision-makers appears to be the key.
[Survey Overview]
〈Overview of the 11th "Emotionally Driven Consumption Survey"〉
・Target Area: Nationwide
・Eligibility: Men and women aged 15–74
・Sample Size: 3,000 respondents total (allocated according to population demographics across 7 age groups—15–19, 20s–60s, and 70–74—and 2 gender categories)
・Survey Method: Online survey
・Survey Period: November 7 (Fri) – November 12 (Wed), 2025
・Survey Sponsor: Dentsu Inc., DENTSU DESIRE DESIGN
・Survey Agency: Dentsu Macromill Insight, Inc.
Was this article helpful?
Share this article
Newsletter registration is here
We select and publish important news every day
For inquiries about this article
Back Numbers

Author

Akane Yamada
Dentsu Inc.
Marketing Division 4
Born in 1989. Engaged in business development through backcasting from visualizing future lifestyles at Dentsu Group's cross-organizational unit "Future Business Research Institute." On weekends, a mom influencer. Enjoys deciphering trends and analyzing insights. Obtained a national certification as a Career Consultant during parental leave; also focuses on social contribution and career education initiatives that can be started today.