
Note: This website was automatically translated, so some terms or nuances may not be completely accurate.
 DENTSU DESIRE DESIGN's Approach to Marketing Reconstruction Based on "Theory of Desire" [36/40]
Amplifying the Excitement Surrounding Sports: Who Are the People Who “Play” Sports but Don’t “Watch” Them?

Rei Kato
Dentsu Inc.
Dentsu Inc. Desire Design (DDD) is an organization that develops various solutions and disseminates information based on the relationship between consumption and desire.
In this article, we will share insights and findings derived from the analysis of DDD’s 11th “Survey on Consumption That Moves the Heart,” conducted in November 2025 ( click here for the survey overview).
In this article, Rei Kato of DDD examines the relationship between engagement with "sports" and "desire."
<Table of Contents>
▼Is the current enthusiasm surrounding sports beginning to wane?
▼Surprisingly, even among people who “play” sports, there are those who don’t “watch” them
▼What is the difference between people who watch sports and those who don’t?
▼Using “Digital Reaction × Desire” to Give a Push to Those Who Don’t “Watch” Sports
▼Let’s reignite the passion surrounding sports
Is the enthusiasm surrounding sports starting to wane right now?
Sports have always been a form of content that easily generates excitement and attracts widespread attention. I, too, am one of those who watched the Milan-Cortina 2026 Winter Olympics and the FIFA World Cup, getting caught up in the excitement with family and friends.
On the other hand, scenes of gathering with family and friends to watch sports on TV or traveling to the venue to cheer together… haven’t those become a bit less common compared to the past?
In fact, there are quite a few people around me who play sports but don’t watch them.
I have over 10 years of competitive basketball experience dating back to my student days, and I still play on a corporate team. However, among my basketball teammates, there are some who don’t watch other sports—or even professional basketball league games.
In fact, according to a survey by the Sasakawa Sports Foundation, the “rate of watching sports on TV” was 92.8% overall in 2004 (97.0% for men, 88.7% for women), but by 2024, it had dropped to 79.0% (82.5% for men, 75.6% for women).Furthermore, the “rate of attending sports events at stadiums and other venues” was 37.1% in 2004, but dropped to 26.2% in 2024. Although it plummeted significantly due to the COVID-19 pandemic, it has not yet fully recovered.
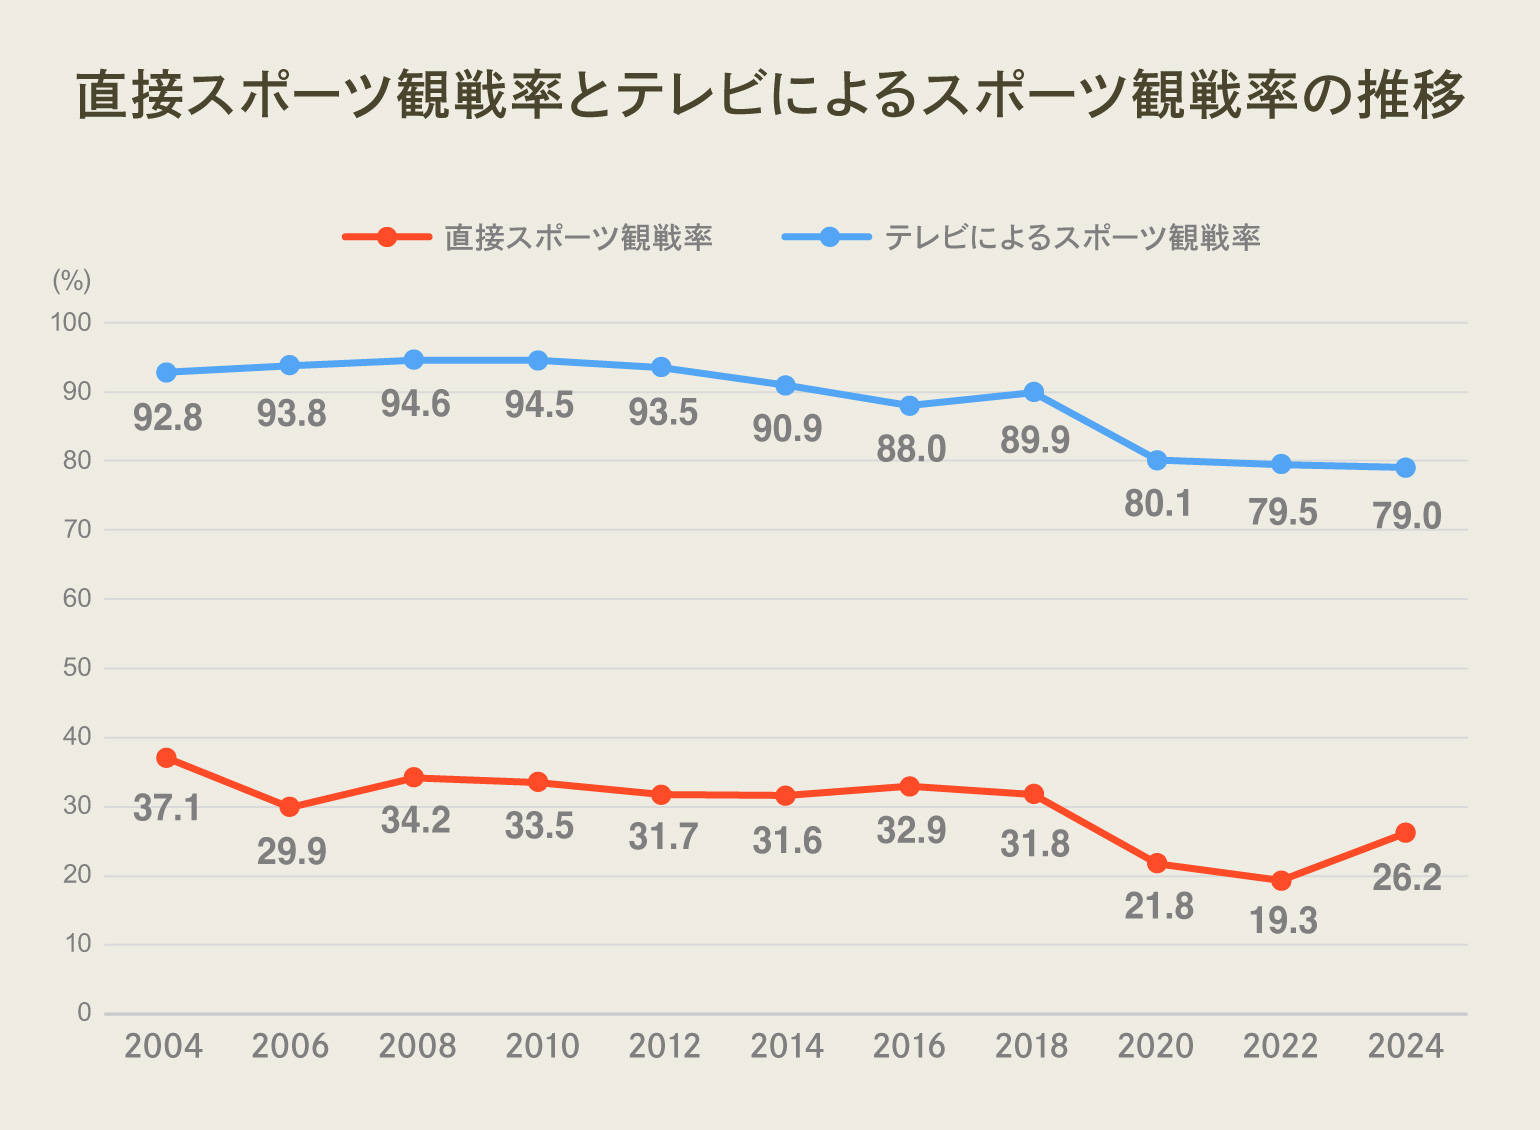
Gathering around the TV or heading to the venue to cheer together... What lies behind the decline in the number of people doing this? One possible factor is the proliferation of “digital content.”
With the rise of personalized viewing habits, we can now enjoy content anytime, anywhere on our devices. The sight of short videos being shared and spread through various media and social media has also become a part of our daily lives. Perhaps one reason for this is that people are increasingly prioritizing time efficiency and cost-effectiveness when it comes to enjoying sports.
On the flip side, however, isn’t the “excitement” that arises specifically from watching with others starting to fade?
This has led to the question: in this era of “digital content,” where can we find the “clues” to encourage those who do not currently watch sports? In this article, we will analyze this question from the perspective of the desires and values inherent in all human beings.
First, taking the observation that “there are people who have sports habits but do not watch sports” as our starting point, we will examine the survey results. In this analysis, we focused on the demographic with existing sports habits and based our analysis on the following survey items.
[Survey Questions]
● Habit of engaging in physical activity, such as exercise or sports, at least once a week
● Habit of watching sports at least once a week (including TV and online streaming)
By cross-referencing the responses to these two items, we divided respondents into four broad segments to identify their respective points of contact with sports.
In the following analysis, we will refer to those who “engage in physical activity such as exercise or sports at least once a week” as “active sports participants” and those who “watch sports at least once a week” as “sports spectators.”
Surprisingly, even among those who “play” sports, there are some who do not “watch” them.
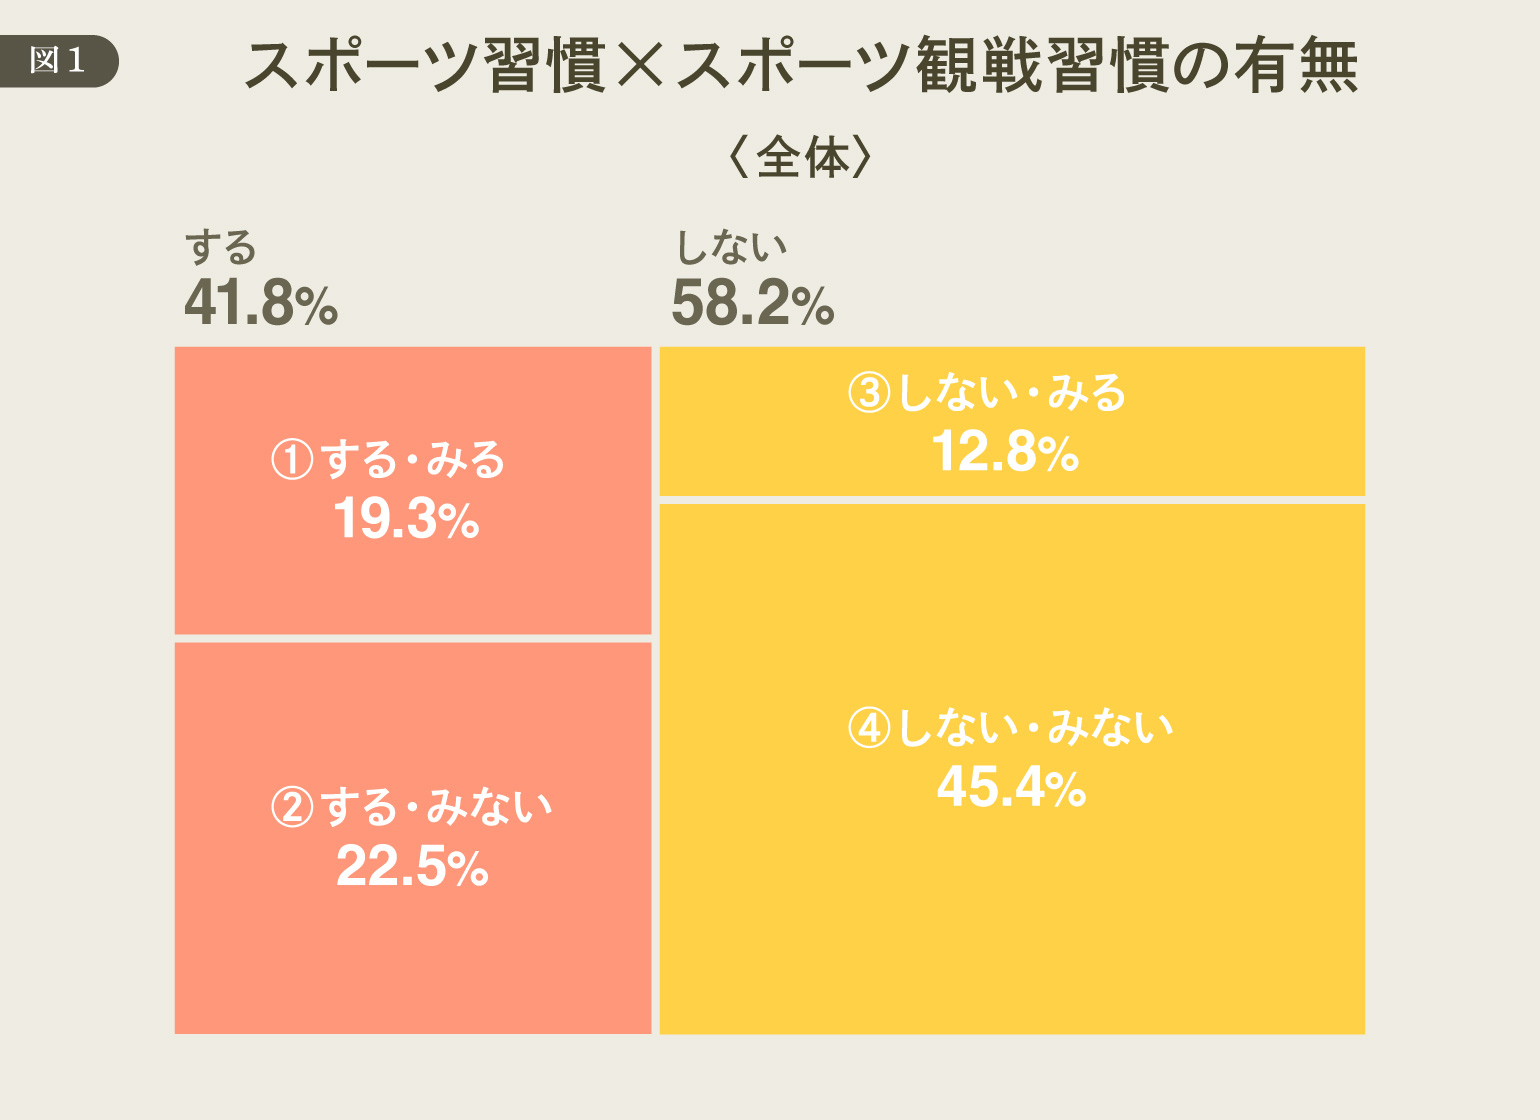
First, looking at the responses to the two questions mentioned earlier, the results showed that 41.8% of the total population are sports practitioners, while 58.2% are non-sports practitioners.
Furthermore, those who are both sports participants and spectators (labeled ① in the figure: “do/watch”) accounted for 19.3% of the total, while those who are sports participants but not spectators (labeled ② in the figure: “do/don’t watch”) accounted for 22.5%. In other words, even among people who play sports regularly, the number of those who watch sports content and those who do not is roughly equal.
Next, let’s examine the distribution by gender. The percentages for men and women shown in the figure below represent the proportions within each of the four segments in Figure 1.
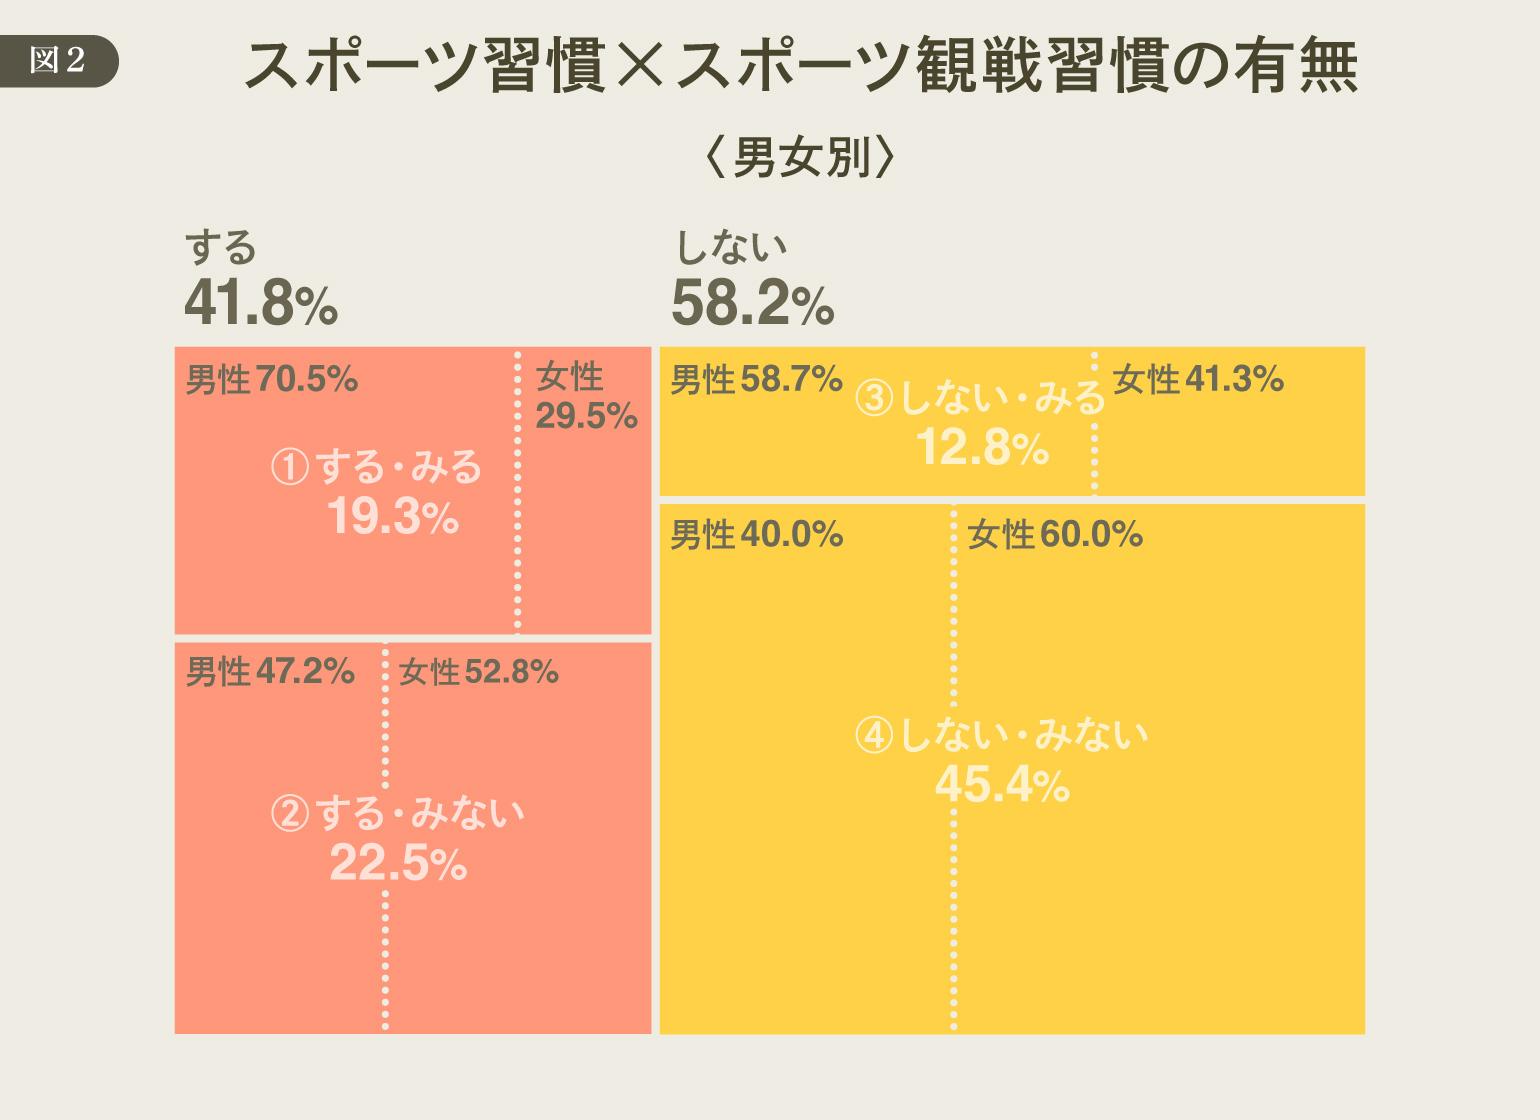
Men account for a significantly higher proportion of the “① Participate & Watch” group, and the same trend is observed in the “③ Do Not Participate & Watch” group, indicating that male sports viewers outnumber female sports viewers. On the other hand, women account for a larger proportion of the “④ Do Not Participate & Do Not Watch” group.
Next, we will examine the composition of these four segments when broken down by age group.
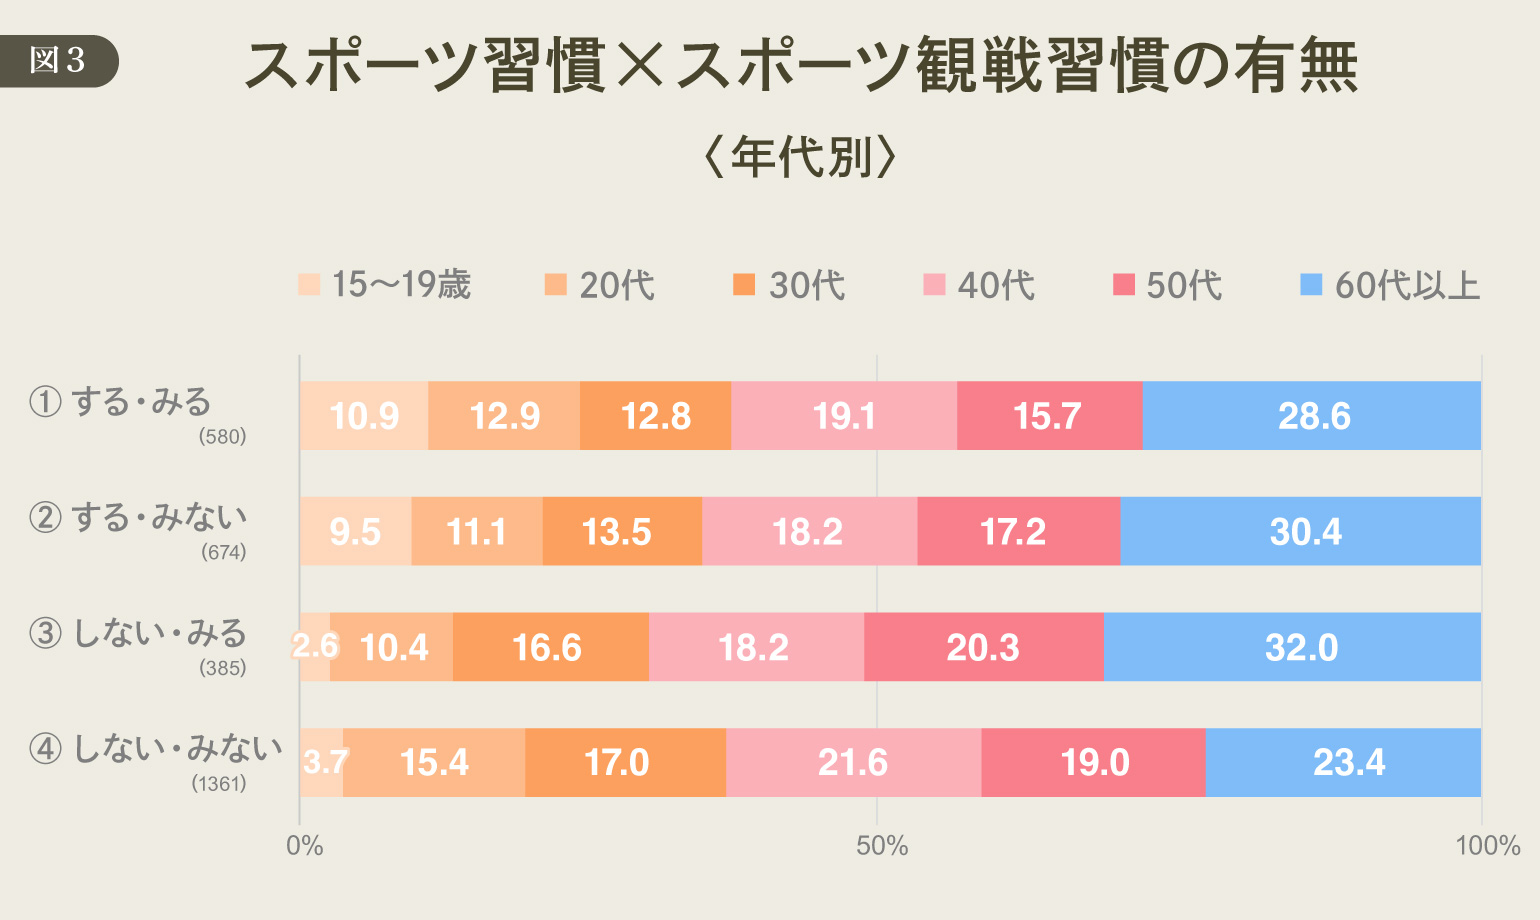
In terms of age-specific characteristics, the only group where regular sports viewers outnumber non-viewers by about three times is the teenage demographic. This likely stems from the fact that teenagers have more opportunities to engage with sports through physical education classes and club activities than other age groups.
What distinguishes those who watch sports from those who do not?
Next, we examined whether there were any characteristics or differences in the desires held by the four segments based on whether they had a “habit of watching sports.” In this analysis, we focused on those who engage in sports (the “doers”) and compared the responses of those who “watch” versus those who “do not watch.”
Here, we created a radar chart based on the results of questions regarding the presence or absence of desire factors related to the “11 Desires” proposed by DDD (Figure 4).
■ For more details on the “11 Desires,” please see here.
・ "Naming New Desires" (Web Dentsu-ho)
・DENTSU DESIRE DESIGN Announces the 2024 Edition of the “11 Desires” That Influence Human Consumption Behavior
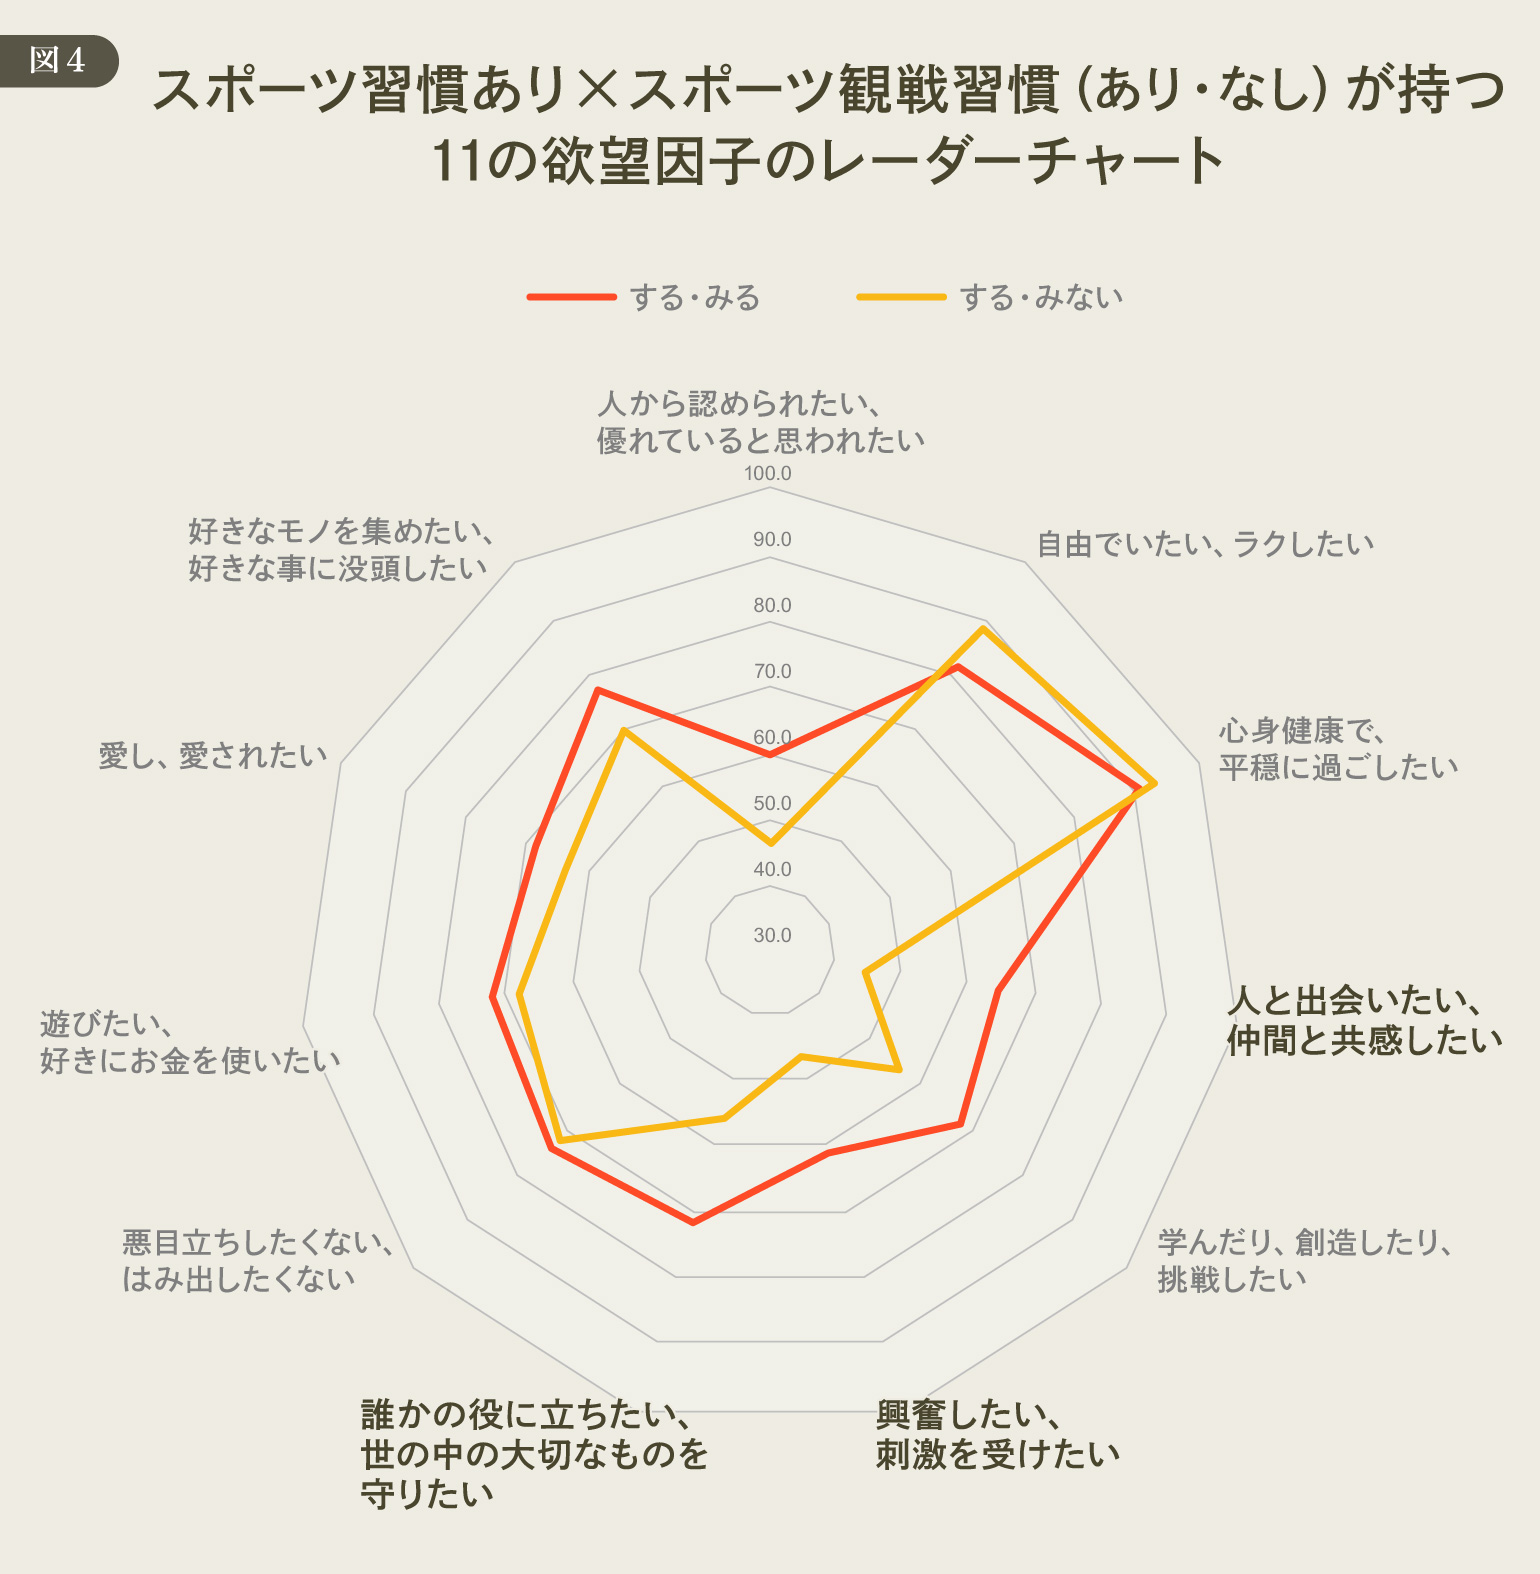
Looking at Figure 4, we can see that the scores for “Regular Athletes × Regular Spectators (Doing/Watching)” are generally higher.
In particular, the gap between the two groups is significant for the items “Want to meet people/share experiences with friends” and “Want to feel excitement/be stimulated.”
The “11 Desires” organized by DDD based on the 11 desire factors shown in Figure 4 are presented in the figure below.
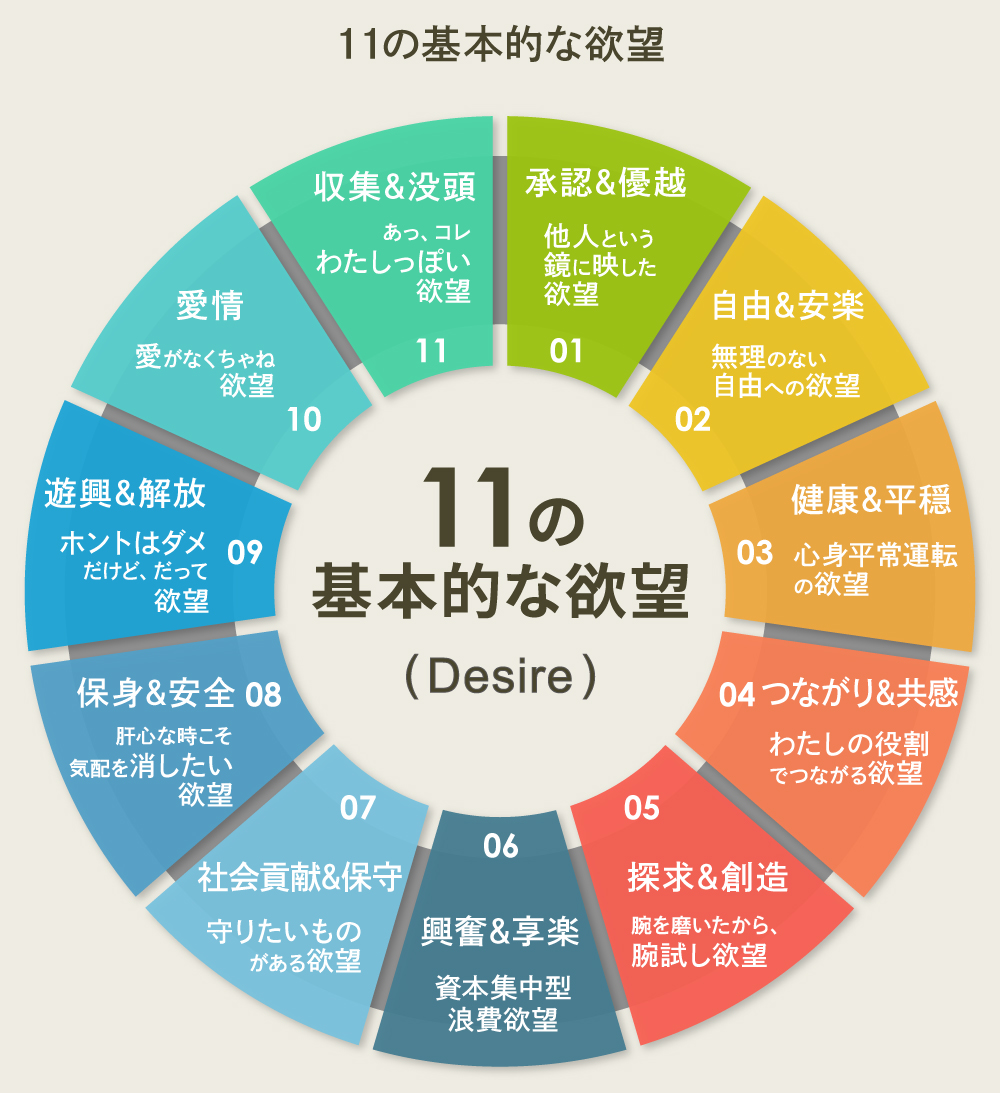
Mapping the desire factors mentioned earlier to each desire yields the following:
"Wanting to meet people and connect with others" ⇒ "04 Connection & Empathy"
"Wanting excitement and stimulation" ⇒ "06 Excitement & Pleasure"
In other words, when we take the average for those who regularly participate in sports and regularly watch sports (① do/watch), we can see that these two desires are strong, and there is a high receptivity to actions such as gathering together to watch sports and getting excited. On the other hand, we found that this is not as strong for those who regularly participate in sports but do not regularly watch sports (② do/don’t watch).
That said, this is merely a matter of score differences. There are certainly people within the “regular athletes × non-spectators” (② do/don’t watch) group who possess these two desires.
Using “Digital Backlash × Desire” to Give a Push to Those Who “Don’t Watch” Sports
So where can we find the “clue” to move non-sports viewers toward becoming sports viewers?
To unravel this answer, we focused on responses to questions regarding values unrelated to sports.
The following shows the combined percentage of people who answered “Agree” or “Somewhat agree” to each question.
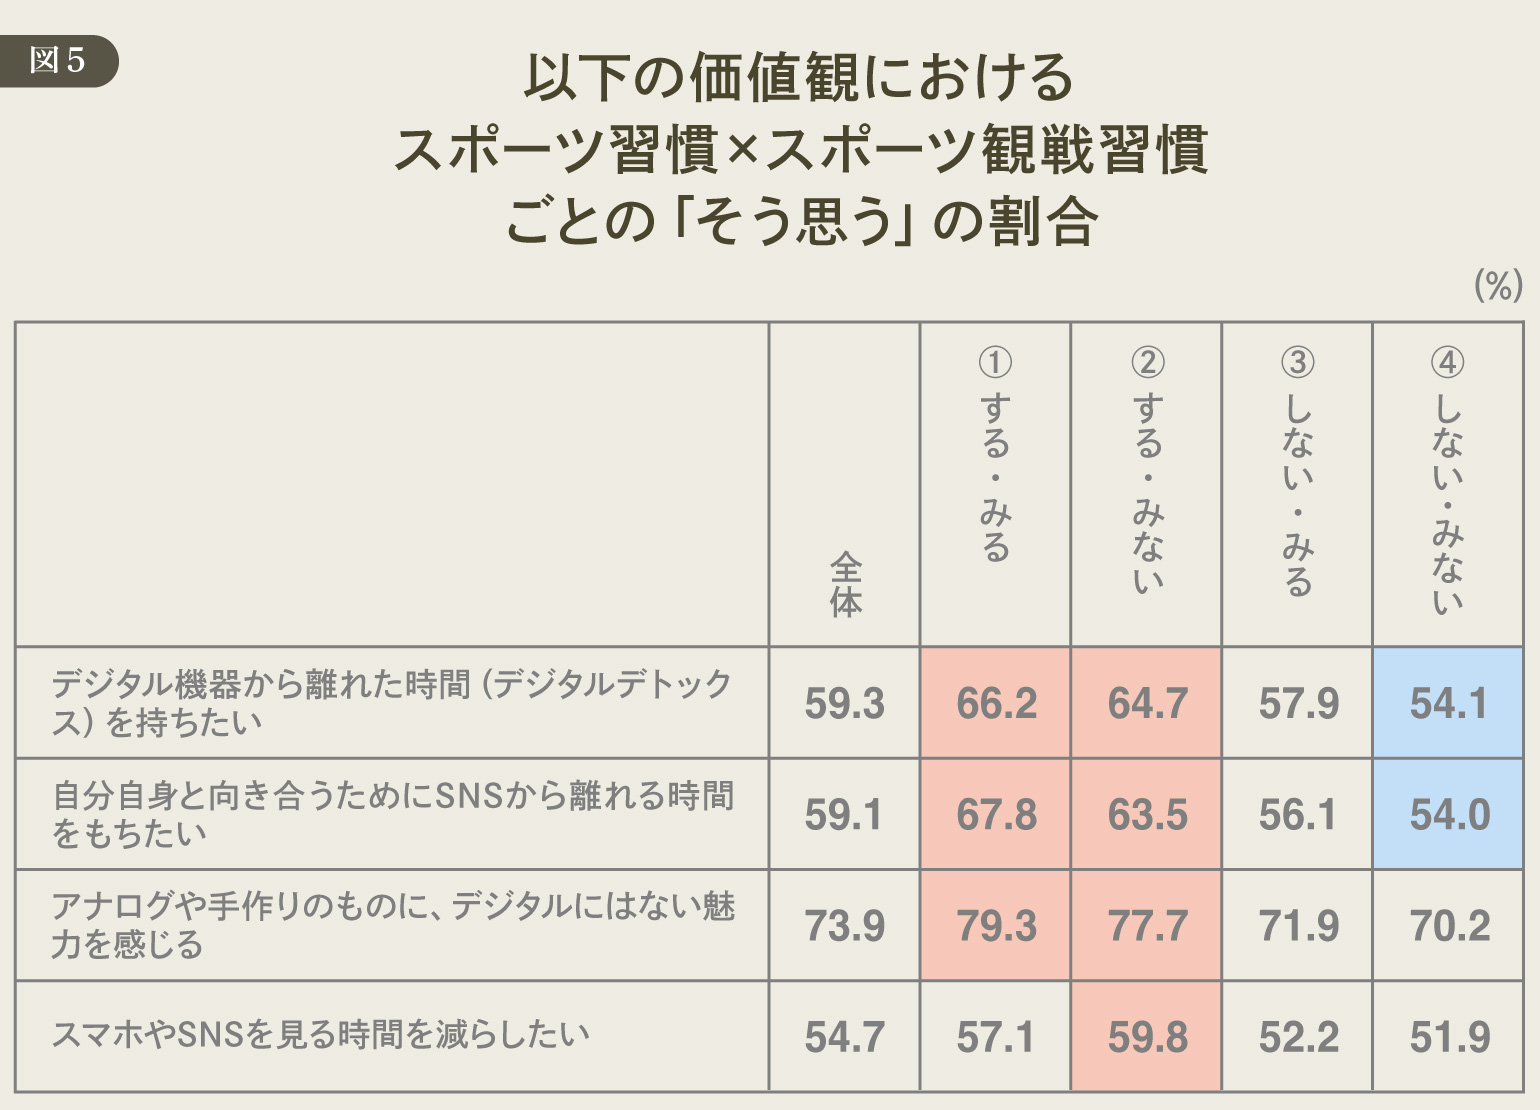
As a general trend, among the items that scored high for “Regular Sports Participants × Regular Viewers (① Do/Watch),” there are items that also scored high for “Regular Sports Participants × Non-Viewers (② Do/Don’t Watch).”
In particular, the items where both groups scored high were: “I want to have time away from digital devices (digital detox),” “I want to take time away from social media to reflect on myself,” and “I find analog or handmade items to have a charm that digital things lack.” This shows that both sports spectators and non-spectators share the value of wanting to disconnect from digital devices.
In the previous topic, we examined the differences between sports viewers and non-viewers from the perspective of the types of desires held by each group. However, what has been highlighted here is the commonality between the two groups: “digital detox.”
Of course, it would be difficult to convert every non-viewer into a viewer.
However, among those who do not watch sports, those seeking a “digital detox” may have the potential to take the step of watching sports.
When you think about it, sports and digital detox share similar values.
For example, during our school days, we’d get excited by bringing baseball player yearbooks to share with friends, visit stadiums or arenas to watch games live, or actually play games in parks or schoolyards… When we enjoyed sports in these ways, the presence of digital tools was likely minimal. And during the Showa era, when digital devices were much less prevalent in daily life, these activities were even more commonplace than they are today.
By reviving these physical, sensory ways of enjoying sports, we might spark an interest in spectating—and even get people moving—among those who currently do not follow sports.
Couldn’t this momentum also help fuel desires such as “04 Connection & Empathy” and “06 Excitement & Enjoyment”?
More of the Excitement Surrounding Sports
When you watch a game live at the venue, you can feel the excitement of the moment with your whole body. Furthermore, when you gather around a TV to watch a game with others, it sparks shared emotions and conversation. I believe these shared experiences, accompanied by physical sensations, represent the universal value that sports create.
While the value of watching sports is universal, given the advancements in technology, there is still great potential to expand the range of emotions and experiences we can derive from it.
As a sports enthusiast myself, I hope that sports will become a form of entertainment that captivates us all even more than it does today.
[Survey Overview]
〈Overview of the 11th “Emotionally Engaging Consumption Survey”〉
・Target Area: All of Japan
・Eligibility: Men and women aged 15–74
・Sample Size: 3,000 respondents total (allocated according to population demographics across 7 age groups—15–19, 20s–60s, and 70–74—and 2 gender groups)
・Survey Method: Online survey
・Survey Period: November 7 (Fri) – November 12 (Wed), 2025
・Survey Sponsor: Dentsu Inc., DENTSU DESIRE DESIGN
・Survey Agency: Dentsu Macromill Insight, Inc.
Was this article helpful?
Share this article


Newsletter registration is here
We select and publish important news every day
For inquiries about this article
Back Numbers
Author
Rei Kato
Dentsu Inc.
Associate Planner