The way people with visual impairments perceive their surroundings varies from person to person. However, it is difficult to describe these visual experiences in words, which can sometimes lead to misunderstandings in communication between people with visual impairments and those without.
To address these challenges, “VISIONGRAM” was developed—a tool that recreates visual experiences based on visual impairment test data. It creates visual filters that represent visual experiences through the size and density of dots, allowing users to easily experience and share them via smartphones or computers.
We spoke with Kazuhiro Shimura, Creative Director and leader of this project, about “VISIONGRAM,” which is already being utilized in various settings—including hospitals, university research institutions, and schools for the visually impaired—and is expected to see even wider adoption in the future.
What Do Visually Impaired People See? That Question Was the Starting Point for Development
――First of all, what exactly is “VISIONGRAM”?
Shimura: “VISIONGRAM” is an inclusive tool that allows users to recreate and share the visual experience of people with visual impairments.By entering test data from a person with a visual impairment on the website, the tool generates a unique visual filter that recreates each individual’s distinct visual experience using dots of varying sizes and densities. Through a smartphone or PC camera, anyone can easily experience what a person with a visual impairment sees right in their browser. Additionally, the data for the recreated filter can be shared via QR codes and other methods, making it easier for people with visual impairments to communicate their visual experience to others.
――Could you tell us how “VISIONGRAM” came to be developed?
Shimura: I’ve been involved in the “Voice Watch” project—an AI that generates real-time sports commentary to support people with visual impairments in watching sports—and have been working alongside individuals with visual impairments for about three years. ( Read the article on “Voice Watch” here.)
During that time, I often found myself wondering, “What does the world look like to people with visual impairments?” For example, on the way to a sports venue, when a “FM Fukuoka” sign came into view through the bus window, a person with a visual impairment once said, “Oh, that’s FM Fukuoka.”I also heard a story from a team member about how, when they were waiting to meet someone and waved, the person waved back. Based on these experiences, I began to think that the way people with visual impairments actually perceive their surroundings might be a little different from what we imagine.
Around the same time, I had the opportunity to interview a visually impaired para-athlete for another project. During the interview, it felt like we weren’t quite on the same page, and I eventually realized it was because I didn’t fully understand how the athlete perceived the world. So, I paused the interview and asked the athlete to thoroughly and carefully explain their “way of seeing.” When we resumed, communication flowed much more smoothly, and the interview became much more engaging.
To begin with, it’s difficult to describe in words how one sees the world, and it’s even harder because we can’t know how others see it. I also feel that there’s often an atmosphere where people around individuals with disabilities find it difficult to ask, “How do you see things?” That’s why I thought that if there were a new way to share what it’s like to see the world through the eyes of someone with a visual impairment, people with and without disabilities could understand each other better. And that’s how the “VISIONGRAM” project began.
My main focus was on making it “a tool that anyone can use easily.”
—How was “VISIONGRAM” developed? Also, please tell us how it represents the visual experience of people with visual impairments.
Shimura: As we explored how to recreate the visual experience, we focused on diagnostic data related to vision. Until now, data on visual impairments—such as visual acuity, visual field, and color vision—had been handled separately, but we wondered if we could recreate the experience by effectively integrating and utilizing this data.
So, with the cooperation of the Japan Blind Judo Federation—with whom Dentsu Inc. already had a relationship—we obtained a wealth of examination data on the Japanese national team that they had compiled for submission to international competitions. We also enlisted the federation’s team doctor for medical supervision and set out to use the power of technology to recreate visual experiences based on data from para-athletes.
As a result, using the “dot”—the smallest unit of an image or video—as our motif, we succeeded in expressing the unique visual impairments, visual acuity, field of vision, and color vision of each individual through variations in the number, density, and color of the dots. Thanks to the cooperation of so many people, we were able to complete the project in about a year.
An example of a Japanese national team athlete’s “VISIONGRAM.” By scanning the QR code with a smartphone or other device, you can experience each athlete’s VISIONGRAM.
――Please tell us what aspects you were particularly focused on during production.
Shimura: Our main focus was on creating a tool that anyone could use. “VISIONGRAM” can be easily experienced in a web browser using a smartphone, and it’s simple to share filtered photos and videos via QR codes or URLs. We didn’t want to create an expensive simulation device that would take years to develop; instead, we wanted to develop a tool that anyone could use easily and at any time. Therefore, we were thoroughly committed to ensuring the experience was accessible and easy to share on smartphones—devices that most people already own.
Another key point is that we created it in collaboration with people with visual impairments and ophthalmologists. Thanks to the cooperation of para-athletes—who have lived with visual impairments—we were able to gain genuine perspectives and candid feedback. Additionally, having ophthalmologists oversee the tool in real time allowed us to move toward completion with a sense of urgency.
Images of visual filters that recreate how each person sees the world differently
Use is expanding nationwide to hospitals, research institutions, and schools for the visually impaired
――“VISIONGRAM” was adopted as the official tool for the Japanese national team at the “IBSA Judo Grand Prix Tokyo 2023,” an international judo competition for people with visual impairments, and was launched at that time. What kind of response did you receive?
Shimura: At the “IBSA Judo Grand Prix Tokyo 2023,” members of the Japanese national team used “VISIONGRAM” to create business cards that communicated their unique visual experiences, and we set up a booth at the venue where visitors could experience what it’s like to see through the athletes’ eyes. Para-athletes also visited the booth, and it was a real hit. I also think that by helping able-bodied spectators visualize how the athletes see the world—realizing, “So this is how the athletes are competing”—it may have changed the way they watched the matches and cheered for the athletes.
After the launch, we began receiving inquiries from various sources asking, “We’d like to use ‘VISIONGRAM.’” A few months after the launch, we made the system publicly available so that anyone could create their own “VISIONGRAM.” By submitting an application, anyone can now create one, and we’ve currently received applications from over 140 organizations. The most common applicants are university medical schools, ophthalmologists, and schools for the blind. I was particularly surprised to see that more than one-third of all schools for the blind nationwide have applied.
――In what specific situations is it being used now?
Shimura: In the field of education, for example, we held experiential classes at schools for the visually impaired where parents and children created “VISIONGRAMs” together. In one class, the parent of a visually impaired student was so surprised they exclaimed, “So this is how it looked!” It made me realize once again that even within families, people often have surprisingly little understanding of how a visually impaired person actually sees the world. We’ve also conducted classes at elementary schools to help students experience what it’s like to have a visual impairment.
Furthermore, it’s being used in hospitals by doctors to explain visual perception to patients and their families. Since test data can be difficult to understand, it used to be hard for the general public to visualize what the patient’s field of vision actually looked like. By using “VISIONGRAM” to visualize visual perception in an easy-to-understand way, I believe communication with patients and their families will become much smoother.
――Please tell us about any new insights you’ve gained in response to the feedback, as well as your future prospects.
Shimura: A major insight gained through this project was the potential for using “VISIONGRAM” in schools for the visually impaired and in employment support. I was told that some teachers at these schools are unable to interpret visual impairment test data. One teacher shared, “I used to teach without knowing how my students actually see, but using ‘VISIONGRAM’ allows me to change my teaching methods.”I also heard comments such as, “When students can explain their own visual experience to employers, it leads to appropriate employment opportunities.” This made me realize that when you share an idea with the world, it can be useful or help solve problems in ways you never imagined.
In September of this year, I also gave a presentation at the “Japan Low Vision Society” conference, which was attended by ophthalmologists and vision therapists from across the country. The presentation sparked interest not only among medical professionals but also among many experts, including representatives from NPOs supporting people with disabilities and medical device manufacturers. It was an opportunity that gave me a strong sense of the potential of “VISIONGRAM” and its future possibilities.
Currently, we are working with companies to explore and develop the next iteration of “VISIONGRAM” through a process of trial and error. We will continue this project so that we can spread it to even more people.
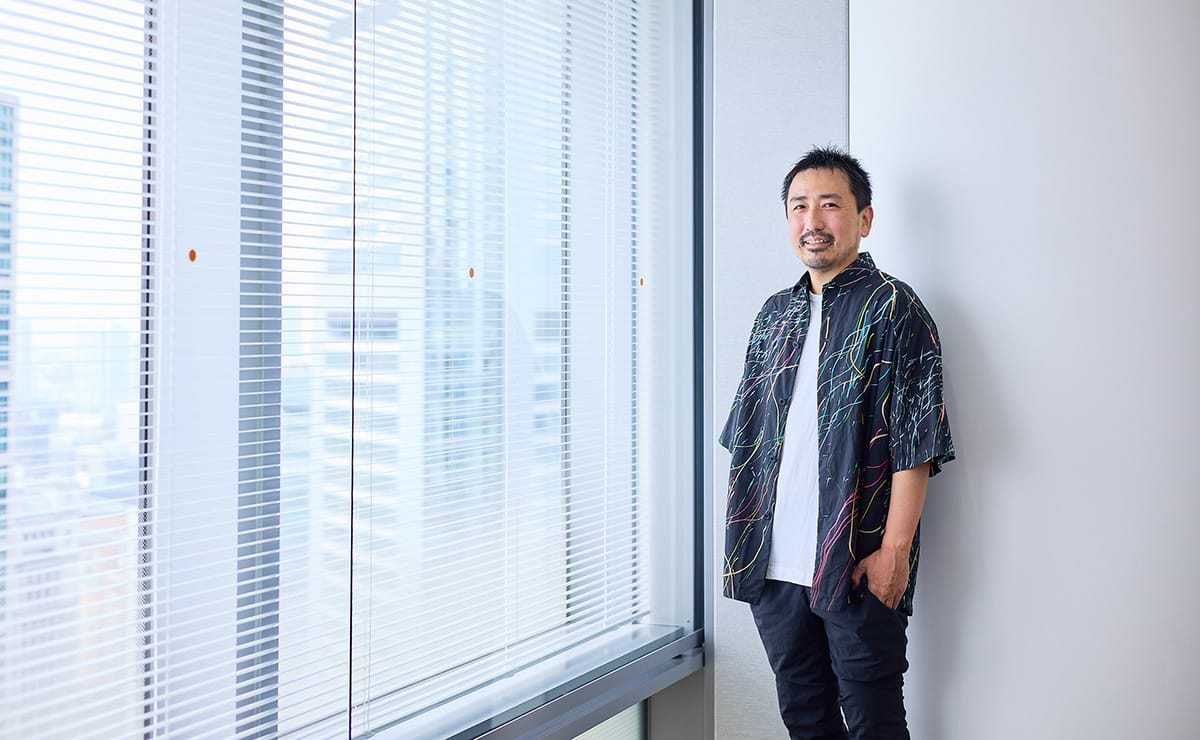
He majored in biotechnology at the University of Tokyo Graduate School. Currently, aiming to expand the scope of creativity, he works not only on brand communication but also on service and product development, experience design, and solving social issues. He has received numerous domestic and international awards, including Cannes Lions, The One Show, Clio Awards, D&AD, ADFEST, Spikes Asia, London International Awards, New York Festival, ACC Awards, and the Good Design Award. He has given lectures and served as a judge at events around the world, including Cannes Lions. In recent years, he has also spoken at the World Tuna Conference.