Note: This website was automatically translated, so some terms or nuances may not be completely accurate.
Let's simplify complex statistics! "Japan's Advertising Expenditures" Edition
Amidst back-to-back meetings, mountains of unread emails, and endless presentation prep, I found myself endlessly scrolling through ever-changing social media feeds... This time, for readers so busy they forget even such moments, we introduce skills for quickly interpreting statistics – essential in business.
Mr. Toshiyuki Kitahara from DENTSU SOKEN INC. Media Innovation Research Department provided an explanation using the "Japanese Advertising Expenditures" report released on February 23rd as a real-world example.

Complex numbers should be simplified!
――You mentioned "skills for quickly deciphering statistics." What's the most important point?
It's about interpreting them "simply."
――Ha ha, the answer is simple too (laugh).
Hmm, is that so...?

For example, with large numbers—like big figures or surveys with many matrices—you need to commit some time to read every detail thoroughly. But depending on the issue or required output, there are cases where you don't actually need to catch up on all that detail. It's important to have the literacy to interpret down to the minimum unit that makes sense for the needs at hand.
――M-make sense units and literacy, huh... I see... By the way, how would you put that more simply?
...Hmm, let's see. Well, let's look at "Japan's Advertising Expenditures."
The breakdown by media in 2015 was as follows:
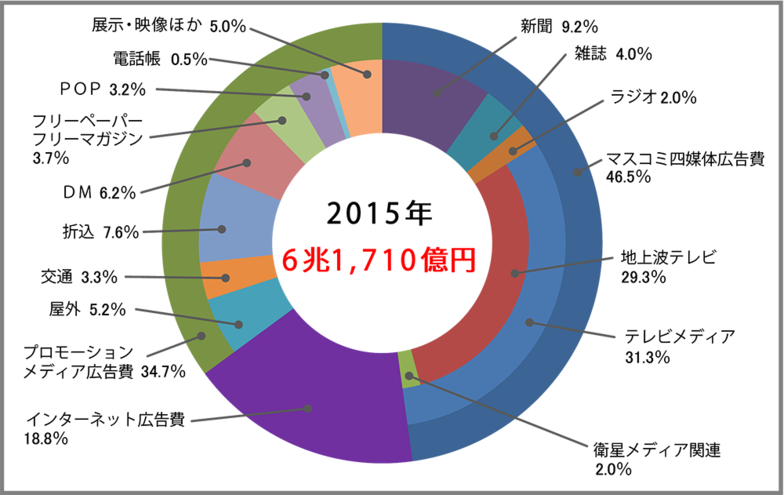
This pie chart should be easy to understand, but it has so many metrics packed in that it's hard to grasp at a glance, right?
――Yes, definitely. There are so many different items that it's hard for me to grasp at a glance...

Yeah, I know.
In cases like this, simplifying the whole thing when you're memorizing it makes it quicker to decipher. I doubt you can visualize it, so I'll write it out for you. Simplification... it's tricky if you're not used to it.
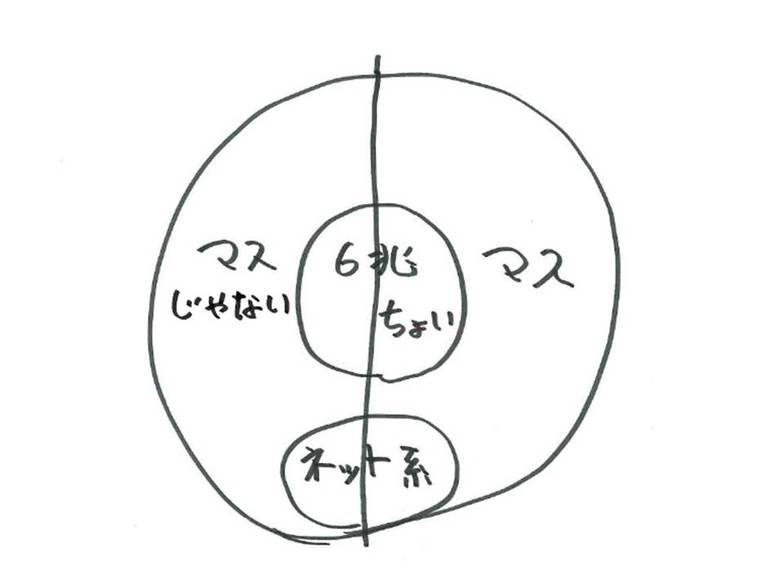
――Um... This is actually way too rough... I mean, is this even a pie chart...?
Eh, it's easy to understand, right...?

――Ah... yes! It's super simple! S-simple, this is what you mean, right?!

Yeah, that's right.
You should memorize important numbers through visual impact!
――Any other key points?
Yes, the next important thing is to leverage visual impact. Impactful visuals create deep memories, so you won't need to keep revisiting the statistics.
—Ah... so you mean deep impact... What does that mean specifically?
Here's how we've summarized the 2015 internet advertising expenditure and its trend since 1997.
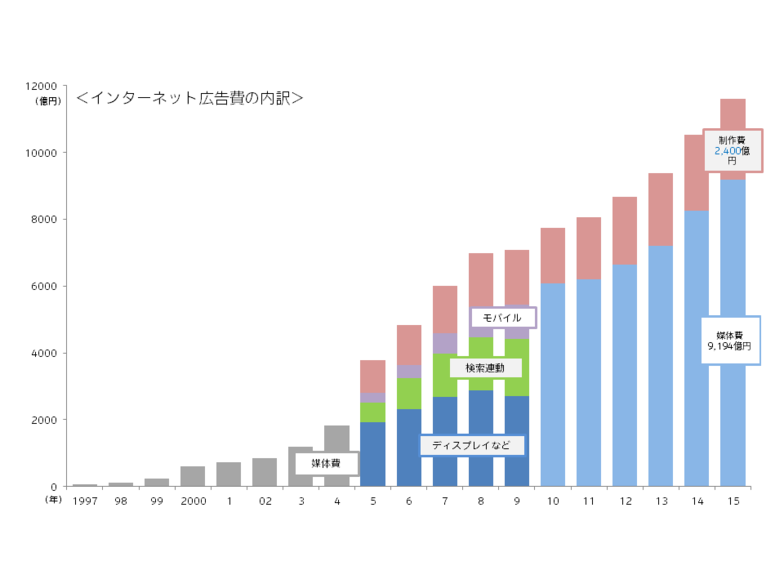
While it's easy to imagine the total amount rising each year, the crucial figure is the latest number. It's actually quite hard to grasp exactly how much 2015 was.
――Yeah, you're right.
So, let's isolate just 2015. Media costs were ¥919.4 billion, and production costs were ¥240 billion. Roughly speaking, that's a 5:1 ratio.
――Quick math.

Yeah, I guess so.
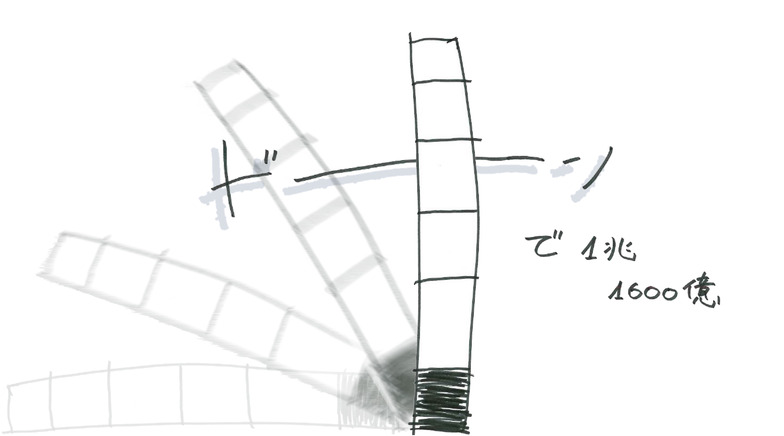
Now, let's turn this into a truly impactful visual. First, the ratio of media costs to production costs is like this. It's much easier to understand when you see it as a picture.

――Oh... I see...
And adding media costs of 919.4 billion yen and production costs of 240 billion yen gives us 1.1594 trillion yen. Roughly 1.16 trillion yen. How about that? Pretty quick math, huh?
――Haha, I can do addition like that too (laugh).
Eh, really...?

Well, never mind. Anyway, getting back to the theme, we'll perform this Ray Show image with an agile feel and dynamic energy, so even someone like you can easily and as soon as possible input how much the total expenditure will be. Okay, here we go.

And so...

Like this...
Like this, see.
"Sss... Sss... BOOM! For 1.16 trillion yen." Easy to remember, right?
――Hmm, wait... that's true... "Swish... swish... BOOM! That's 1.16 trillion yen" somehow sticks in your head, doesn't it? Even though it's just the side diagram turned upright... No, wait, but this isn't hand-drawn to begin with, right? It's Photoshop or something, right?
No, the point isn't to draw it freehand. It's purely to graphically retain the numbers in your head, so you can recall and utilize them more easily. That's the goal.
――The last part was practically pure English...

Yeah, I guess so.
――Thank you so much today! It was memorable in the opposite sense, I guess... Ah, no, it was just really easy to understand!

Yeah, I guess so...
Mr. Kitahara's explanation of "Japan's Advertising Expenditures," which avoids katakana terms and provides proper explanations, can be found here.
Was this article helpful?
Share this article
Newsletter registration is here
We select and publish important news every day
For inquiries about this article
Author

Toshiyuki Kitahara
Dentsu Inc.
Dentsu Inc. Media Innovation Lab
Principal Researcher
After working in the Information Systems Department and the Management Planning Department, he joined the Research and Development Department. He has held his current position since 2011. Engaged in research on mass media and communication, consulting for media companies, organizational and personnel system consulting, and advertising and related market/industry trend research. Responsible for "Japan's Advertising Expenditures" in the 'Information Media White Paper'. Author of numerous books and papers, including 'Information Innovators: Leaders of the Co-Creation Society' (co-authored, 1999, Kodansha). Also engaged in various surveys and projects related to newspaper companies, primarily regional papers.
Articles by this person

What's the true intent behind the "Declaration to Quit Mass Media"? The current state of local media. Special Discussion: "Japan's Advertising Expenditures in 2024"
