Note: This website was automatically translated, so some terms or nuances may not be completely accurate.
"Experience Metrics and Business Outcomes" Continuously monitor the level of customer experience and drive the PDCA cycle.

Takashi Asaoka
Delight Design Co., Ltd.

The final installment of the "Experience Design in the IoT Era" series.
When companies engage with experience as part of their management strategy, it naturally becomes necessary to correctly measure and evaluate it, establish an organizational structure capable of running the PDCA cycle, and adopt the mindset of "managing experience."
After introducing a service plan to resolve customer pain points (moments of frustration or disappointment), it is crucial to determine whether it is actually effective. If the effect is insufficient, the root cause must be identified. Continuously monitoring the level of experience and maintaining the PDCA cycle becomes indispensable.
The Net Promoter Score (NPS) is gaining attention
So, what specific metrics should be used to measure experience? A well-known one is the "Net Promoter Score" (NPS), proposed by Frederic Reichheld in 1993 and published by Bain & Company and Satmetrix Systems in 2003.
NPS is a metric developed from customer recommendation intent. It asks respondents on an 11-point scale (0 to 10) how likely they are to recommend a company, product, or service to others. Respondents scoring 9 or 10 are defined as "Promoters," 7 or 8 as "Passives," and 6 or below (including 0) as "Detractors." NPS is calculated by subtracting the percentage of Detractors from the percentage of Promoters.
Example: If "Promoters" make up 50% of the total and "Detractors" make up 20%, the NPS is "50-20" = 30 points.
Theoretically, the highest possible score is 100 points, and the lowest is -100 points. Since NPS is a harsher metric for companies than traditional customer satisfaction surveys, it is common for a company with 90% customer satisfaction to score -30 on NPS.
Therefore, it is generally known that a high NPS score often translates into economic impact (company growth). Companies with high NPS scores tend to have "higher revenue per customer" and, in the case of membership-based services, "longer customer retention periods." This is highly persuasive when considered alongside examples of companies achieving business success by leveraging the power of customer "recommendations" and "reviews" in their marketing, riding the wave of social network development in the Marketing 3.0 era (e.g., Nike, GoPro).
The True Nature of "Bad Revenue" Plaguing Companies
However, the author's experience reveals that the reality unfolding in the market is not so simple, and this trend is likely to persist. Try compiling your company's recommendation intent scores (on an 11-point scale from 0 to 10) alongside customer annual revenue data (purchase amount per transaction × purchase frequency), then calculate the contribution rate using simple regression analysis. You will likely be surprised by how low that contribution rate score is.
Why is this? It is true that customers with relatively high recommendation intent (promoters and passives) are confirmed to be heavy users of the brand. However, you will simultaneously notice that unexpectedly many heavy users are found among the critics, specifically those at the lowest level of recommendation intent (those scoring 0 to 2 on the recommendation scale; i.e., detractors).
This is the group of customers often referred to as "bad sales." They have experienced numerous disappointments with the company's services and, based on their recommendation scores, are classified as critics of the brand. Yet, the barriers to switching brands are high, and they reluctantly remain with the brand.
How should companies assess the existence of this "bad revenue"? One passive approach might be to "leave sleeping dogs lying." This might suffice when market fluidity is low and there is no threat of substitutes. However, companies must be prepared for the risk that, the moment market fluidity rapidly increases due to deregulation or similar factors, these "bad revenue" customers will suddenly switch brands en masse.
What the "9-Cell Analysis of Recommendation Intent and Revenue" Reveals
Given this context, how should companies manage customer experience now that we've entered the Experience 4.0 era?
The author presented the "9-Cell Analysis of Recommendation Intent and Revenue" [Figure] at the Experience Seminar "Experience-Driven Marketing: From Implementation to Effectiveness Verification" hosted by the Japan Marketing Association in June 2015.
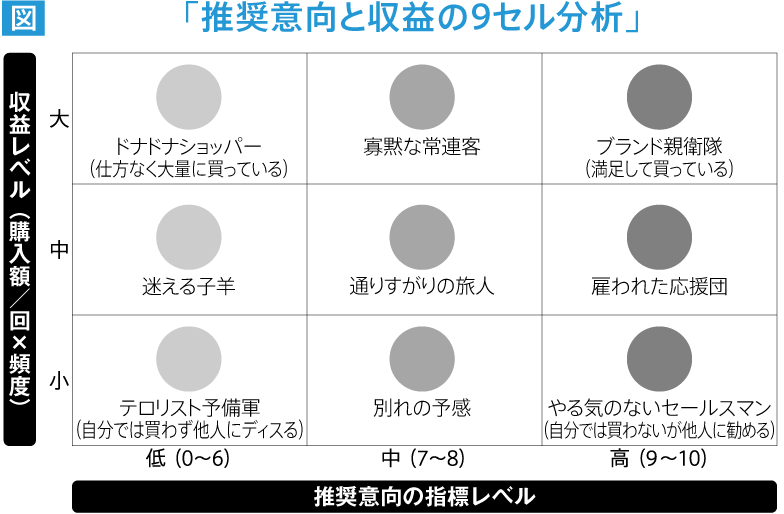
The vertical axis plots revenue per customer (sales) as the economic effect, while the horizontal axis plots recommendation intent. Both axes are divided into 3×3 = 9 cells. By examining what percentage of customers fall into each cell across the entire brand, companies can understand the state of the brand they provide.
Naturally, the most desirable state is having a high percentage of customers in the top-right cell, where both revenue and recommendation intent are high.
Furthermore, assigning catchphrase-like copy to each cell—such as "Brand Guardians," "Unmotivated Salespeople," "Don't-Don't Shoppers," or "Terrorist Recruits"—helps deepen understanding of these customer personas. Whether the catchphrases accurately represent the personas as intended requires verification by examining the relationship between the company's services and its customers.
Regarding the vertical axis of revenue, even for membership-based services like airlines or mobile phones, it currently requires cross-referencing customer behavioral data (sales, membership duration, etc.) with asking data (recommendation intent). However, at the Experience 4.0 stage, which assumes Experience × IoT services, it should be possible to more simply link the relationship between the scores of both.
Let's examine the time-series changes in customer ratios across the nine cells. If providing rich experiences increases customer loyalty, and this manifests in business results, the relative ratio of customers in the upper-right cell should grow.
Comparing customer distribution across cells between competing brands and your own brand will also reveal your brand's strengths and weaknesses. At a minimum, the 9-Cell Matrix should be analyzed in detail at least twice a year, with the insights gained reflected in revising experience design strategies.
Analyzing the factors driving recommendation intent, and further analyzing how much improvement in recommendation intent (in percentage terms) would lead to how much improvement in which cell's customers, and how much this would translate to sales, should enable setting management goals and business numerical targets based on this.
Doing so will significantly enhance the alignment between business strategy and marketing strategy, while also increasing transparency. Inevitably, this will elevate experience-driven marketing from intuition to science.
Was this article helpful?
Share this article
Newsletter registration is here
We select and publish important news every day
For inquiries about this article
Back Numbers


Author
Takashi Asaoka
Delight Design Co., Ltd.
After leaving Dentsu Inc. in 2016, he founded Delight Design Inc. A consultant specializing in experience design. During university, played baseball for the University of Tokyo team as a player and manager. Joined Dentsu Inc. in 1985. Engaged directly with client company executives, providing solution-based services that leveraged Dentsu Inc.'s signature right-brain approach to deliver business and brand consulting. Served as head of the brand consulting division before assuming current position. Certified Marketing Master Course Meister by the Japan Marketing Association (JMA) (2011–present). Author of "Dear Prime Minister: This is the Prescription to Revitalize Japan" (Toyo Keizai Inc., co-authored, 2008), "Experience-Driven Marketing" (First Press, 2014), and "Experience Design in the IoT Era" (First Press, 2016).