Note: This website was automatically translated, so some terms or nuances may not be completely accurate.
Methods for Creating Customer Journeys That Visualize Customer Emotions
This time, we'll delve into the details of the "customer experience management solution" mentioned last time.
First, regarding the term "digital marketing," it is often discussed solely in terms of marketing activities confined to digital channels or digital advertising alone. In this series, we consider digital marketing to be something that elevates even real-world marketing activities.
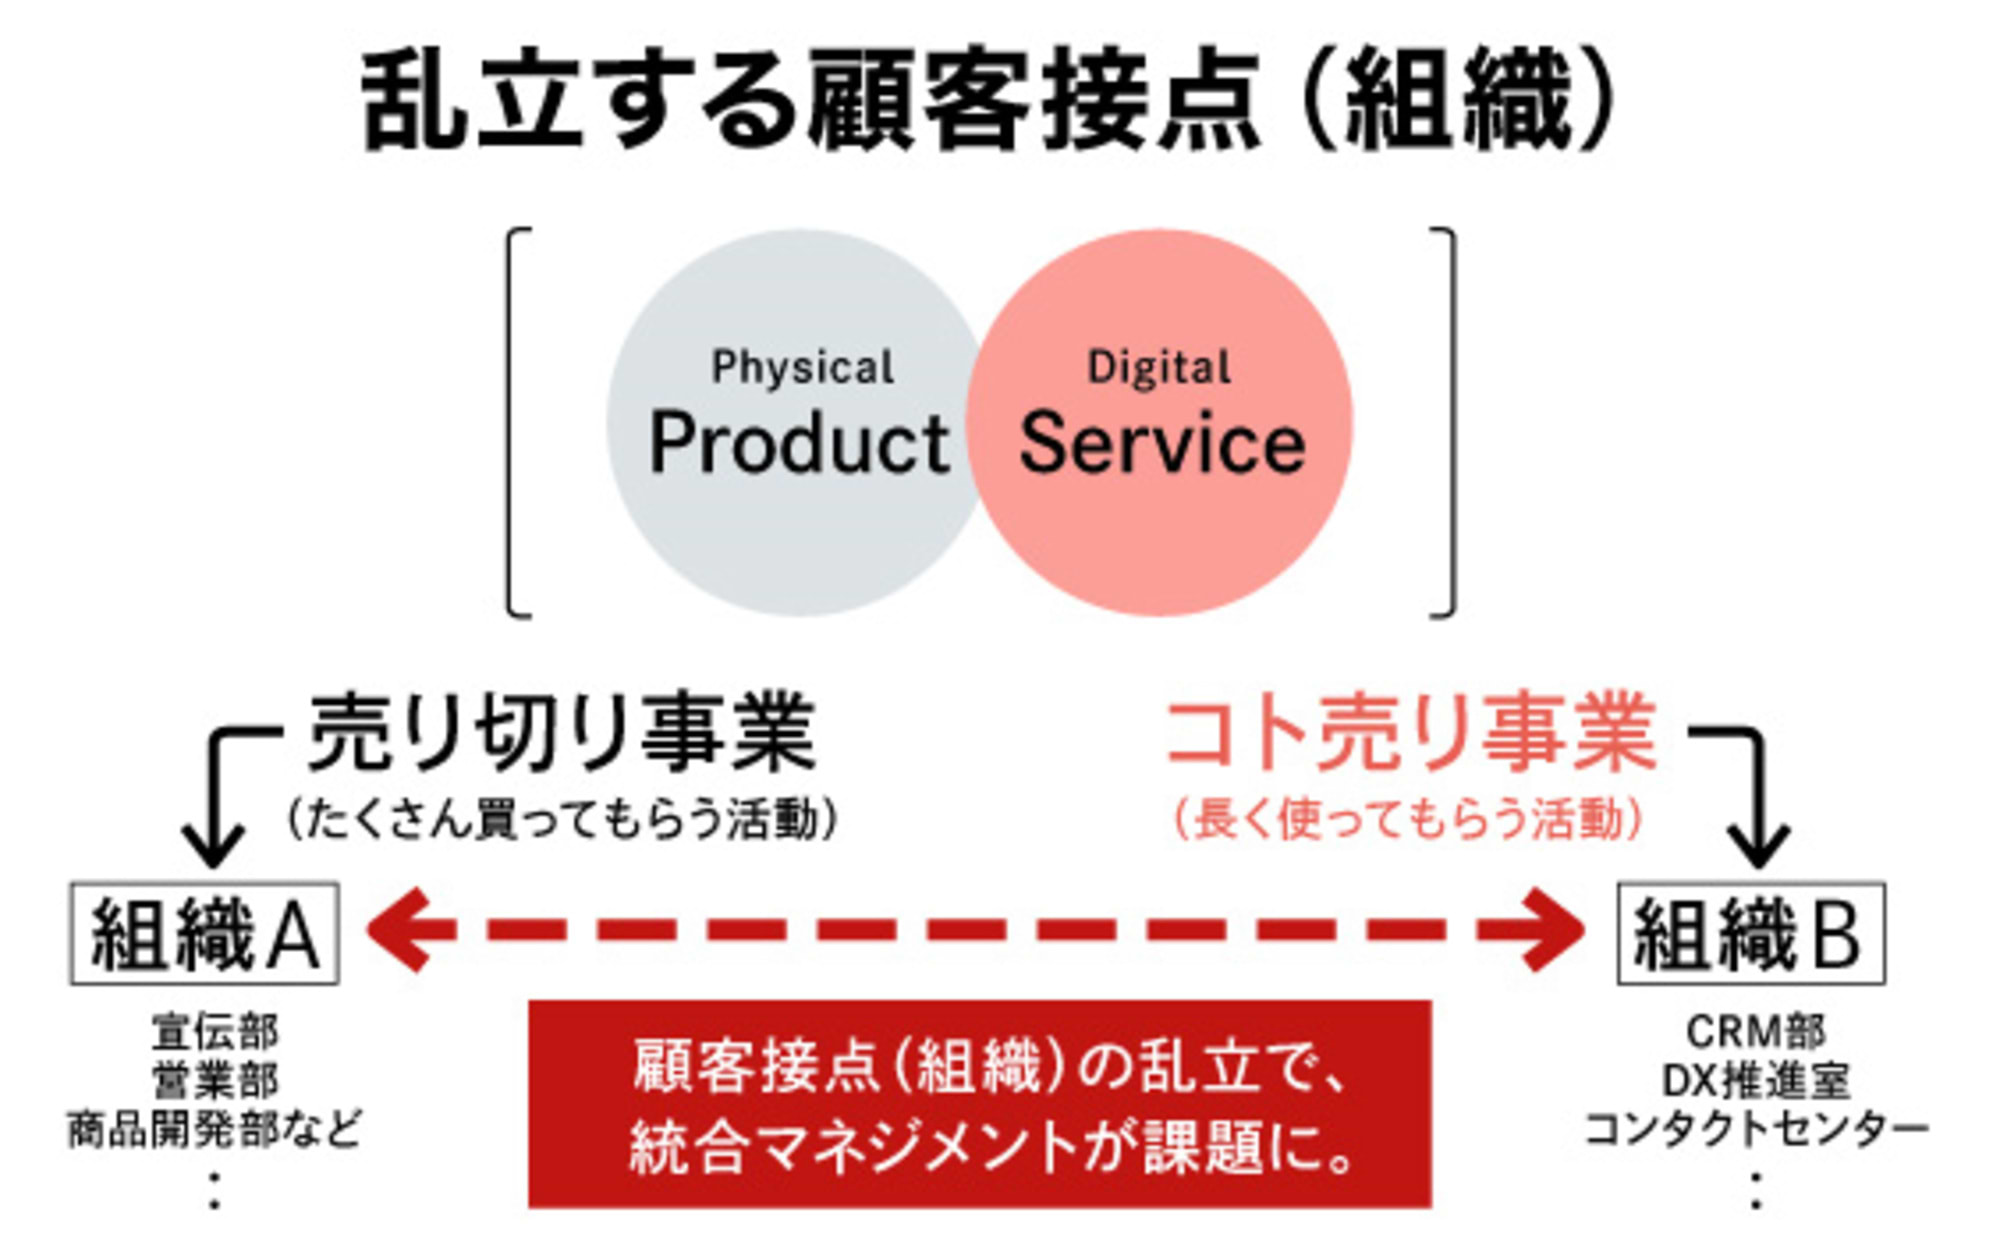
Within this framework, we have developed and offer the "Digital Transformation Support Service" with Emotion Tech Inc. This service evaluates the "broad customer experience of the services" provided by companies through both physical and digital customer touchpoints. We analyze customer experience value, identify challenges in a company's service delivery, and then propose solutions leveraging digital and IT. This time, we introduce this analytical approach, including case studies.
Common Pitfalls in Creating Customer Journeys
When developing services, it's common to create a "customer journey." While there are various approaches to mapping this journey, the most prevalent method likely involves gathering stakeholders in a workshop format, where participants share opinions and collaboratively build the journey.
What consistently strikes me as odd is how these journey maps often include wave-like graph frames labeled "customer feelings" or "customer motivation" along the customer's path. At each point along this path, the transition of customer emotions is roughly sketched freehand.
In other words, what exactly are "feelings" or "motivation"? And what is the "scale" on the graph's vertical axis?
What's more, these graphs are often created qualitatively without a clear definition of what "feelings" or "motivation" actually represent, or what the vertical axis of the graph is measuring. Consequently, despite investing significant man-hours in workshop-style sessions, the resulting journey maps often lack clear cost-effectiveness for implementing concrete measures. This frequently leads to a situation where the process ends with just creating the journey map...
Visualizing Customer Experience Value (CX)
The concept of our "Digital Transformation Support Service" is "visualizing customer experience value," meaning "visualizing customer sentiment." By quantitatively grasping customer sentiment, we support clarifying the validity of measure execution and investment effectiveness.
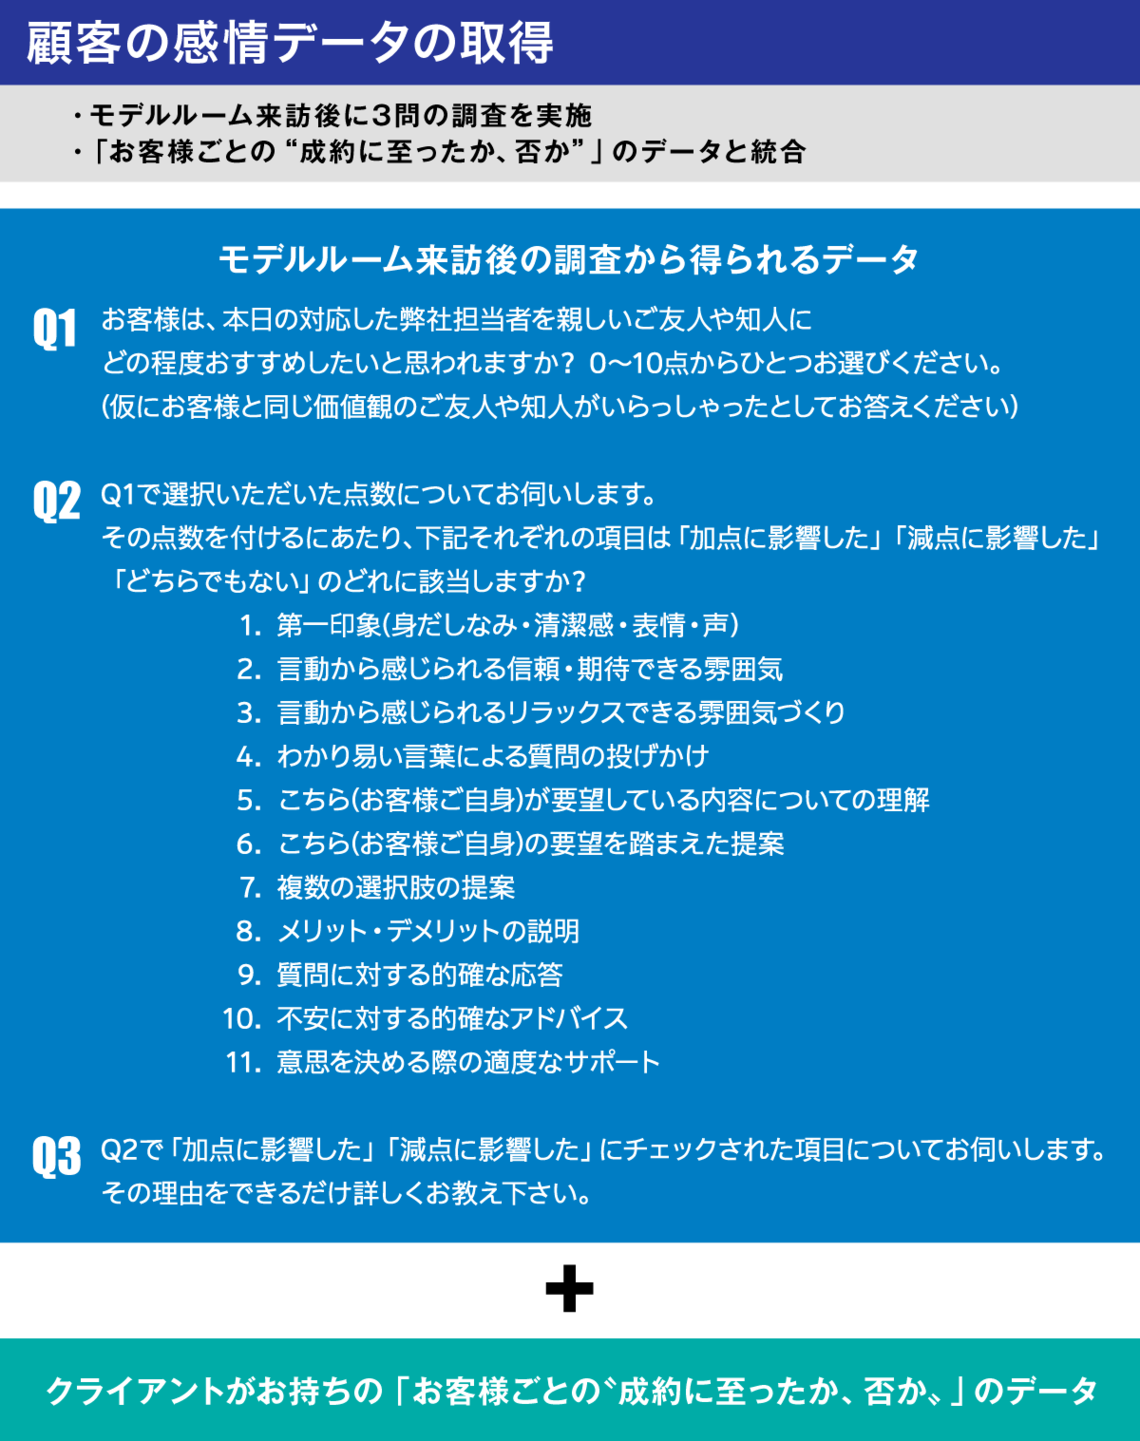
Now, let's explain the "Digital Transformation Support Service" in detail. The CX survey used for visualization differs from typical CS (Customer Satisfaction) surveys in the number of items. The CX survey fundamentally consists of only the following three items:
① Overall Service Recommendation (Score 0–10)
② How each of 11 service scenarios influenced the overall recommendation score (positive impact, negative impact, or neutral)
③ The reason for that impact (free comments)
The reason for the limited number of CX survey questions is that analysis is feasible with just these three items. Additionally, since continuous monitoring of service improvement results is anticipated, it is necessary to minimize the burden on customers as much as possible.
As an example, consider a case study from a real estate brokerage (apartment division). The company employs approximately 1,500 people. Facing increasing competition in recent years, they sought to improve their sales activities. To clarify challenges and improvement points in sales operations, they conducted a three-question survey of prospective customers after model room visits. This data was later analyzed alongside actual closing data.
First, using contract data as the dependent variable and the recommendation rate from Q1 as the independent variable in a simple regression analysis, we found that a 1-point increase in the recommendation rate leads to a more than 1.4-fold increase in the contract rate. Next, we analyzed what actions increase the recommendation rate.
We quantified the responses to Q2 ("Influenced positive scoring," "Influenced negative scoring," "Neither") as 0 and 1. Then, we performed a quantitative analysis of type 1, using the recommendation rate from Q1 as the dependent variable and the 11 sales service scenarios from Q2 as the independent variables. This allowed us to visualize the impact of each scenario on whether the recommendation rate increased or decreased.
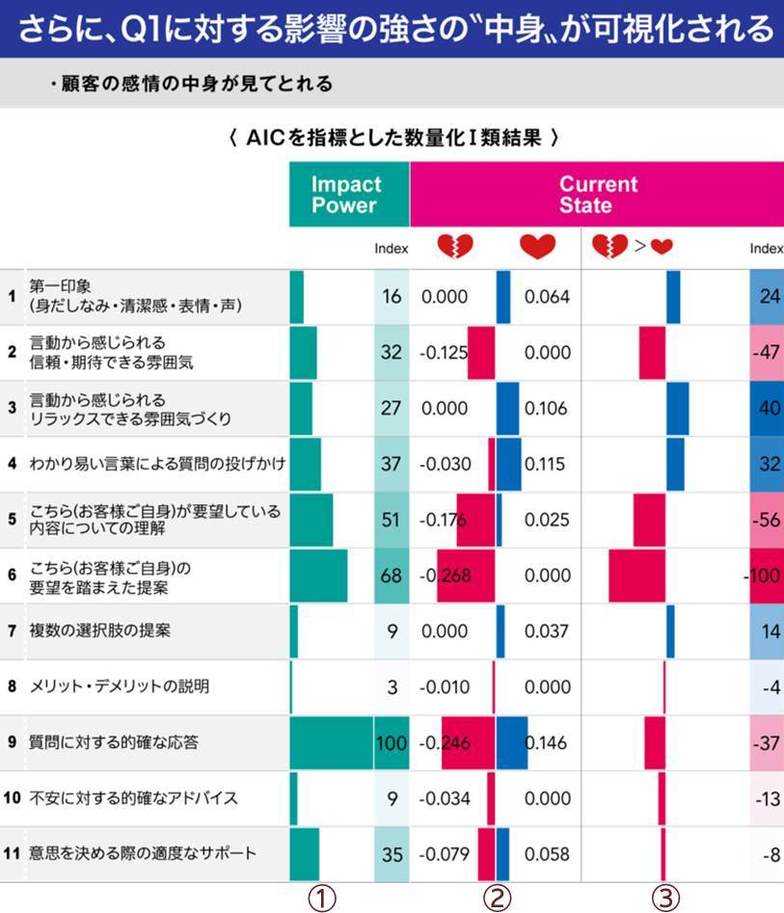
The graph labeled ② in "Current State" in the figure above shows the positive and negative impact power of each scene on recommendation. The graph labeled ① in "Impact Power" shows the absolute value index of the positive and negative impact power. The graph labeled ③ in "Current State" shows the difference between the positive and negative impact power and its index. ① indicates the degree to which a factor "is likely to influence customer recommendation, for better or worse." ② indicates the degree to which a factor "actually represents a net positive or negative impact on recommendation."
When this result is visualized in a customer journey format, it appears as shown below.
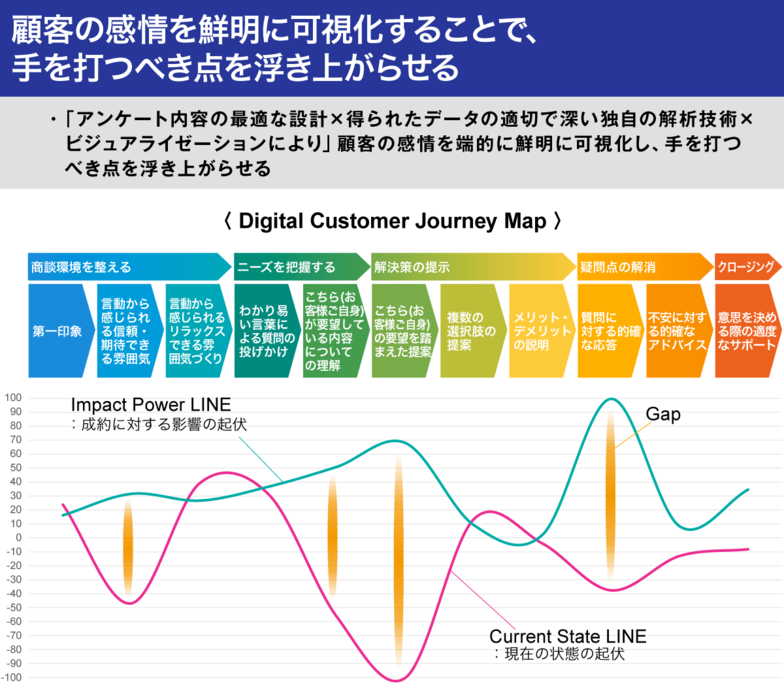
The horizontal axis represents each scene along the timeline of the service provided by the company (in this case, sales service). The vertical axis shows the impact level on recommendation, which correlates with closing deals. The green curve graph indicates ①, the "strength of the impact on customers, for better or worse," while the pink graph indicates ③, the "actual strength of the impact."
Looking at these results, the service scenes for CX Survey Q2-5 ("Proposals based on the customer's own requests") and CX Survey Q2-6 ("Accurate responses to questions") are activities that have an impact on customer recommendation. Yet, despite this, they received negative evaluations.
To understand why these activities received negative evaluations, we utilize the open-ended responses from Q3 of the previous survey. We also subjected the open-ended responses to text mining, quantified them, and used them as explanatory variables. We then performed the same quantitative analysis on Q2 as the target variable. This allows us to identify, within the open-ended responses, the specific reasons that particularly influenced the evaluations. In this analysis, we found that reasons such as "Proposals not tailored to the customer's needs" and "Talking about things the customer didn't ask about" were causing negative impact.
Through such analysis, it becomes possible to identify the points in time where customer experience value is compromised and to estimate, to some degree, the results achievable by improving these points.
Therefore, to address the "lack of customer understanding" evident in this case study's results, we are advancing the implementation of digital marketing initiatives introduced in the previous article. These support appropriate sales activities by deepening sales staff's customer understanding.
We are tackling "visualizing customer sentiment" through methods like these. While customer journey mapping is often discussed in somewhat intuitive, right-brain terms, we hope this incremental, layered approach can also serve as a useful reference.
Furthermore, as long as the services a company provides span both digital and physical channels, "digital marketing" does not refer solely to marketing activities confined to the digital realm. Furthermore, while digital marketing can easily become technique-centric, it's crucial to first focus on customer experience challenges. Solving these challenges requires not just techniques, but also improvements to business processes and even organizational restructuring. Consequently, initiatives that use IT and digital to solve such challenges are now often referred to as "digital transformation," distinct from "digital marketing."
In future installments, we will introduce frameworks designed to support this digital transformation.
*Several output frameworks based on the survey methods and statistical analysis techniques introduced fall within the scope of patents currently being applied for by Emotion Tech.
Was this article helpful?
Share this article
Newsletter registration is here
We select and publish important news every day
For inquiries about this article
Author

Takashi Uozumi
Dentsu Consulting Inc.
Executive Officer, Partner
Consistently engaged in supporting clients' digital transformation of marketing operations. Early focus on the potential of big data and cloud computing, leading to numerous solution developments, consulting engagements, articles, and presentations leveraging these technologies. Currently active under the theme of "Building New Relationships Between Companies, Customers, and Employees." Certified Management Consultant.