Note: This website was automatically translated, so some terms or nuances may not be completely accurate.
Log data reveals the current state of smartphone usage
The Information Media White Paper, with over 25 years of history, was published again this year on February 21.
To commemorate its release, we present a serialized feature on each theme from the opening special section of the 'Information Media White Paper 2018': "Smartphones: A Decade of Creative Destruction."
This year marks the 10th anniversary of the iPhone's launch in Japan. Over these past decade, smartphones have driven "creative destruction" within the media business landscape. Smartphones have profoundly transformed existing media, making it impossible for any information media to operate without being smartphone-centric.
What has changed, and what has remained unchanged during this period?
Based on insights from Dentsu Inc. Media Innovation Lab's proprietary research, I, Akira Miwa of the Lab, summarize this decade that triggered tectonic shifts across various media and markets.
The Reality of Smartphones Revealed by Log Data
Part 1 introduces the current state of smartphone usage based on log data from the INTAGE i-SSP Mobile Panel. INTAGE's data includes information from iPhones, which dominate the Japanese market.
"Launch" refers to when an app, such as LINE, is opened to the front of the smartphone screen upon receiving a notification. We counted as "launches" only logs where the app was consciously opened, excluding background-running apps as much as possible.
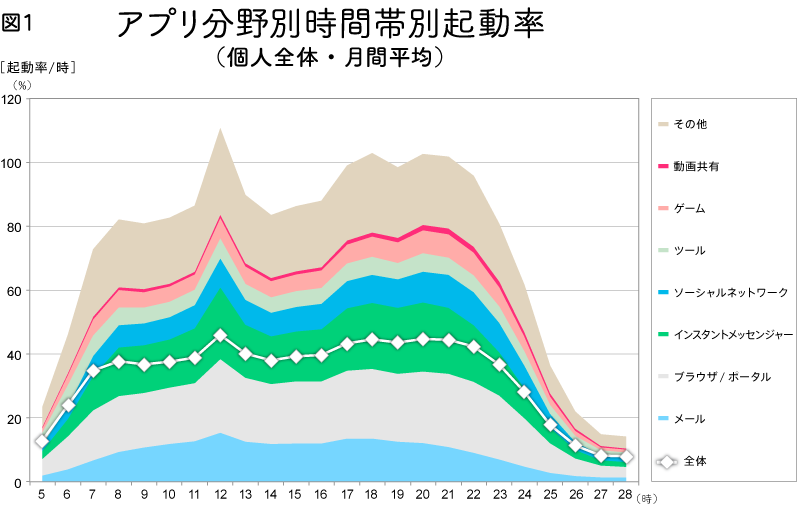
The launch rate indicates the percentage of people who launched a smartphone app at least once during that one-hour period.
We compiled app usage log data from the devices of over 10,000 panel members for the entire month of January last year.
This data first reveals that about 40% of people launch an app at least once per hour throughout the day (since only logs from apps communicating via the internet are counted as "launches," the actual launch rate is likely even higher).
The peak occurs during lunch breaks, with another significant surge in the evening during the prime time hours of 7:00 PM to 10:00 PM, when television viewing is high.
The gray browser and the yellow-green instant messenger above it show consistent daily usage. The thicker light blue line above them represents social networks. Games show a distinct pattern of higher usage in the evening.
What activities would you witness if you boarded a commuter train?
Having grasped the daily biorhythm of app usage, the next point of interest is the actual usage patterns during commutes and school runs in Japan, a country with extensive train travel.
This was a survey conducted last December, not log-based. While log data shows which apps were launched and when, it's insufficient for understanding the TPO (time, place, occasion) of users—for example, where they were—and thus for gaining a comprehensive view of their lives.
In terms of catching a glimpse of a slice of life, survey-based research has its own merits. To show the reality of users captured in specific life scenes – at school? Eating in the cafeteria? With friends? Alone? – we'd like to share key insights from the results of a survey focusing on one such scene: commuting and going to school.
We surveyed people who commute by train at least once a week. We asked: "During your commute, how many days do you use your smartphone, for what purposes, and for how long?" We also asked how many days they engage with non-smartphone media like "advertisements," "video displays," or "books."
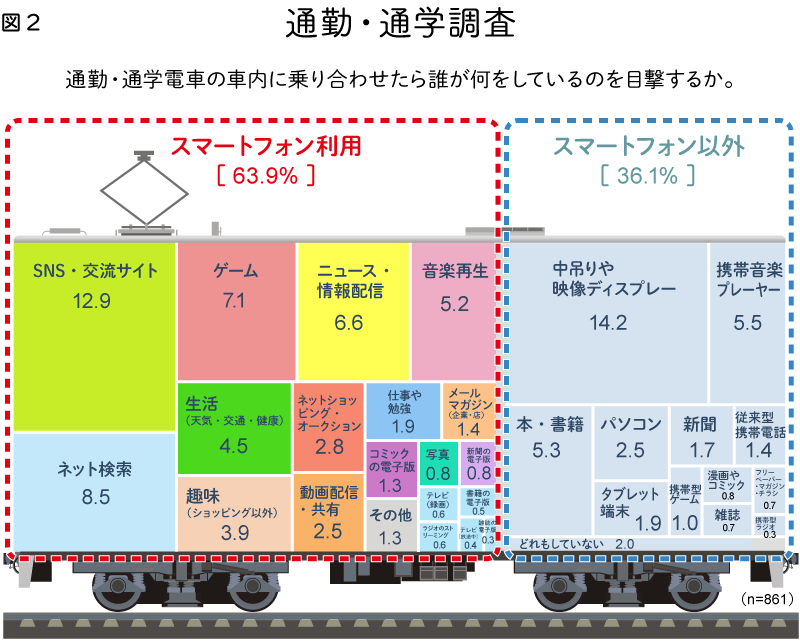
Some respondents do nothing or nap, so some answered they do none of these activities. This chart shows the weighted average, calculated by applying weights based on the number of commuting days and one-way commute time, then dividing back. It illustrates "What do you witness when riding the train?" with one train car set as 100 (sample size: 861).
The first thing noticeable when looking at the chart is that smartphones have become the major activity during commutes (63.9%). Time spent on activities other than smartphones accounts for 36%.
Breaking down smartphone usage further, social networking sites like SNS are the most common (12.9%), followed by searching (8.5%). This trend aligns with the previously mentioned log data.
Next are games (7.1%), followed by news and information consumption (6.6%). Music playback (5.2%) is noted with a caveat: respondents were asked to report only time spent consciously listening to music.
Viewing traditional 1seg mobile broadcasts is quite low (0.4%). While the decline in TV viewing among younger people is noted, this could lead to a situation where broadcast content struggles to reach a large audience. This connects to discussions about simultaneously streaming TV programs online to reach those who no longer watch traditional TV (this theme will be explored in more depth in future installments).
Was this article helpful?
Share this article
Newsletter registration is here
We select and publish important news every day
For inquiries about this article
Author

Akira Miwa
Dentsu Inc.
Dentsu Inc. Media Innovation Lab
Director of Media Innovation Research
Since joining the company, I have primarily conducted research and studies in the fields of information and communications, digital devices, and content at DENTSU SOKEN INC. I have also worked on building business visions and providing consulting services for both public and private sector clients. My responsibilities have spanned a wide range of areas, from cameras and robots to e-books. From July 2012, I worked on projects related to information media in general within the Media Innovation Research Department. I have held my current position since November 2015.