Note: This website was automatically translated, so some terms or nuances may not be completely accurate.
9 Principles for Designing Excellent "Data Products"
frog

This article presents content originally published in "DesignMind," a design journal operated by frog, translated by Transmedia Digital under the supervision of Mr. Noriaki Okada of Dentsu Inc. Experience Design Department.
"Data products" (*) are everywhere. From smartphone route search apps to recommendation systems on e-commerce sites, experiences enabled by user data are becoming increasingly personalized and logical. However, unique challenges are also emerging alongside this.
(※ Here, we refer to products and services that utilize user data as "data products")
Achieving high-quality customer experiences through user data requires careful consideration of data collection, analysis, and how results are used and communicated. Here are nine principles for designing compelling data products that users will love.
1. Collect data passively
User data collection must not compromise the quality of the user experience.
Privacy concerns are obviously important, but in reality, consumer expectations are rising regarding "how their data will be used in exchange for a better experience."
This trend is particularly strong among Millennials, with 80% of this generation stating they "somewhat trust" or "strongly trust" that the companies they interact with will protect their personal information securely.
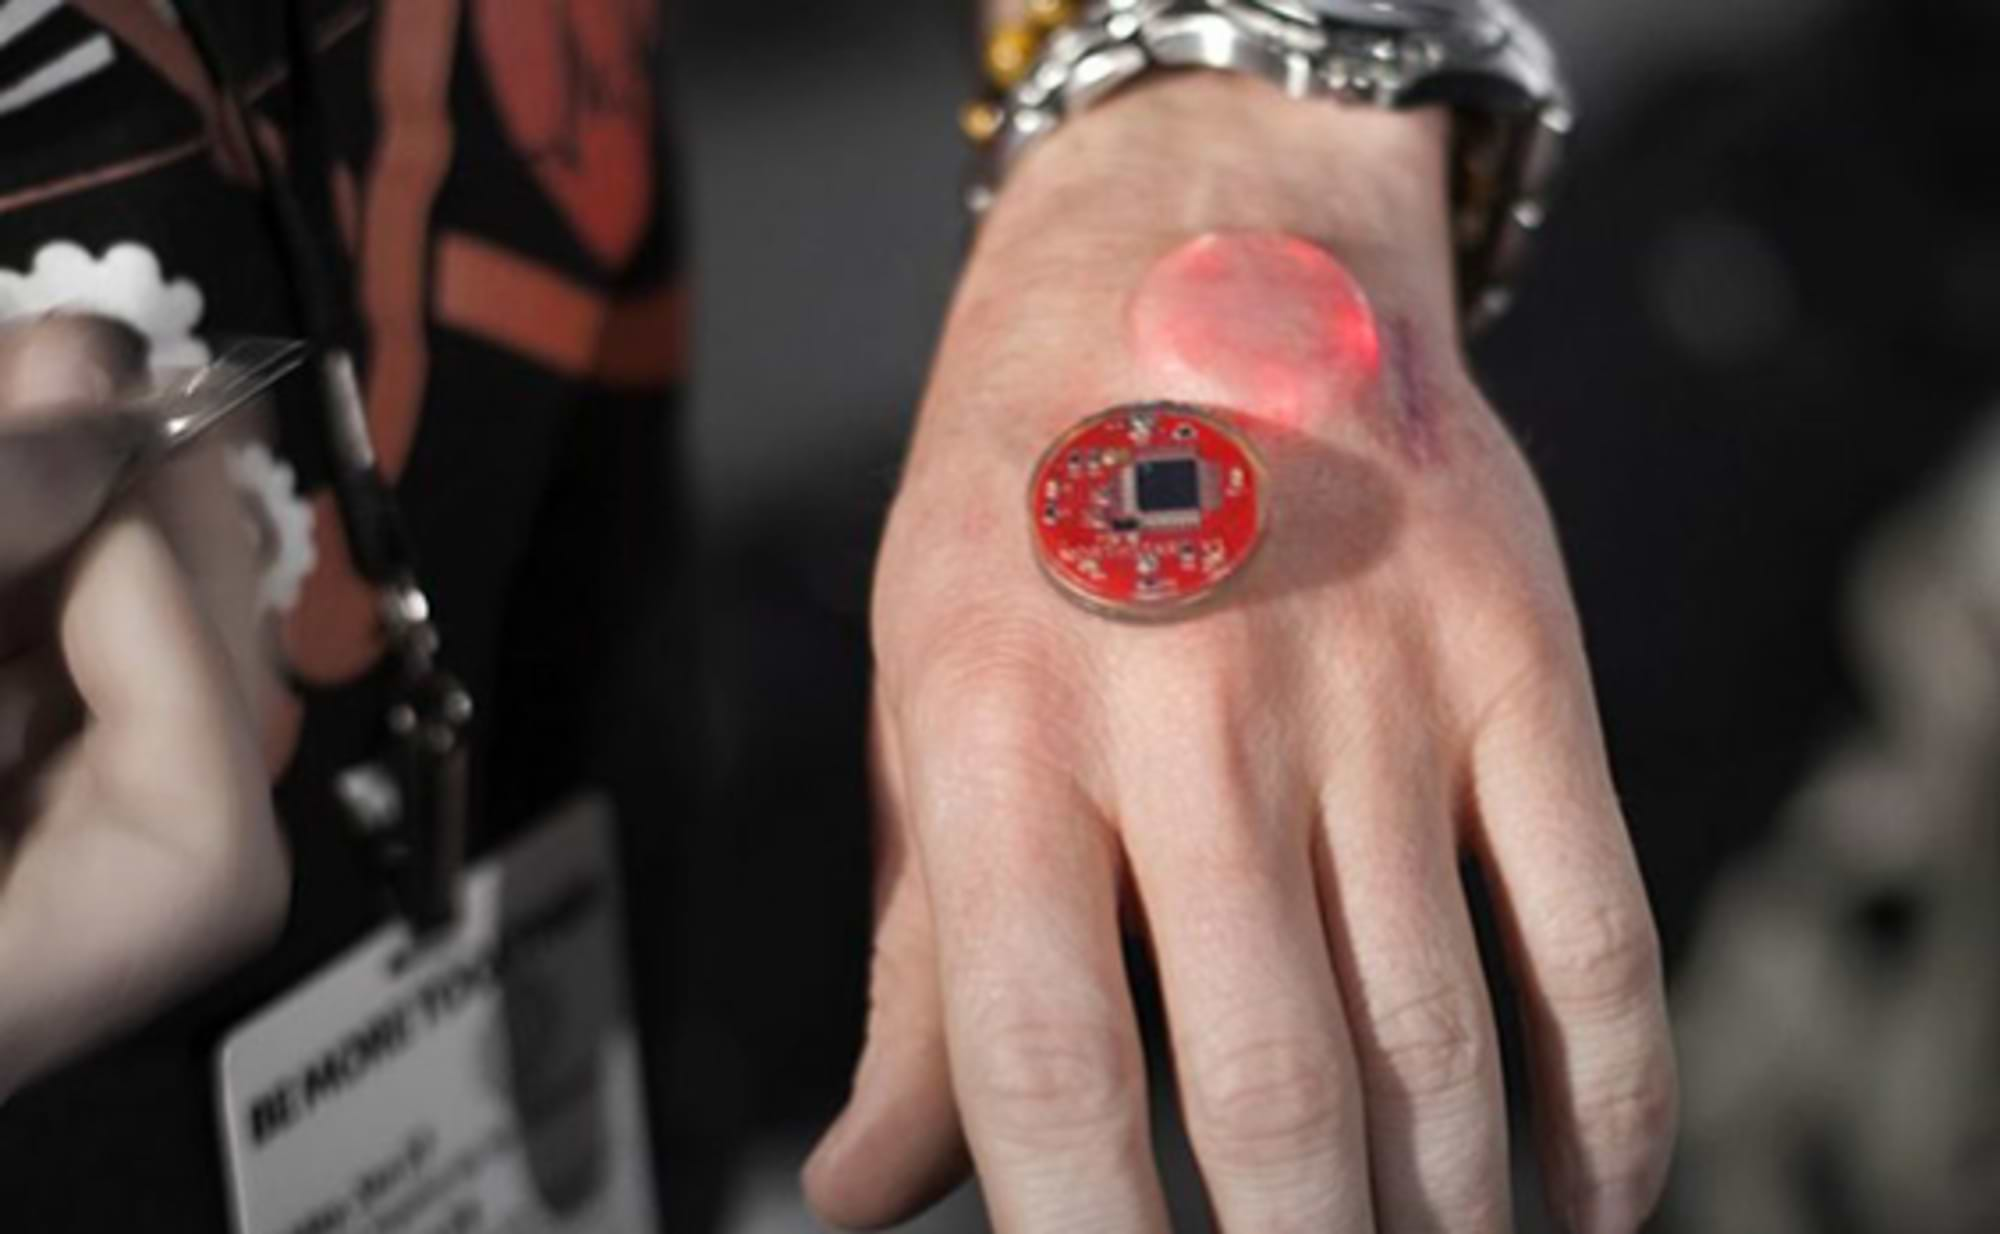
Smartphones continuously collect vast amounts of "passive data" (*). Accelerometers, GPS, and app usage data can all be leveraged to understand users and deliver better experiences.
(※ Refers to various life logs automatically generated as users go about their daily lives with their smartphones, rather than actively providing data)
For example, Google Maps uses GPS data from millions of users to suggest the fastest routes that avoid traffic jams.
Passive data collection also unlocks hidden business value. For instance, while most companies collect "clickstream data"—such as visitors' on-site behavior histories—few go beyond standard analytics solutions.
At frog, we supported a Fortune 100 company in analyzing a year's worth of clickstream data to deepen their understanding of user behavior on their web applications.
The results revealed numerous ways to improve the user interface (UI) so customers could complete transactions digitally without needing to call the call center.
We developed a "User Interaction Flowchart" that visualizes the user flow across the entire experience, enabling the identification of pain points.
Using this data, we generated a user behavior model capable of estimating the impact of UI changes on the overall "digital transaction completion rate."
Based on this, we improved the UI, enhancing the customer experience and reducing call center costs by over $600,000 annually.
2. Avoid user fatigue
Data doesn't exist until users engage with the product, making personalization impossible. Proactive data collection methods can overcome the cold start problem (where limited data makes it difficult to recommend relevant information to new users or for new products), but this collection must be a natural part of the user experience. Excellent data products avoid this issue by providing users with a simple, engaging pre-experience that collects necessary data without becoming overly intrusive. Apple Music asks new users, "Tell us what you're interested in," displaying several speech bubbles labeled with genres for the user to select from. Personal styling service Stitch Fix guides users with a questionnaire designed to ensure their favorite items appear in the initial responses. Netflix asks new users to select three favorite movies during sign-up, handling the rest over time.
Beyond pre-surveys, other solutions exist. At frog, we designed a web application for a financial institution to help customers find their ideal car. We built an advanced recommendation system leveraging the attributes of all available car models and the preferences of app users. However, this app couldn't present recommendations to new users. While designing a pre-survey could have solved this, it would have made the user experience redundant. Instead, we utilized existing survey data to assign attributes like "Sporty," "Family-oriented," "Luxury," and "Unique" to each vehicle model. Next, we created a user interface where these attributes could be toggled, allowing users to view recommended models with a single click. The aspirational nature of these attributes kept users engaged and made it easy to collect large volumes of user data to feed into the recommendation system.
3. Continuously Validate Using Data
Launching a data product is just the beginning. Once users start using it, it's crucial to continuously validate the data product by tracking key quantifiable metrics. The world is constantly changing; just because a model works well today doesn't mean it will work forever. Tracking key metrics also enables experiments to improve the data product's performance—namely, A/B testing. By iterating on the user experience and data product delivery, Airbnb constantly runs hypothesis-driven experiments. This encompasses everything from changes to the website's appearance to optimizing smart pricing algorithms (tools that automatically set accommodation prices based on demand fluctuations). By leveraging internal tools used for A/B testing, Airbnb can evaluate how changes impact key metrics like quick-through rate (the percentage of clicks relative to ad impressions) and booking volume.
Collecting user feedback to enhance the user experience is crucial. Exceptional data products can incorporate feedback instantly and automatically into every experience. In frog's vehicle recommendation application, we added a button allowing users to add suggested vehicles to their "garage." This enables users to view all their favorite cars on a single page and also serves as an excellent mechanism for collecting user feedback. This feedback is stored in a database and used to generate recommendations in real time. By storing user feedback in the same database used for recommendation generation, the vehicle recommendation system improved its performance as the number of users increased.
4. Empowering Users
A machine learning system that is overly eager and demands too many decisions from users, no matter how accurate it is, will confuse and frustrate them. However, striking the ideal balance between predicting needs and giving users just the right amount of control is quite difficult. Nest Labs designers learned this principle through their experience with the company's thermostat. Users grew frustrated and uncomfortable grappling with temperature schedules they hadn't chosen or wanted. They stopped adjusting the thermostat, leading to higher energy usage than before. People inherently dislike being told what to do. For the Nest thermostat, making users feel in control led to improved user experience and energy efficiency. The initial automated scheduling was optimized to reduce energy costs but failed to consider the end-user's comfort, ultimately increasing energy consumption. Nest designers listened to users and updated the automated scheduling to ensure comfort.
One of the primary goals for the Model 3, a tankless water heater with internet connectivity and an app, introduced to the market by frogVentures in collaboration with Heatworks, was energy conservation. Part of this energy saving is achieved through improved heating efficiency. However, the majority is realized by encouraging users to reduce their hot water usage. A simple solution to improve energy efficiency would be to impose strict limits on the amount of hot water each household can use per day, but this could easily lead to dissatisfaction and friction. Instead, Model 3 uses collected data to suggest savings history, goals, and recommended actions, encouraging users to take initiative in conserving hot water themselves.

5. Meeting Unspoken Needs
Collecting user behavior data, whether passive or active, is only part of the work involved in developing excellent data products. Understanding how to use that data to anticipate and respond to user needs is equally crucial. Tracking user behavior data—such as clickstream data or purchase data—enables the potential to build customer behavior models that can predict future actions. It also helps segment users into groups to create more personalized recommendations. iPhone's predictive text, Netflix's show recommendations, and budget management advice from personal finance service Mint all leverage vast amounts of user behavior data to provide timely information tailored to individual user needs at any given moment. While the applications of these predictive tools vary widely, their approach is fundamentally the same: finding patterns within historical user data that can be used to anticipate unmet needs.
Connected vehicles (cars constantly connected to networks) open new possibilities for collecting vast amounts of user behavior data that can be leveraged to anticipate user requests and needs. At frog, we designed and built a mobile app for an insurance company that collects driving behavior data. This includes GPS and accelerometer data from smartphones, as well as vehicle data obtained from the OBD-II port while driving. This mobile app uses this data to provide timely promotional services and financial advice suited to the user's current location, as well as to encourage safe driving behavior.
6. Evoking Discovery and Delight
Recommendation systems are one of the most common data products. By making high-quality proposals, such as introducing content or products tailored to each individual, you can keep users engaged. But what constitutes a high-quality proposal? Simply making the most relevant suggestions risks becoming predictable or tedious. To truly capture user interest, proposals must evoke discovery and delight. In other words, they should offer enjoyable, unexpected content that users wouldn't have thought of themselves.
Off-the-shelf recommendation systems can deliver a decent experience. But to give users that sense of discovery, you need proposals truly tailored to the individual. At frog, we developed a web app to help users find the perfect university. Behind the interface lies a hybrid recommendation system combining content recommendation (in this case, a list of universities) with collaborative recommendation (universities similar to those the user likes). This hybrid approach delivers results that are both relevant and surprising, leading to a richer customer experience.
7. Building Trust Through Transparency
Even if a data product functions correctly, users may hesitate to use it if they have no understanding of how decisions are made. Providing transparency about a data product's inner workings helps earn user trust. For example, the music streaming service Spotify uses the tagline "Because you listened to..." to suggest songs. Providing this information helps users better understand what to expect and makes them better equipped to make informed decisions about what to listen to next. Many machine learning algorithms generate probability scores or confidence scores alongside predictions. Sharing this confidence score with users helps them make informed decisions. This is a common approach in weather forecasting, where instead of a binary prediction of rain or no rain, users are presented with a precipitation probability expressed as a percentage.
Transparency is especially critical in fields like healthcare and finance, where decisions can have significant consequences. At frog, we collaborated with a major Mexican bank to develop a dashboard—a screen displaying essential information—for customer support agents. The bank's customers were primarily low-income individuals, many of whom tended to conduct transactions in person at branches. Based on this insight, we created a teller dashboard displaying relevant customer information. It shows personalized recommendations for actions the teller can suggest to each customer, along with advice on their financial responsibilities. Each recommendation is backed by relevant information, such as recent life events or payment history. This added layer of transparency empowered tellers to make suggestions with greater confidence.
8. Visualizing Complex Concepts
Making data easier to interpret is essential for designing great data products. A route-finding app highlights congested roads with thick red lines, allowing commuters to easily avoid them. Fitness tracker apps display simple, easy-to-understand graphs and trend lines. News sites like FiveThirtyEight make complex stories and concepts easier for readers to grasp by visually representing data, not just presenting numbers. While data visualization is everywhere, striking the right balance—avoiding excessive complexity or clutter—to make data clear and understandable is no simple task. By carefully selecting and using various means to visually symbolize information—such as placement, shape, color, size, line thickness, and movement—you can draw attention to important details.
As the scale and complexity of the data handled increases, its visualization becomes increasingly difficult. This challenge is particularly prevalent in IoT applications requiring the real-time visualization of vast amounts of streaming data. At frog, we collaborated with a major oil and gas company collecting sensor data from drilling rig instrumentation for oil and gas field integrity assessments. By adopting a user-centered design approach, we developed a data visualization dashboard enabling both technical and non-technical staff to leverage this complex data for decision-making.
9. Blending into Daily Life
Science fiction films depict a future where machine learning and artificial intelligence (AI) exist in human society in the form of robots, more advanced chatbots (automated response systems), and fully autonomous vehicles.
Read the rest of this article on the web magazine "AXIS".

Ricky Hennessy
Senior Data Scientist at frog Austin Studio. Holds a Ph.D. in Biomedical Engineering from the University of Texas. Specializes in scientific research, machine learning, algorithm development, and data analysis, with experience working with clients in defense, finance, insurance, and retail. At frog, leads prototyping of data-driven products and developing intelligent data strategies. Also serves as an instructor at General Assembly, an engineering training school.
Was this article helpful?
Share this article
Newsletter registration is here
We select and publish important news every day
For inquiries about this article
Back Numbers
Author
frog
frog is a company that delivers global design and strategy. We transform businesses by designing brands, products, and services that deliver exceptional customer experiences. We are passionate about creating memorable experiences, driving market change, and turning ideas into reality. Through partnerships with our clients, we enable future foresight, organizational growth, and the evolution of human experience. <a href="http://dentsu-frog.com/" target="_blank">http://dentsu-frog.com/</a>