Note: This website was automatically translated, so some terms or nuances may not be completely accurate.
Do you pay to watch video content?
The Curious World of Paid Video Streaming
In recent years, paid video streaming services delivered via the internet have shown significant growth as a business.
Since Netflix launched its service in 2015, various paid services have emerged and gained significant traction. More recently, DAZN has begun live streaming all J.League matches online (and this year started live streaming professional baseball as well). Most recently, in April, the broadcaster-led video streaming service Paravi launched.
Related Article:The Future of Video Streaming Services Seen in "Paravi"[April 9, 2018]
Historically speaking, the foundations of today's paid video market were laid by pay TV (cable and satellite) and video rentals, both of which became widespread in the 1990s. The recent wave of paid video streaming services represents a significant shift, occurring roughly a "generation" later.
While the consumption environment and technological backdrop differ significantly from that era, how is the very act of "paying to watch video content" perceived among users and non-users? This seems obvious at first glance, yet I believe it contains a profound mystery. Furthermore, whether the mindset around paying for content is similar or different between existing services like pay TV and rental video versus streaming services is perhaps another poorly understood issue.
Therefore, this time, I would like to explore these questions while presenting the results of a survey on paid video services conducted by Dentsu Inc. Media Innovation Lab.
The Video Market: A Mix of New and Old, Paid and Free
Before delving into "paying vs. not paying," let's first examine the scale of the market associated with consuming video content today.
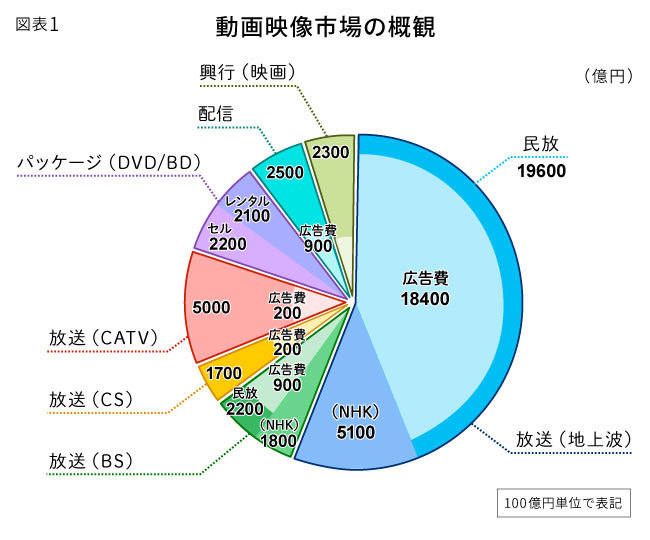
Figure 1 roughly displays the video market in 2016, using various statistical sources and rounded to the nearest 10 billion yen. It aggregates the market for content itself and the video advertising market (excluding outdoor vision and in-train video channels).
Broadly, it is divided into "Broadcasting" (terrestrial, BS, CS, CATV), "Packaged Media (DVD/BD)" (rental, retail), "Streaming," and "Theatrical (Movies)." Among these, terrestrial broadcasting stands out, accounting for over half of the total. Notably, commercial broadcasters are largely supported by advertising revenue, allowing viewers to watch for free.
On the other hand, the "streaming" sector has seen remarkable growth in recent years. The paid video streaming market shows annual growth of at least 10%, and video advertising reached ¥115.5 billion in 2017, significantly surpassing the 2016 figure shown in the graph ( "2017 Japan Advertising Expenditure: Detailed Analysis of Internet Advertising Media Costs" ).

Factors Influencing Willingness to Pay
Against the backdrop of the widespread acceptance of free commercial broadcasts with advertising in Japan, as described above, it seems possible that a complex set of values lies beneath the question of "paying to watch video content."
Therefore, I would like to examine and organize the current situation in Japan regarding the following two fundamental questions:
1. What percentage of people use paid video services?
2. What types of people are paying for video services?
We will explore the current situation by comparing various services, ranging from long-established pay TV services and video rentals to newer video streaming services.
The Reach of Paid Video Service Users
Figure 2 below shows the usage rates for paid video services, categorized into six areas: "Paid TV," "Packaged Media (Rental/Purchase)," and "Paid Video Streaming (Subscription-based, Pay-per-view Rental, Pay-per-view Purchase)" (December 2017 survey).
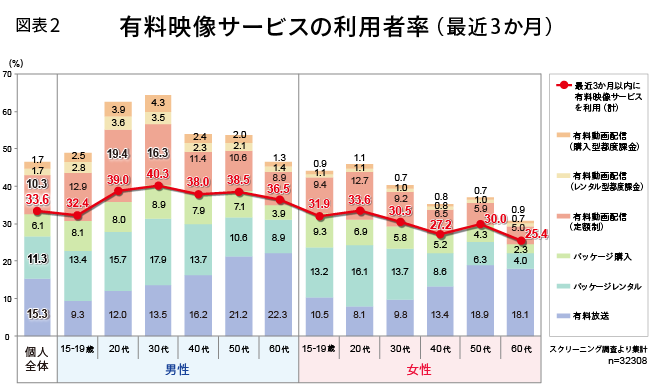
The line graph shows the percentage of individuals who used any of the six paid video services within the last three months, excluding multiple responses. Looking at the far left column for all individuals, 33.6% of all individuals aged 15-69 (both men and women) used at least one of the six services, meaning roughly one in three people fall into this category.The breakdown shows paid broadcasting services were the most popular at 15.3%, followed by package rentals (so-called rental videos) at 11.3%, and subscription-based paid video streaming at 10.3%.
Subscription-based paid video streaming showed significant growth compared to the results of our August 2015 survey (6.7%).
Related article:Considering the Future of Paid Video Viewing Based on Original Research[May 18, 2016]
It is particularly evident that males in their 20s (19.4%) and 30s (16.3%) form the core user base. On the other hand, package rentals also achieved relatively high usage rates among younger demographics. Notably, females from their teens to 30s achieved the highest usage rate across all paid video service categories.
Who are the users of paid video services?
Looking at the above from the opposite perspective, two out of three people do not use any of the six paid video service categories. So, let's explore what factors underlie this 1:2 ratio of users to non-users of paid video services.
① Disposable Income
First, for users of paid video services, we can consider the financial leeway to pay for video content. When we compiled responses to the question "How much money do you have available for discretionary spending, not essential living expenses?", users reported a median of ¥20,000 per month, while non-users reported ¥15,000 per month (both median values), a difference of ¥5,000 per month.
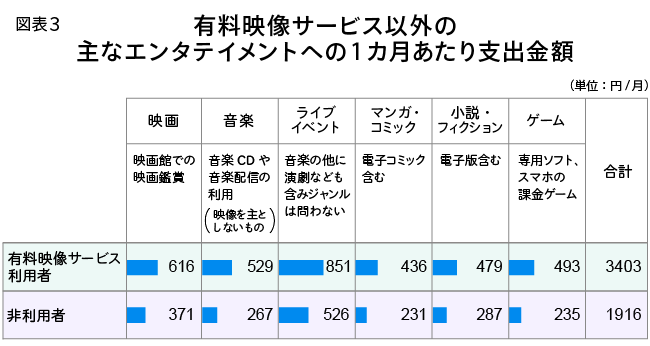
Furthermore, we examined how much users spend on entertainment beyond the six paid video service categories: movie theater visits, music (CDs/streaming), live events, manga/comics, novels/fiction, and games (dedicated software/mobile in-app purchases).The total monthly expenditure across these six categories averaged approximately ¥3,400 for video service users and ¥1,900 for non-users, showing a gap of about ¥1,500. This suggests that being proactive in overall entertainment spending is one factor contributing to the willingness to pay for video services.
② Daily Time Allocation
Viewing video content requires a certain amount of uninterrupted time, suggesting that financial resources alone aren't enough—sufficient time is also necessary. Therefore, let's examine the daily time allocation of paid video service users versus non-users (Figure 4).
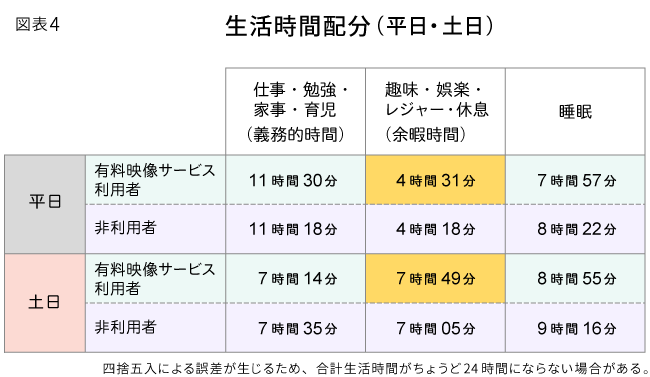
First, focus on the shaded portion representing leisure time. Paid video service users have longer leisure time than non-users on both weekdays and weekends. The difference is particularly pronounced on weekends, exceeding 40 minutes. While not all leisure time is spent on paid video services, users seem to have created the temporal flexibility necessary as a "prerequisite" for viewing.
Next, shifting our focus to sleep time, we observe that paid video service users have shorter sleep durations on both weekdays and weekends. This suggests that paid video service users tend to actively prioritize securing leisure time, even if it means sacrificing some sleep.
③ Life Values
Finally, let's examine whether the trends identified so far are supported by the respondents' life values.
The following chart presents results from a survey conducted based on the hypothesis that whether or not individuals use paid video services, and the types of new or old paid video services they use, might even lead to differing values across all aspects of life (Chart 5).
For each item, respondents rated how strongly they agreed or disagreed on a 5-point scale, with left (green) indicating agreement and right (yellow) indicating disagreement. All responses were then converted to a standardized score. The data was also processed to allow comparison relative to non-users of paid video services (set as the baseline/zero).
Paid video users may subscribe to multiple service categories. Therefore, users were classified based on their response to "the service category they use most frequently," allowing us to examine the value characteristics observed among users of each category.
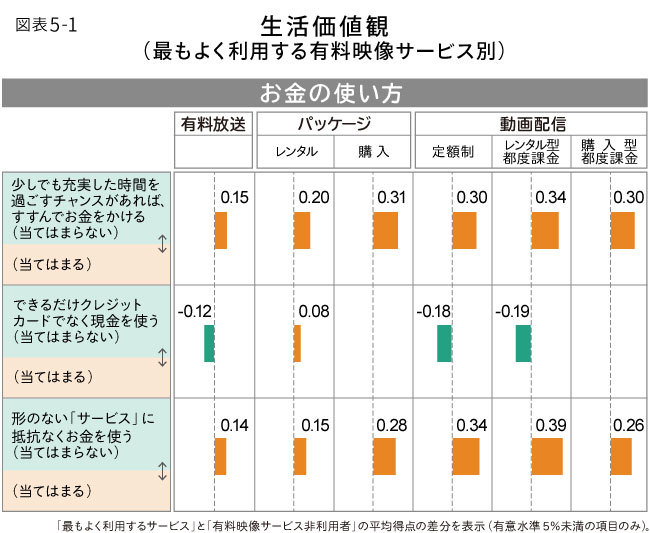
④ Spending Habits
First, let's look at the items showing significant differences in values between all paid video service users and all non-users. These were the two items included in the "Use of Money" section of the chart.Paid video service users consistently showed a higher proportion answering "applies" to the item "If there's a chance to spend time more meaningfully, even a little, I'm willing to spend money" (the bar chart leaning toward the right side
Similarly, more respondents also answered "applies" to the item "spend money without hesitation on intangible 'services'."
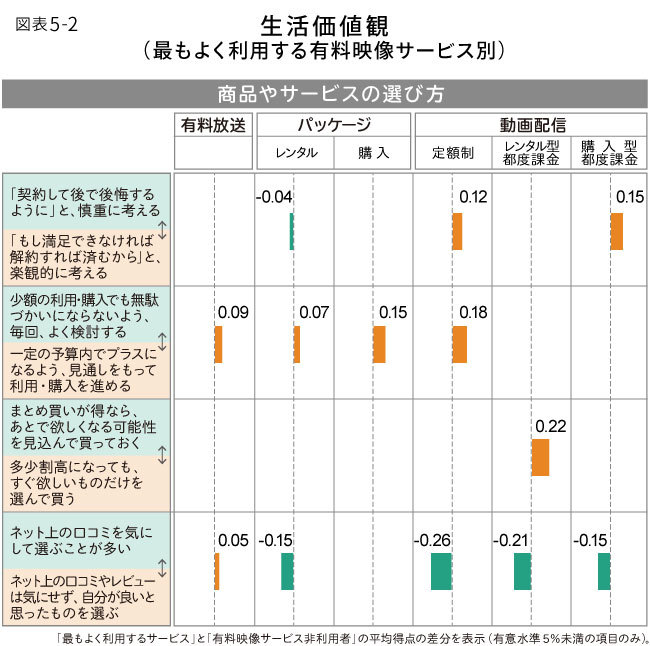
⑤ How they choose products and services
The mindset of "proceeding with use/purchase with foresight to maximize value within a set budget" was more common across 4 out of 6 categories. Particularly interesting is that this tendency was especially strong among streaming service users who specifically use "flat-rate" services. This suggests that everyday life values directly influence service choices.It is also suggestive that a higher proportion of subscription streaming service users optimistically think, "If I'm not satisfied, I can just cancel."
One item showing differing response tendencies between old and new services was whether respondents "often consider online word-of-mouth when choosing products or services." The three video streaming categories showed greater concern for word-of-mouth. This reflects how the online generation's product/service selection, influenced by online reputation, directly manifests in the values of video streaming service users.
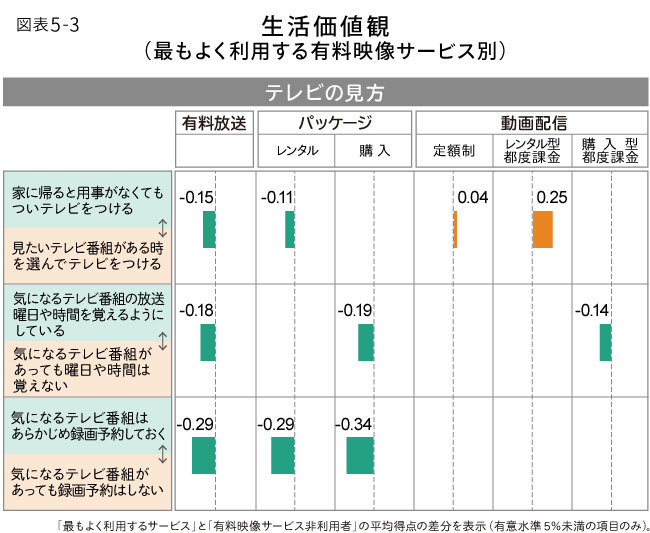
⑥ How They Watch TV
Conversely, regarding "TV viewing habits," the tendency to "pre-schedule recordings for programs of interest" was strongest among users who most frequently utilized the three longer-established categories: "pay TV," "package rentals," and "package purchases."
Furthermore, users of "pay TV" and "DVD/Blu-ray rentals" showed a stronger tendency to answer "I tend to turn on the TV when I get home, even if I have no particular reason to watch." Conversely, the tendency to answer "I turn on the TV only when there's a specific program I want to watch" was strongly evident among "video streaming" users.

What is the pace of conversion from non-users to users going forward?
Looking at the overall survey results, it became clear that the path non-users of paid video services take to become users is determined by a combination of various factors. We confirmed that fundamental factors, which are less likely to change—such as basic values and related spending habits and time allocation—also influence whether someone uses a service or not, and the type of service they use.
When asking non-users about their intention to use paid video services, we found that the maximum percentage likely to use any of the six paid video services within the next year is 7.5% (5% of the total).
Furthermore, the service categories they intend to use over the next year did not show a one-sided preference for video streaming. Instead, the results showed nearly equal interest in using video streaming services, pay TV, and packaged video services. As seen above, this result confirmed that while some values favor video streaming services, other values favor traditional paid video services beyond streaming.
In fact, prior to conducting the survey, we anticipated stronger growth momentum for paid video services going forward, with streaming services driving most of the expansion. However, analyzing the survey results led us to conclude that consumer values and lifestyles are more stable and resistant to change than we had imagined.
A phase requiring greater ingenuity to expand the user base
As mentioned at the outset, non-users of paid video services still constitute the majority, with two out of three people not using them. To reach these consumers, we believe we have entered a stage requiring tailored approaches and initiatives for each individual consumer's stage. This involves proposing services that gradually guide users: first to free service use, then to temporary or limited paid use, and finally to stable subscription-based service use. It also involves combining programs that encourage "dormant users" – those who once used the service but have since stopped – to consider using it again.
【"Second Survey on Paid Video Service Usage" Overview】
Survey Period: December 8-18, 2017
Area: Nationwide
Web Survey:
1) Screening survey participants (n=32,308)
2) Main Survey
Series 1: Paid Video Service Users (n=3,604)
(Allocated according to gender and age group occurrence rates of users across 6 paid video service categories)
Series 2: Non-users of paid video services (n=750)
Was this article helpful?
Share this article
Newsletter registration is here
We select and publish important news every day
For inquiries about this article
Back Numbers


Author

Akira Miwa
Dentsu Inc.
Dentsu Inc. Media Innovation Lab
Director of Media Innovation Research
Since joining the company, I have primarily conducted research and studies in the fields of information and communications, digital devices, and content at DENTSU SOKEN INC. I have also worked on building business visions and providing consulting services for both public and private sector clients. My responsibilities have spanned a wide range of areas, from cameras and robots to e-books. From July 2012, I worked on projects related to information media in general within the Media Innovation Research Department. I have held my current position since November 2015.

dentsu Media Innovation Lab
Dentsu Inc.
Launched in October 2017, leveraging Dentsu Inc.'s longstanding media and audience research expertise. Conducts research and disseminates insights to capture shifts in people's diverse information behaviors and understand the broader media landscape. Provides proposals and consulting on the communication approaches companies need within this context.