Note: This website was automatically translated, so some terms or nuances may not be completely accurate.
Understanding Modern Media Lifestyles Through 7 Groups and 30 Types
The proliferation of smartphones, the expansion of various SNS platforms, and the growth of online video viewing have accelerated the diversification of media and the fragmentation of viewing behaviors at an unprecedented pace, making it difficult to grasp the overall picture of how modern people engage with media.
Data on contact rates and contact time per media unit certainly exists. However, where should this data be positioned within the lives of individual modern people? This time, we focused on the sequence of daily actions recorded in Video Research Ltd.'s lifestyle and media behavior data "MCR/ex*" – actions like "waking up, going out, returning home, engaging with media, and going to sleep" – to clarify the "media lifestyle" of modern people.
We define media lifestyle as the common patterns exhibited by similar individuals when viewed from the perspective of "when and what media they engage with" within their daily (morning, afternoon, evening) and weekly (7 days) life activities.
Using a new methodology called "Social Sequence Analysis" (described later), participants were classified into 7 groups and 30 styles. Akira Miwa from Dentsu Inc. Media Innovation Lab provides a detailed explanation.
*MCR/ex: A database created by Video Research Ltd. since 1997, recording participants' 24-hour daily activities and media contact behaviors in 15-minute intervals over a week (7 days) in a diary format.
Extracting 7 Groups and 30 Types of Media Lifestyles
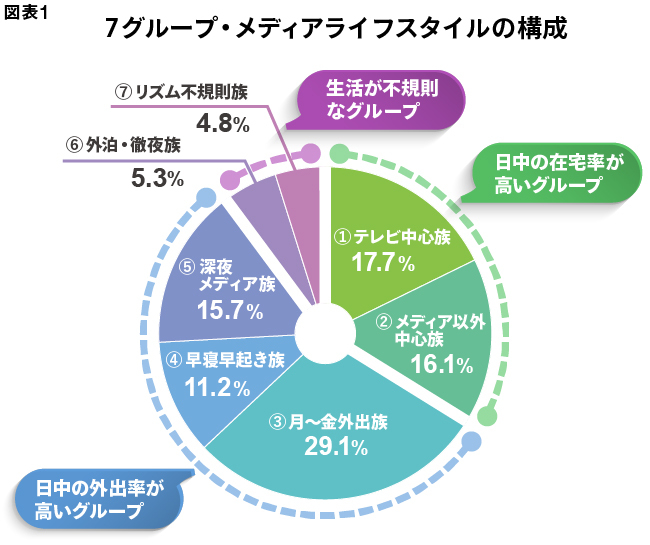
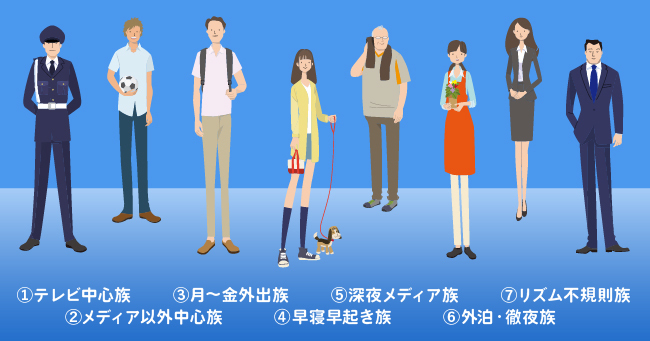
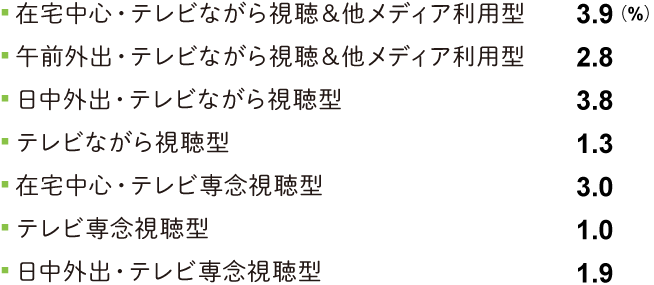
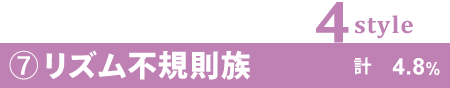
The analysis results, as shown in Figure 1, broadly categorize Kanto residents (aged 12-69) into 7 groups: ① TV-Centric Tribe (17.7%), ② Non-Media-Centric Tribe (16.1%), ③ Weekday Outing Tribe (29.1%), ④ Early-to-Bed, Early-to-Rise Tribe (11.2%), ⑤ Late-Night Media Tribe (15.7%), ⑥ Overnight Stayers/All-Nighters (5.3%), and ⑦ Irregular Rhythm Group (4.8%).
Each media lifestyle is significantly influenced by differences in daily rhythms. They fall into three major groups: those with high daytime at-home rates (① and ②), those with high daytime outings rates (③, ④, and ⑤), and those with irregular lifestyles (⑥ and ⑦).
Further statistical classification of the 7 groups into 30 subcategories revealed diverse media lifestyles reflecting patterns of engagement with new and traditional media at each 24-hour time point throughout the week, along with their respective composition ratios.


What data is suitable for depicting media lifestyles?
So, what kind of data can be used to derive these diverse media lifestyles?
For digital devices like computers, smartphones, and tablets—not just TV—we can obtain real-time usage log data from survey participants, aggregate and analyze it, and grasp actual usage patterns (see, for example, "App Usage by Gender and Age Revealed by Log Data" ).
But what if we want to deepen our understanding of seniors who read newspapers and are also avid smartphone news readers? We need to capture their behavior, including their use of traditional media. Furthermore, for the younger smartphone generation, radio (including apps like radiko) remains an indispensable medium for those living in a car-dependent society.
Therefore, for this project, we decided to tackle the challenge using MCR/ex, the survey database of Video Research Ltd., through a joint effort with them.
MCR/ex contains approximately 50 items each for in-home and out-of-home lifestyle and media behaviors. Survey participants meticulously select what they were doing at 15-minute intervals throughout a week. This analysis utilized data from 4,971 men and women aged 12 to 69 residing in the Tokyo area (within a 50-kilometer radius of Tokyo Station) in 2017.
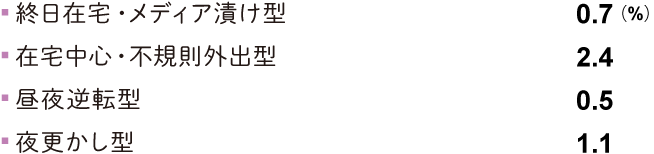
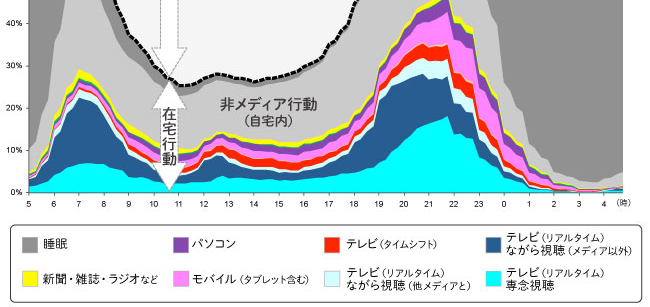
For example, Figure 2 aggregates the actions of all individuals in this MCR/ex survey. It shows, stacked to total 100%, where respondents were (at home or outside) and what they were doing at each time point from 5:00 AM on the first survey day (Monday) until the early morning of the following day.
Television viewing at home begins upon waking in the morning, while mobile device use outside the home peaks around noon. In the evening, starting around 7 PM, various media usage—including television, mobile devices, and PCs—simultaneously peaks at home, lasting until around 10 PM.
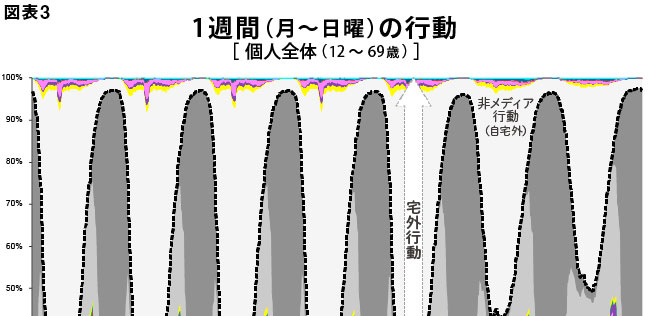
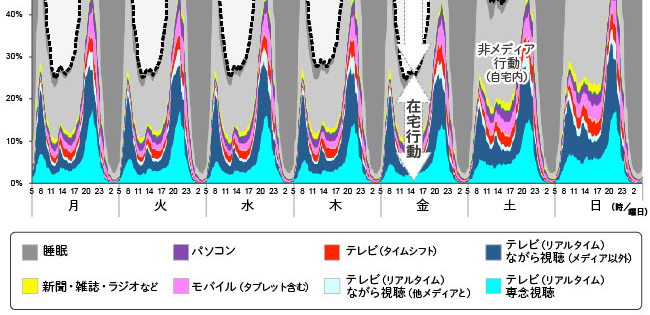
Similarly, looking at an individual's actions over a full week (Monday to Sunday), regular media engagement patterns repeat consistently from Monday to Friday. On Saturdays and Sundays, the rate of being at home during the day increases, and overall media engagement at home remains active throughout the day.
However, this is merely an aggregate of all individuals. The project's goal was to visualize, based on actual behavioral data, how many people with what kinds of media lifestyles exist within this aggregate.
Headlong into Statistical Methods That Might Extract Media Lifestyles
The challenge then becomes how to extract people with similar "media lifestyles" from this large-scale survey data. We needed a method to calculate the degree of similarity between each of the 4,971 individuals or to statistically group them based on data from 7 days × 24 hours × 4 (dividing each hour into 4 15-minute segments) = 672 time points of daily activities and media behaviors per survey participant.
After exploring various options, we arrived at a method called "Social Sequence Analysis." "Social" refers to "society," and "sequence" means "order" (a literal translation wouldn't make much sense, would it?). Originally, in the 1980s, there was "sequence analysis" used in the genomics field of life science to analyze DNA sequences. This method was then applied to analyzing the sequence of events and state changes among people in society, leading to the term "Social Sequence Analysis."
However, looking worldwide, we found no examples of Social Sequence Analysis being used to analyze media behavior across 672 time points. Even within Japan, we found no examples of this method being used. We wouldn't know what results it would yield until we tried it. Holding onto the hope that "since it's a method originally used for DNA-related analysis, it should surely be able to handle data like 4,971 people × 672 time points," we decided to dive in headfirst and conduct the analysis.
Starting next time, we will introduce the distinctive media lifestyles of the 7 groups and 30 styles revealed by the project.
We hope that by reading with the simple perspective of "Which group or style am I closest to?" and "How many people share a style similar to mine?", the full picture of modern media society will emerge.
【Contact Information】

Was this article helpful?
Share this article
Newsletter registration is here
We select and publish important news every day
For inquiries about this article
Author

Akira Miwa
Dentsu Inc.
Dentsu Inc. Media Innovation Lab
Director of Media Innovation Research
Since joining the company, I have primarily conducted research and studies in the fields of information and communications, digital devices, and content at DENTSU SOKEN INC. I have also worked on building business visions and providing consulting services for both public and private sector clients. My responsibilities have spanned a wide range of areas, from cameras and robots to e-books. From July 2012, I worked on projects related to information media in general within the Media Innovation Research Department. I have held my current position since November 2015.