Note: This website was automatically translated, so some terms or nuances may not be completely accurate.
"TV internet connectivity rate" has exceeded 50%! What does this mean?
Video streaming services began gaining traction around 2015.
Over the past two to three years, multiple major overseas platforms have entered the Japanese market, and this year has also seen news of simultaneous broadcasts on terrestrial TV and the internet.
Television and video are poised to undergo a major transformation period over the next few years, shaping the future.
The number of viewers for OTT (Over-The-Top) services, which deliver video content regardless of the device used, has been increasing annually alongside improvements in internet connection speeds. Usage rates and viewing time have shown an upward trend, particularly following the stay-at-home periods during the COVID-19 pandemic.
This series will explore the future of video streaming services based on domestic usage surveys conducted by Cyber Communications Inc. (CCI) in "December 2019" (pre-pandemic) and "June 2020" (post-pandemic) ( ※1 ).
<Table of Contents>
▼How Did Internet Connectivity & Video Consumption Change in 2020?
▼TV Internet Connectivity Exceeds 50%! What's on Your TV Screen?
▼New Advertising Planning Utilizing "Connected TV Advertising"
How Did Internet Connectivity & Video Consumption Change in 2020?
First, we compared data from "December 2019" and "June 2020" regarding devices used to watch video streaming services. (Multiple answers were possible, so the totals exceed 100% for each category)
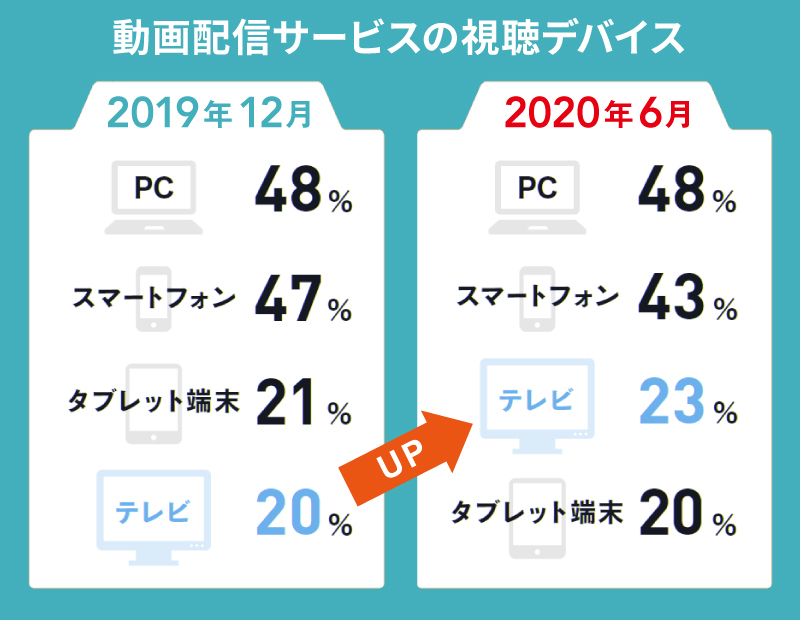
Particularly noticeable is the increase in viewing via television sets. The percentage, which was 20% in December 2019, rose by 3 points over half a year to 23% in June 2020. Conversely, viewing via smartphones decreased from 47% to 43%.
This shift is likely influenced by stay-at-home measures during the COVID-19 pandemic. The growth in TV set viewing stems from two underlying factors:
① Increased viewing in the living room due to reduced outings
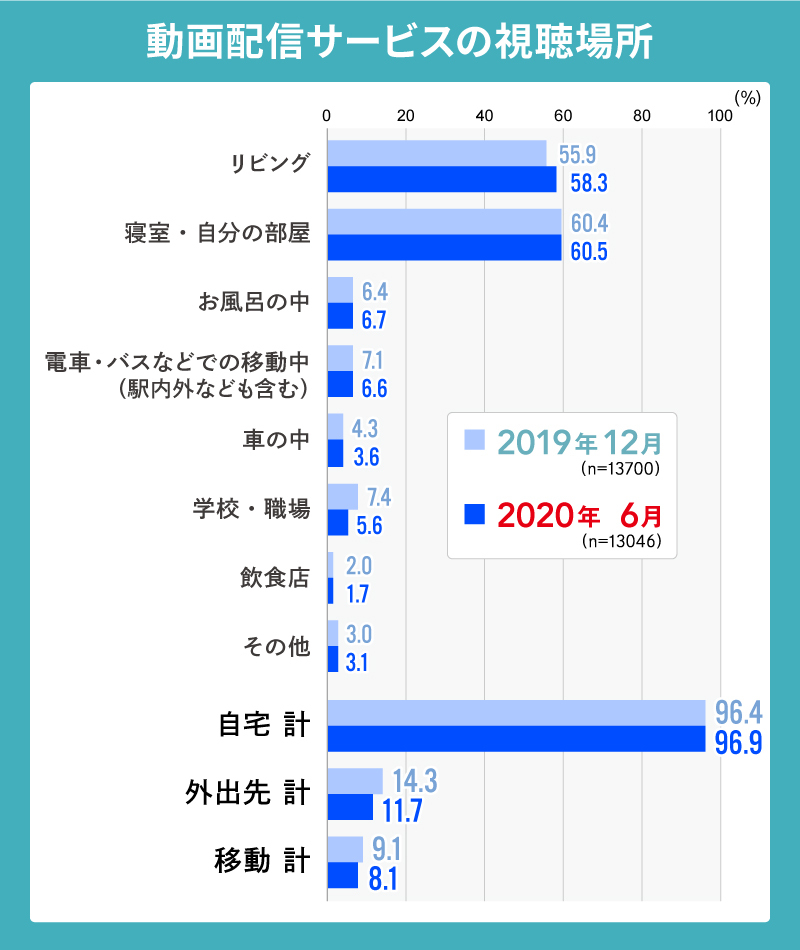
The first factor is a change in viewing location. Restrictions on going out led to increased viewing in the living room and decreased viewing while out.
Increased viewing in the living room also boosted "companion viewing" with others. Opportunities to watch video streaming services together with family on larger TV screens likely increased. Growth in companion viewing with spouses was particularly noticeable.
② Increased internet connectivity of TV sets
The second point, related to the first, is the increase in internet connectivity rates for TV sets. As shown in the graph below, even as of "December 2019," 41.6% of people reported having their TV set connected to the internet.
Most of the latest TVs currently on the market are "connected TVs" that can easily connect to the internet. Additionally, stick-type devices that allow easy access to video streaming services simply by plugging them into the TV are available from various manufacturers.
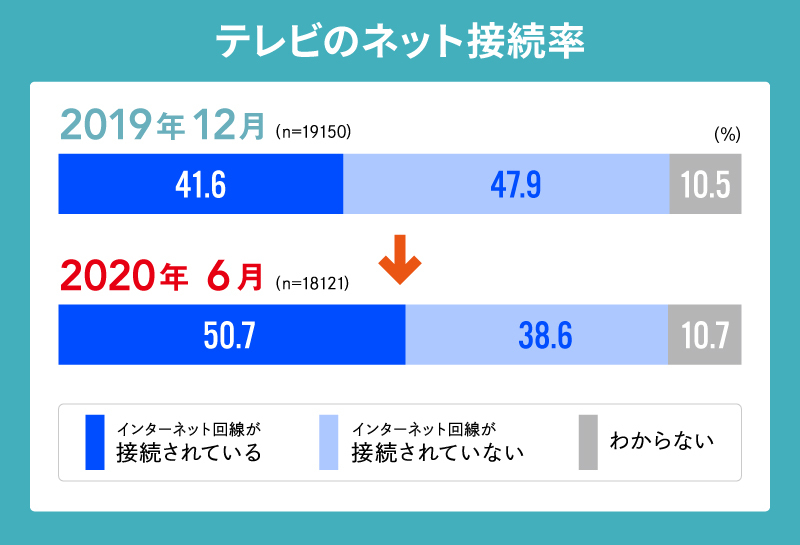
Furthermore, a June 2020 survey showed the internet connection rate for TV sets had exceeded 50%, representing an increase of about 9 percentage points in just half a year. The internet connection rate for TV sets is indeed increasing rapidly right now.
However, while we mentioned earlier that video viewing on TVs increased to 23% this June, this "approximately 50% internet connection rate" figure includes people who are connected to the internet but are not actually watching video streaming services.
In other words, of this 50%, roughly half have actually watched videos on their TVs, while the other half have not yet watched but represent potential viewers.
With viewing environments now established, if given the right trigger, video streaming service viewing on TV sets could accelerate rapidly. It has the potential to catch up to viewing rates on smartphones and PCs.
TV Internet Connectivity Exceeds 50%! What Will We See on the TV Screen?
As video streaming service viewing via connected TVs (smart TVs) and stick-type devices becomes commonplace, a phenomenon will likely emerge where video streaming services and existing broadcasters compete for the "TV screen," which was previously used solely for viewing "broadcast content" (i.e., TV programs).
However, it appears viewers aren't necessarily watching all streaming services on TV.
A recent survey examining viewing devices for 18 different video streaming services found that for subscription-based services (SVOD), such as Netflix, Amazon Prime Video, and DAZN – which offer a wealth of sports, foreign dramas, and movies – over 30% of users reported watching on a television set.
On the other hand, TV viewing for "user-generated video streaming services," including YouTube, remains below 10%. Users are consciously choosing "content to watch on the TV screen" versus "content to watch on devices like smartphones."
This shows that viewers are shifting away from the old habit of "sitting down in front of the TV and watching whatever is on" towards a mindset of "using the TV set only for content they specifically want to watch on a TV screen."
New Advertising Planning Utilizing "Connected TV Advertising"
As video viewing on internet-connected TVs increases, "Connected TV advertising" is gaining significant attention.
In the United States, connected TV has already surpassed mobile (smartphones and tablets) in terms of video ad impressions on some platforms when looking at total video ad delivery by device. It now offers a delivery scale that is larger than and sufficient for mobile.
The chart below shows eMarketer's forecast for the connected TV advertising market. As of 2019, the market size was approximately $7 billion, and it is projected to grow to $14 billion by 2023.
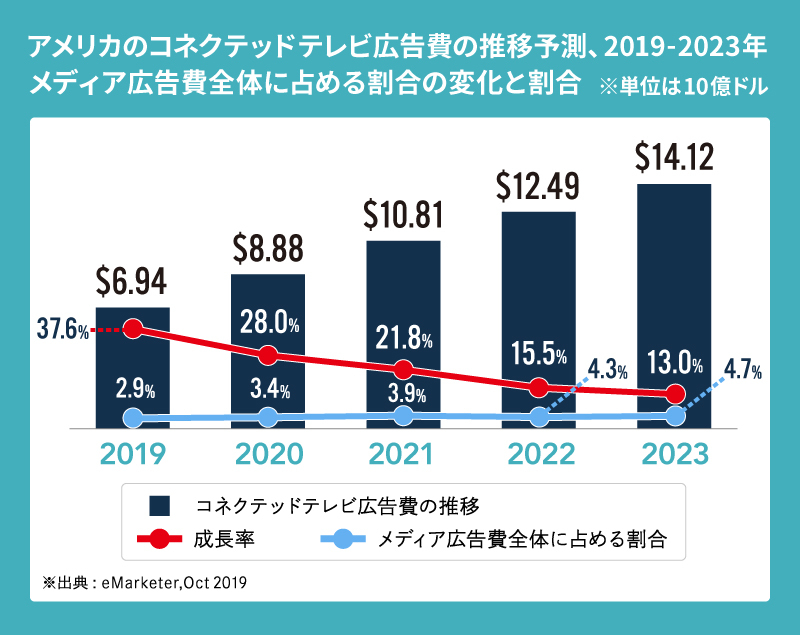
In the United States, where many households subscribed to cable TV or satellite broadcasts, increasing connected TV ad inventory was a challenge. However, as more convenient connected TVs became widespread, "cord-cutting"—the act of canceling cable TV or satellite subscriptions—increased. Around 2018, connected TV ad impressions surpassed mobile video ad impressions.
In Japan too, connected TVs continue to grow, and as sufficient ad delivery volumes become available, this market is expected to grow rapidly. Consequently, campaigns spanning connected TV, mobile, and PC devices and platforms will increase. Metrics designed for this cross-device environment will develop, and the effectiveness of these campaigns will be compared against traditional TV metrics.
We are entering an era where we will visualize and maximize the unique effectiveness of integrated campaigns leveraging digital, and optimize advertising budgets.
※1 Survey Overview
CCI Domestic Video Streaming Service Playbook
https://www.cci.co.jp/news/2020_08_13/1-104/
CCI Domestic Video Streaming Service Detailed Report
https://www.cci.co.jp/news/2020_08_31/01-23/
"Domestic Video Streaming Service Detailed Report"
・Survey Purpose: To clarify the actual usage of video streaming services and identify characteristics within service genres
• Survey Areas: Nationwide
・Survey Area: Nationwide
・Survey Method: Internet survey
・Survey Participants: Men and women aged 15–69
・Sample Size: 6,000 per group
・Survey Conducting Organization: Video Research Ltd.
・Survey Period: December 23, 2019 - December 25, 2019 / June 12, 2020 - June 14, 2020
※2 Source: eMarketer, October 2019
・Digital advertising expenditure on connected TV (Hulu, Roku, YouTube, etc.)
・Includes display ads and in-stream video ads on Connected TV
・Excludes network-sold advertising inventory on traditional linear TV and addressable TV
[Online Forum Announcement]
CCI BROADCASTING FORUM
https://www.cci.co.jp/seminar_BCForum/2020.11.27/
A panel discussion on "Connected TV" will be held at the above online forum on November 27. We encourage interested parties to attend.
Was this article helpful?
Share this article