Note: This website was automatically translated, so some terms or nuances may not be completely accurate.
Analyzing the Buzz Around the Tokyo Olympics
This series introduces parts of the opening feature from Dentsu Inc. Media Innovation Lab's " Information Media White Paper 2022 " (published by Diamond Inc.).
Since spring 2021, Dentsu Inc. and Video Research Ltd. have been developing "Buzz Viewn!", a system that fully automates AI analysis of Twitter reactions to TV programs. This article explains, based on that system and using the Tokyo 2020 Olympics as a preliminary test case, what the actual buzz reactions (all Twitter posts) were like and their relationship to viewership ratings. It combines insights from the Information Media White Paper with Web Dentsu Tsūhō's unique perspective.
<Table of Contents>
▼Olympic-related posts captured a surprising share of total daily tweets
▼What Twitter's unique characteristics reveal through the "discrepancy" with viewership ratings
▼As national interest surged, posts from younger and female demographics increased
▼Top sports by post volume: "Baseball" and "Soccer." "Cycling" popularity hints at a new era of broadcasting
▼Technology evolving with each Olympics fuels buzz visualization
Olympic-related posts accounted for a surprising share of total daily tweets
In 2021, affected by the COVID-19 pandemic, the Tokyo Olympics became the first in history to be held without spectators. Despite being hosted in their home country, viewers were forced to watch via TV and the internet, leading to a flood of cheers sent through social media.
Memories and feelings from the time of the event tend to fade over time. However, current technology allows us to preserve "every trace" of the "recorded voices" sent via social media from various angles. Here, we present a glimpse of "TOKYO2020" through viewership ratings and Twitter post volume.
First, let's examine the trends in viewership ratings during the Games (Figure 1) and the number of TOKYO2020-related tweets (Figure 2). The highest viewership rating occurred on July 23rd during the Opening Ceremony. The household viewership rating in the Kanto region exceeded 50%, a figure rarely seen in recent years. (Figure 1)
Meanwhile, the number of related tweets peaked on July 26, when Jun Mizutani and Mima Ito (mixed doubles table tennis) and Momoka Nishiyama (women's street skateboarding) won gold medals. Over 1.6 million related tweets were posted that day. (Figure 2)
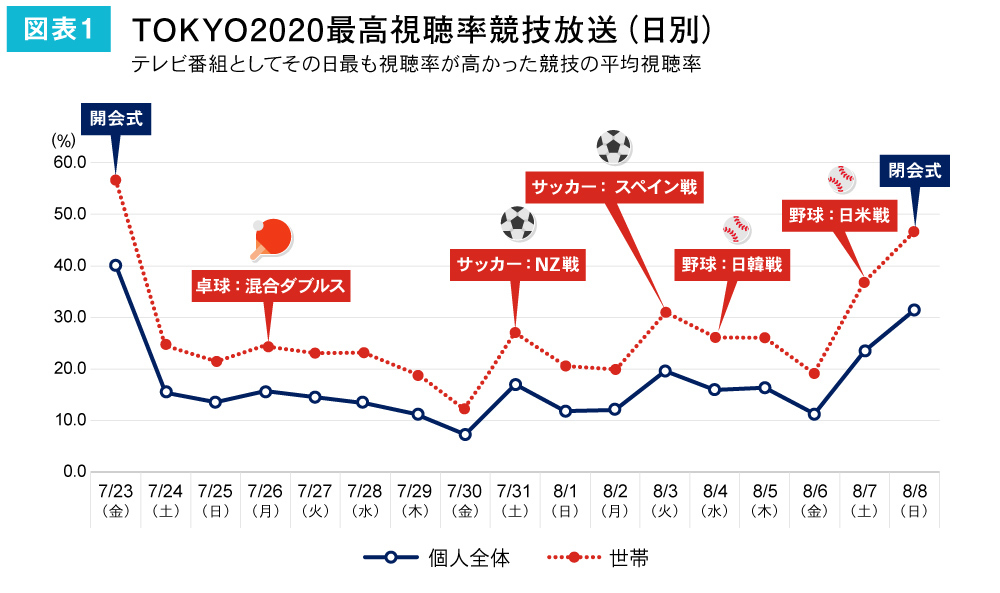
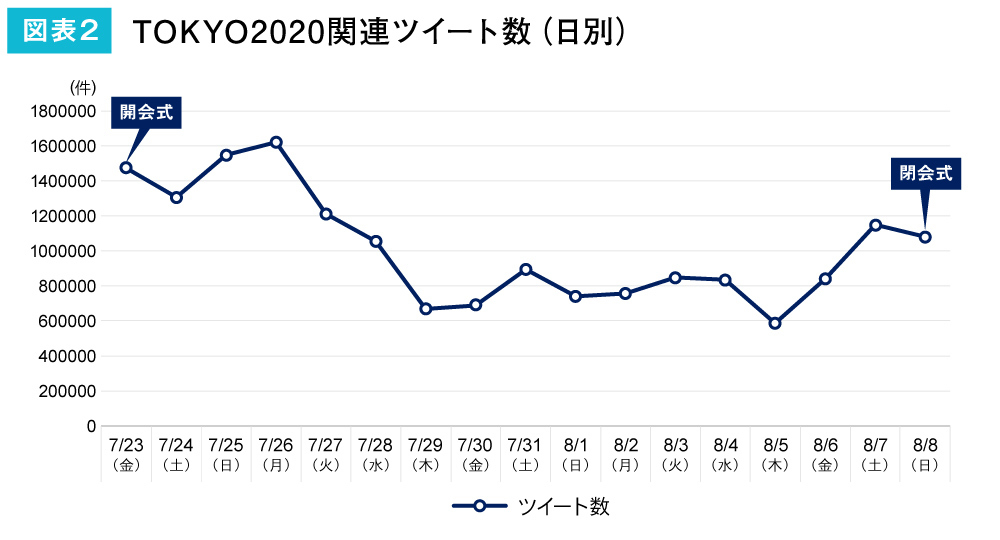
Figure 3 adds retweet counts (green) to the graph of related tweet counts (blue). It further overlays a new metric, "SOB" (short for Share Of Buzz, shown as the red line graph), which indicates the share of tweets containing a specific theme-related keyword (in this case, TOKYO2020) relative to the total number of tweets posted in Japan that day.
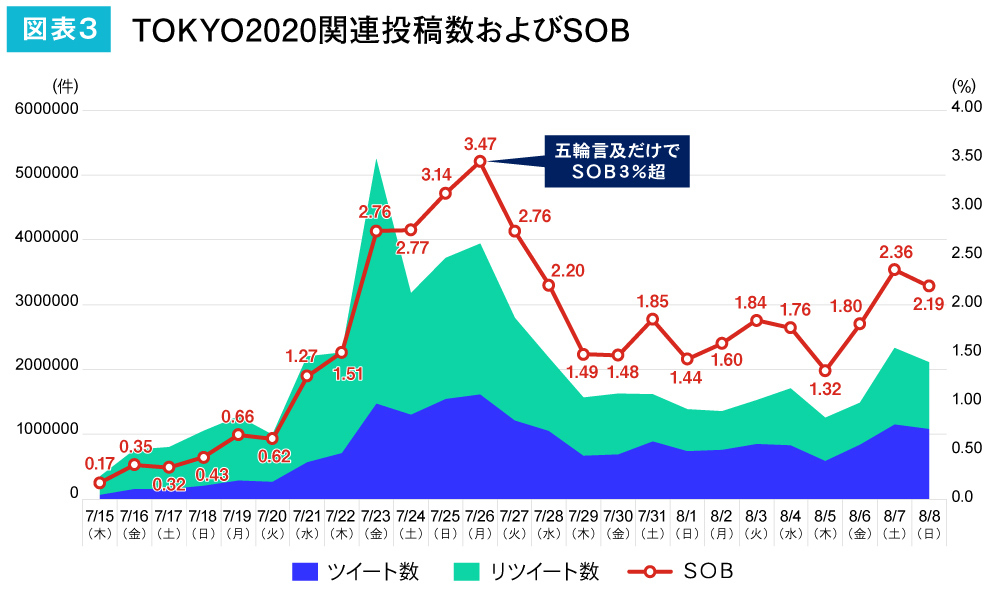
Previously, even when an event "went viral," there was no score to compare its scale horizontally (since total post volume is influenced by factors like penetration rate). SOB quantifies this buzz by calculating the proportion of theme-related posts relative to the total daily post volume.
Looking at SOB, even popular TV shows typically have SOB values between "0.01% and 0.10%." Even nationally beloved super-popular dramas usually fall within "0.2% to 0.5%." However, TOKYO2020 saw SOB values consistently exceeding "1.0%" every day during the Games, showing tremendous activity. This result clearly demonstrates how much attention it captured.
The SOB value for the Opening Ceremony immediately jumped to 2.76%. While the total volume of Twitter posts nationwide (the denominator) was high on that day (July 23rd), exceeding 2% even with that high volume was a record-breaking score. Furthermore, SOB peaked just four days later. The Japanese team's gold medal rush continued daily, with players like Mizutani and Ito in table tennis, along with numerous other athletes, winning medals on July 26. The SOB value reached an impressive 3.47%.
What Twitter's Unique Characteristics Reveal Through the "Discrepancy" with TV Ratings
Figure 3 shows the daily trend in related posts. We can also examine post volume in more detail by hour and overlay this with the minute-by-minute TV ratings. According to this, the peak minute-by-minute rating for the entire audience (Kanto region) during the opening ceremony was around 8:30 PM. This coincides with the start of the athletes' parade. However, the instantaneous peak time for SOB was around 8:45 PM. In other words, the peak of the buzz lagged behind TV viewing by about 15 minutes. This is likely because the Dragon Quest music began playing around 8:45 PM. For the younger generation posting on Twitter, it seems to have been a heart-pounding moment, like "Whoa, our song is playing!"
Furthermore, even though Twitter posts are short, they require time to compose. This typically causes a delay of about five minutes.
However, on August 7th, when Team Samurai Japan clinched the gold medal against the American team in the baseball final, both the "minute-by-minute viewership" and the "SOB instant peak" reached their highest points around 10:00 PM, the moment of victory. In baseball, once the final inning arrives, predicting the outcome and posting about it becomes much easier unless there's a major upset. It was as if a massive wave of congratulatory posts flooded in precisely "at that moment." It felt like everyone was waiting, smartphone in hand, typing "Congratulations! Japan!!" and ready to hit the post button.
The "Twitter-specific reactions from younger generations" to the "Dragon Quest March" during the opening ceremony, along with the "reactions to Samurai Japan's victory" that saw a wide range of generations celebrating, both represent fascinating results showing how many people were watching the TOKYO2020 event.
As interest became nationwide, posts from younger and female demographics increased
Figure 4 analyzes TOKYO2020-related tweet authors by gender and age group. The "Buzz Viewn!" system uses AI to estimate authors' "gender and age group."
This estimation is not based on individual posts but is achieved by analyzing vast amounts of posting data. Furthermore, the system is trained using "media exposure panels" held by research companies as training data, resulting in a very high accuracy rate.
Traditional social listening analysis faced the challenge of unclear "gender and age composition," necessitating reliance on manual labor. However, while impossible for humans, AI machines can now estimate profiles. That said, even with current technology, the computational load remains quite high. It was precisely because it was July 2021 that estimation became feasible at the scale of millions of posts daily.
Moving forward, I believe buzz analysis should be shared with higher precision, based on the premise of "estimating personal profiles" rather than "identifying specific individuals."
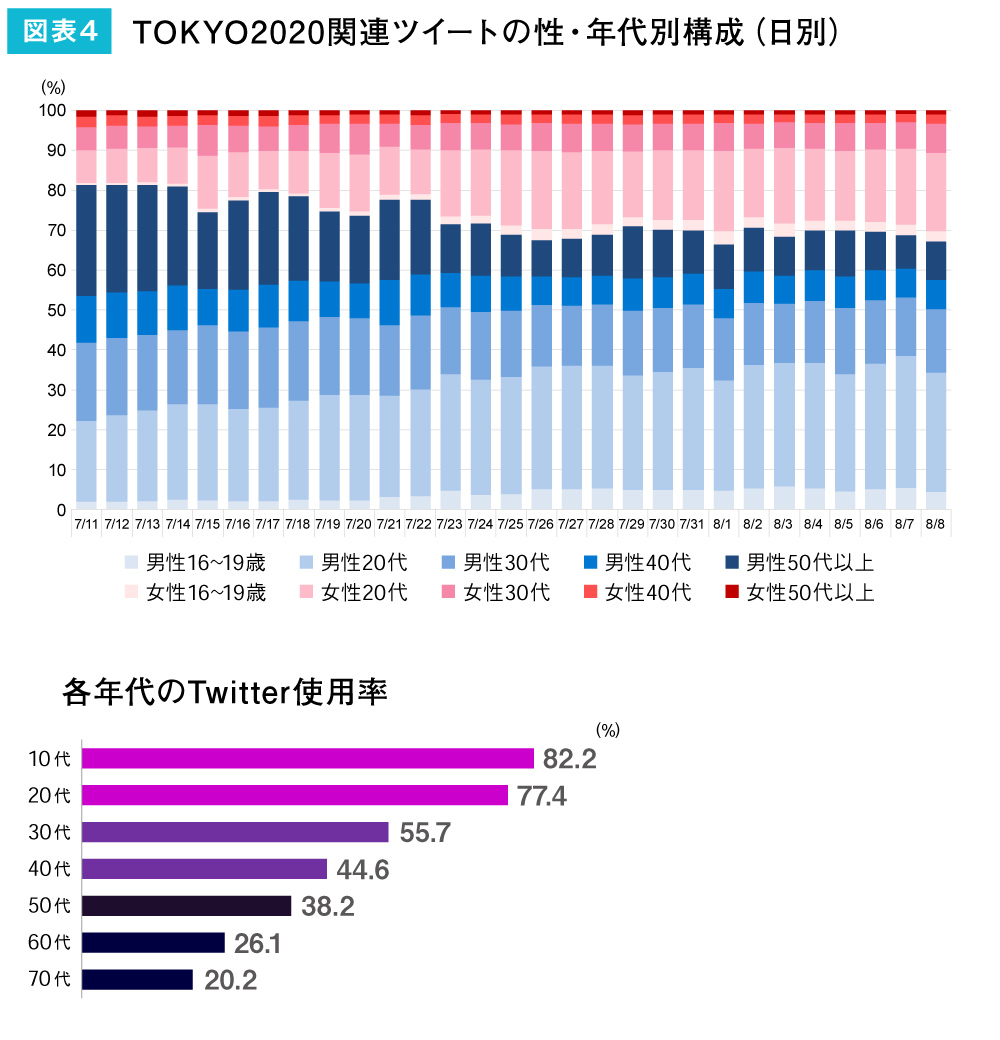
Now, please focus on Figure 4. This is a trend graph showing the estimated distribution of all daily TOKYO2020-related tweet accounts by gender and age group. It reveals that men aged 50 and above were actively posting before the TOKYO2020 opening ceremony. Conversely, younger users, especially women in their teens and twenties, were not posting as much. However, starting around July 23rd, the volume of posts gradually began to increase and continued to rise steadily until the end of the Games. It becomes clear that it was the younger generation and women who were moved by the athletes' struggles and efforts, sending their support through tweets, especially as the Games progressed.
That said, it's more accurate to say this shift brought the composition closer to Twitter's typical user demographics.
As shown in the lower chart of Figure 4, Twitter's usage rates by generation are: teens at 82.2%, twenties at 77.4%, thirties at 55.7%, and fifties at around 38.2%. Based on this demographic composition, the proportion of tweets from men aged 50 and above should have been around 10-20% ( ). However, as the athletes' performances sparked nationwide, cross-generational interest in the Games, the composition shifted towards the actual demographic ratio. As Olympic fever spread widely among the general public, all generations began sending their cheers.
The top sports by post volume were "Baseball" and "Soccer." "Cycling" popularity also hinted at a new era of broadcasting.
Next, let's examine the composition ratio by sport for all posts made during the actual competition period, July 21 to August 8.
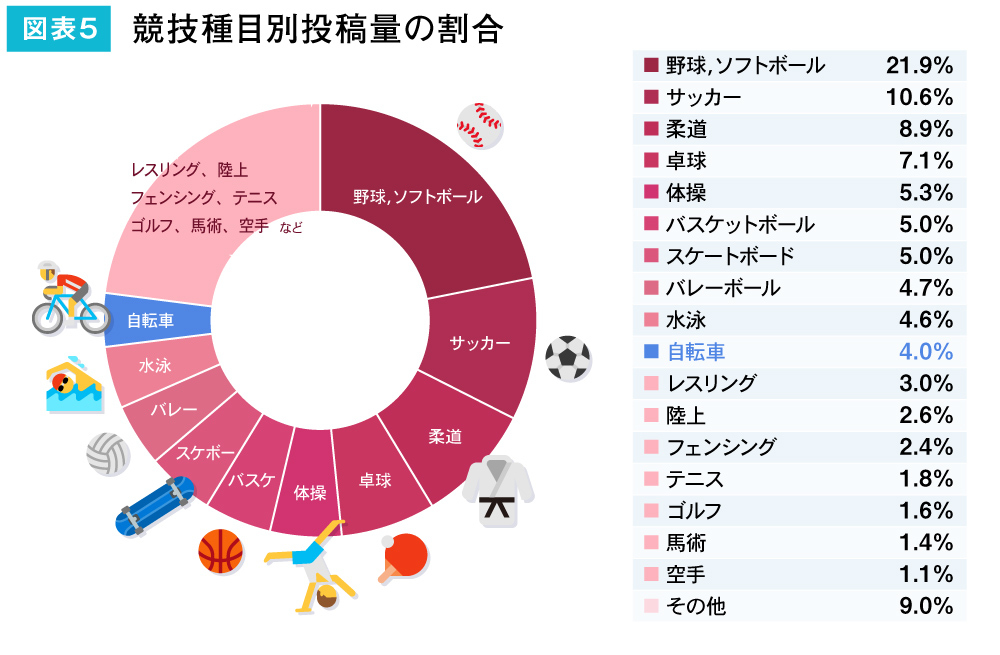
Posts were highest mainly for team sports. Among these, "Baseball, Softball" and "Soccer" stood out significantly. Within this context, "Cycling" deserves attention. Despite limited TV coverage for cycling events—including no broadcast of the road race—it still ranked in the top 10.
The road race, broadcast only online, covered long distances—approximately 244km for men and 147km for women—across Tokyo, Kanagawa, and Shizuoka. The race lasted over six hours. This meant the course passed through the "hometowns" of countless people living in these three areas. One reason for the increased posts was likely a kind of commemorative posting movement: seeing Olympic athletes race near one's home or hometown naturally made people want to post about it.
For many, hosting the Olympics in their home country is a once-in-a-lifetime opportunity. In a situation where world-class athletes were competing right nearby yet direct viewing wasn't possible, cycling may have symbolized one of the few sports people could personally connect with and post about.
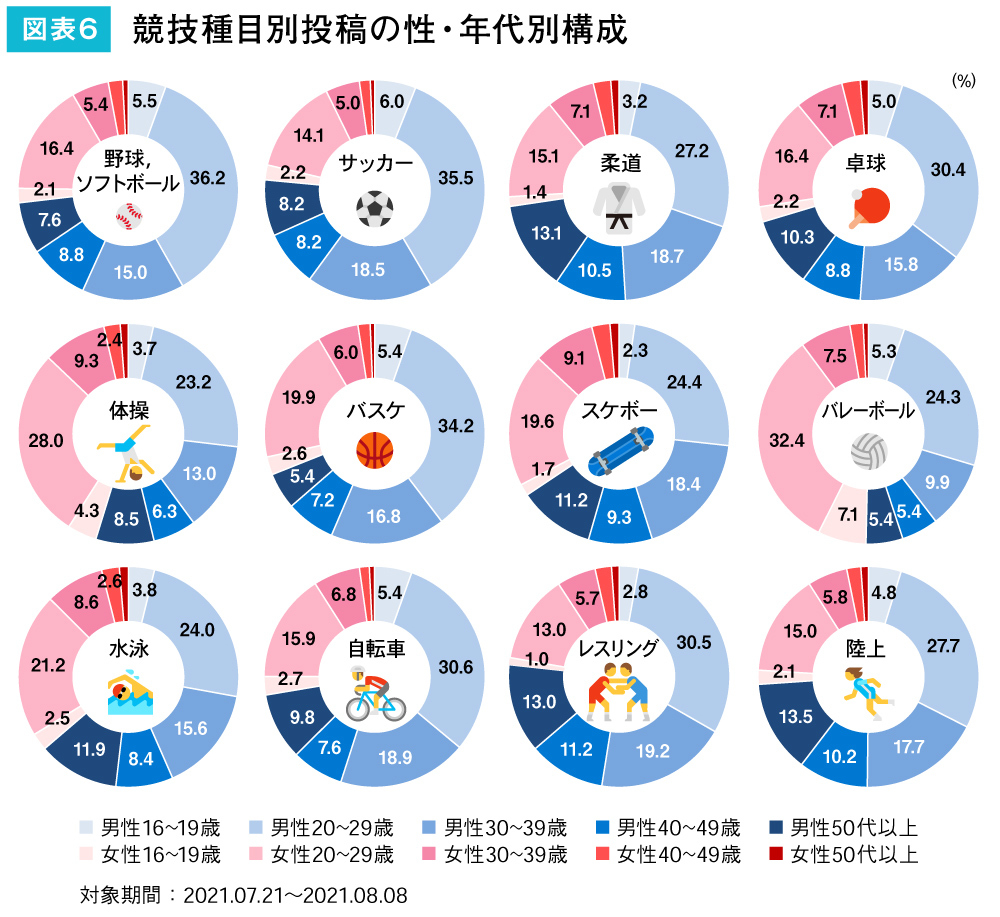
Looking at the age and gender breakdown of posts by sport (Figure 6), cycling saw a majority of male users. Among men in their 30s and 40s, there is a significant cycling population, and this demographic also aligns well with the internet generation. Volleyball's user composition most closely resembled Twitter's overall user base, confirming it was the most widely enjoyed sport across demographics.
Technology that evolved with each Olympics boosted buzz visualization
In 2021, we watched the Olympics held amidst the ongoing COVID-19 pandemic with mixed feelings. Further AI analysis of posts revealed that as we witnessed athletes striving in their events, posts expressing enjoyment and support for the Olympics gradually increased.
With each Olympic Games, various technologies have advanced, and television broadcasting has continuously innovated—from black-and-white to color, then to high-definition, 4K, and 8K. Internet streaming also emerged. For TOKYO2020, live footage (either with venue audio only or with English commentary) was streamed from venues across all 33 sports, focusing particularly on events not covered by television broadcasts.
Meanwhile, the proliferation of social media has changed viewer behavior. Fans can now send real-time cheers to competing athletes, while athletes themselves share candid thoughts before events, prompting further viewer reactions. The desire of broadcasters and streaming platforms to deliver more of the athletes' struggles, combined with viewers' desire to send more support, has driven the mutual development of these technologies.
Analytical techniques have also advanced. "Buzz Viewun!" uses AI to not only analyze the volume and demographics of posts, as previously introduced, but also estimate the ratio of positive to negative sentiment and identify representative tweet content. We aim to continue refining our technology and analytical methods to preserve these records of people's voices – the "buzz."
The hashtag #arigato was widely posted by athletes during the closing ceremony. These were tweets expressing gratitude: "Thank you for giving us athletes this irreplaceable opportunity to compete during such a difficult time!" It's true there were mixed opinions. There were voices of caution, voices of the athletes, and many other voices. If we managed to record even a fraction of that, can we say this analysis had some meaning?

Was this article helpful?
Share this article
Newsletter registration is here
We select and publish important news every day
For inquiries about this article
Back Numbers
Author

Hiroyuki Tanai
Dentsu Inc.
Solution Creation Center
Creative & Marketing Director
Since the early days of mobile phones, I have been involved in various campaigns as a mobile market specialist. I began researching buzz in 2015. In 2016, I launched "BuzzWatch." Recognizing the limitations of labor-intensive social listening methods, I embarked on AI automation. Foundational development was completed in 2021. I provide this analysis engine (Dentsu BuzzENGINE) and collaborate with Video Research Ltd.'s "Buzz Boooon! (trademark pending)."