Note: This website was automatically translated, so some terms or nuances may not be completely accurate.
Media Usage Becomes Part of "Daily Life"! Analyzing Trends Before and After the Pandemic
Dentsu Inc. Media Innovation Lab published the " Information Media White Paper 2022 " (Diamond Inc.) in March.
In 2021, the second year of living with COVID-19, people were still urged to limit outings to prevent the spread of infection. The Tokyo 2020 Olympic and Paralympic Games, postponed for a year, were held with almost no spectators. Many people experienced the Games through various media, including television, and actively shared their impressions online. Against this backdrop, the "Information Media White Paper 2022" featured the following opening special reports:
■Feature I: The Current State in the Second Year of the Pandemic – Changes in Media Consumption Behavior and TOKYO2020
・Part-1: Media Consumption Habits in the Second Year of the Pandemic and Connected TV Usage Trends
・Part-2: TOKYO2020 Through Buzz: THE MONUMENT OF TOKYO2020
This series will introduce parts of the above feature over three installments. The first installment covers the latest trends in media usage.
Life with the Prolonged Pandemic: Insights from Changes in "Time Spent Awake at Home"
Using MCR/ex survey data (※1) for the Tokyo 50km radius (June surveys each year), we examine changes in daily activities and media consumption behavior before and after the pandemic.
*1 = MCR/ex Survey
A diary-style survey conducted by Video Research Ltd. over a specific week. It captures consumers' activities—including basic daily routines and media exposure—by day of the week along a time axis, in minimum 15-minute increments.
Figure 1 shows the average daily time spent at home after waking, time spent outside, and sleep time (ages 12-69 / weekly average) from 2019 to 2021. Focusing on the time spent at home after waking since 2020 reveals how life with COVID-19 has become prolonged.
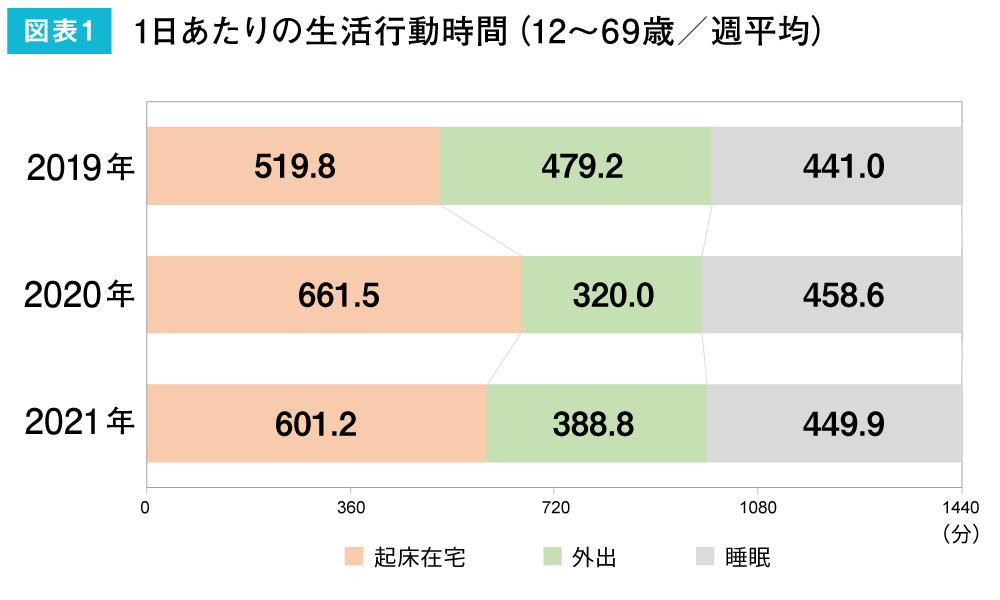
The 2020 survey was conducted during a period when residents in the Tokyo metropolitan area were strongly urged to refrain from going out, including through the issuance of Tokyo Alerts. Consequently, time spent at home reached an unprecedented length of 661.5 minutes. The following year saw 601.2 minutes, but this still represents a longer time spent at home compared to pre-pandemic 2019 (519.8 minutes). Furthermore, daily sleep duration has slightly increased since 2020.
Sleep patterns changed during the pandemic, with young people showing particularly significant shifts, though late-night habits remained unchanged
As an example of how so-called "nesting" changed daily routines, let's examine sleep patterns in greater detail. Figure 2 shows the percentage of people asleep during morning and nighttime hours ("sleeping activity rate") for those aged 12 to 69, averaged weekly in 15-minute intervals. From 2019 to 2021, there was no noticeable change in the percentage of people asleep between 10 PM and midnight.
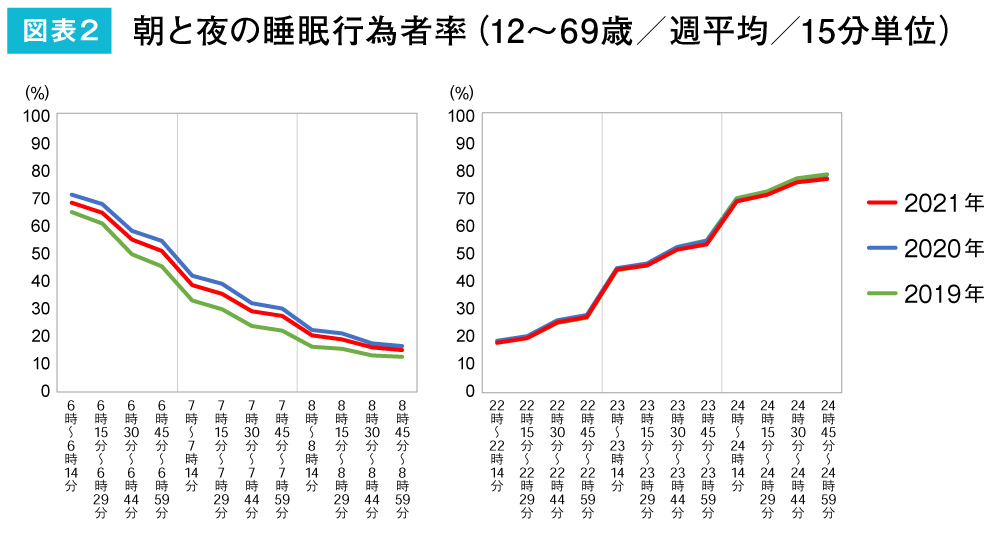
Conversely, the sleep activity rate during the 6:00 AM to 8:00 AM period rose in 2020 and fell slightly the following year. However, it has not returned to the 2019 pre-pandemic level. This indicates that wake-up times have shifted later since 2020. The increase in daily sleep duration observed post-pandemic can be interpreted as being secured through sleeping in.
Young people experienced the most significant changes in their daily patterns throughout the pandemic. Figure 3 shows the case for those aged 12 to 19, which includes many students. It reveals that the fluctuation in the rate of morning sleepers before and after the pandemic is larger for this age group than for the overall population (ages 12 to 69). In 2020, when school closures, remote learning, and telework became widespread, the need to wake up early for commuting or going to school disappeared. However, by 2021, as life normalized, wake-up times likely approached pre-pandemic levels.
Looking at nighttime sleep patterns, it is interesting to note that the sleep activity rates for both 2020 and 2021 remained lower than in 2019. While the rate of morning sleep activity fluctuated, the tendency to stay up late appears unchanged over these two years.

When considering how people engage with media, such fundamental shifts in daily patterns hold significant meaning. This is because they are likely to greatly impact media usage that has become habitual and integrated into daily life, such as watching morning TV as a substitute for a clock or falling asleep while watching videos on smartphones.
Mobile internet usage surged after the pandemic
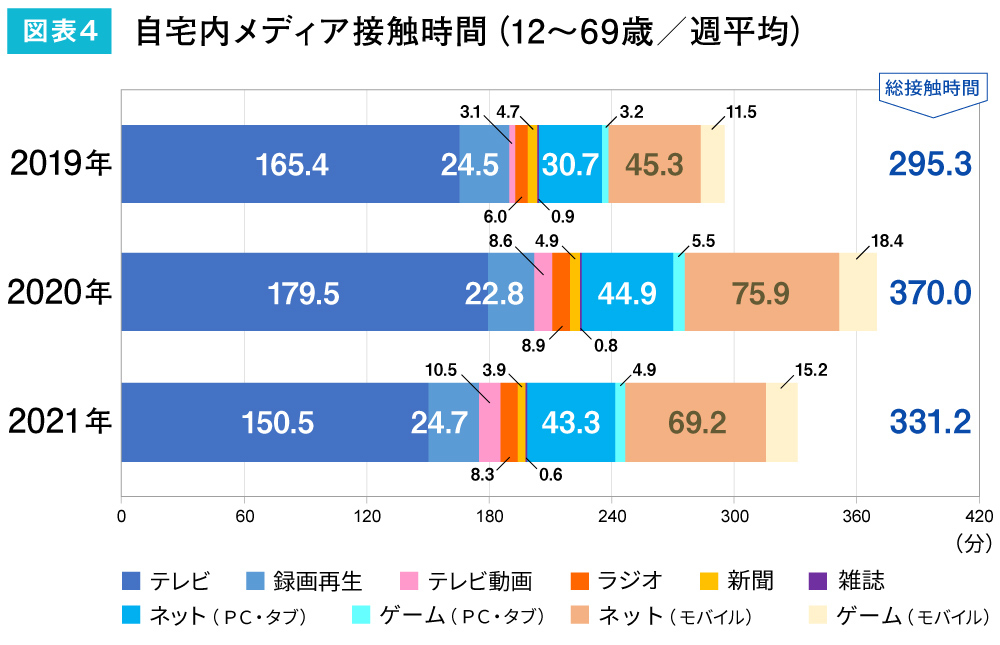
Figure 4 shows average weekly home media exposure time per day (ages 12-69). While simultaneous exposure to multiple media is possible, the total exposure time across all media reached 370 minutes in 2020, driven by increased time spent at home after waking. Though this decreased to 331.2 minutes in 2021, it still exceeds pre-pandemic levels.
Time spent on individual media generally follows the same trend. Looking at internet usage by device, while PC and tablet usage increased, mobile usage (smartphones, mobile phones/PHS) saw a particularly sharp rise.
Meanwhile, real-time TV viewing in 2021 fell below 2019 levels. Furthermore, "TV video"—referring to online video viewing on TV screens—saw rapid growth in usage since the pandemic began.
Media Usage as Part of "Daily Activities"
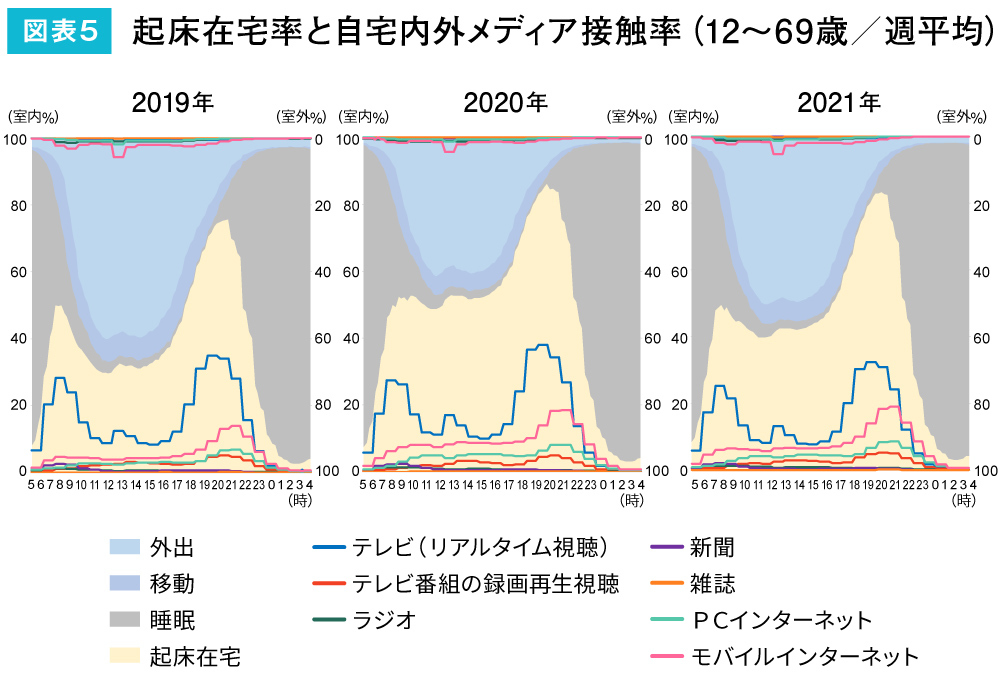
How are people engaging with media as their daily patterns shift during the pandemic? Figure 5 shows the trends in the percentage of people awake at home, sleeping, commuting, or going out (in 15-minute intervals) and their media engagement rates (in 60-minute intervals) throughout the day starting at 5:00 AM (average weekly data for ages 12-69). The dip in the daytime wake-at-home rate (shown in yellow) indicates that while more people ventured out during the day in 2021 (the second year of the pandemic) compared to the previous year, daily routines had not returned to 2019 levels.
The downward-sloping line graph at the top of the figure shows media contact rates while out. In all years, mobile internet usage around noon stands out slightly. Media consumption primarily occurs at home, with television showing peaks in the morning, afternoon, and evening. Alongside this, mobile internet usage surges sharply into the evening, making it a prominent trend.
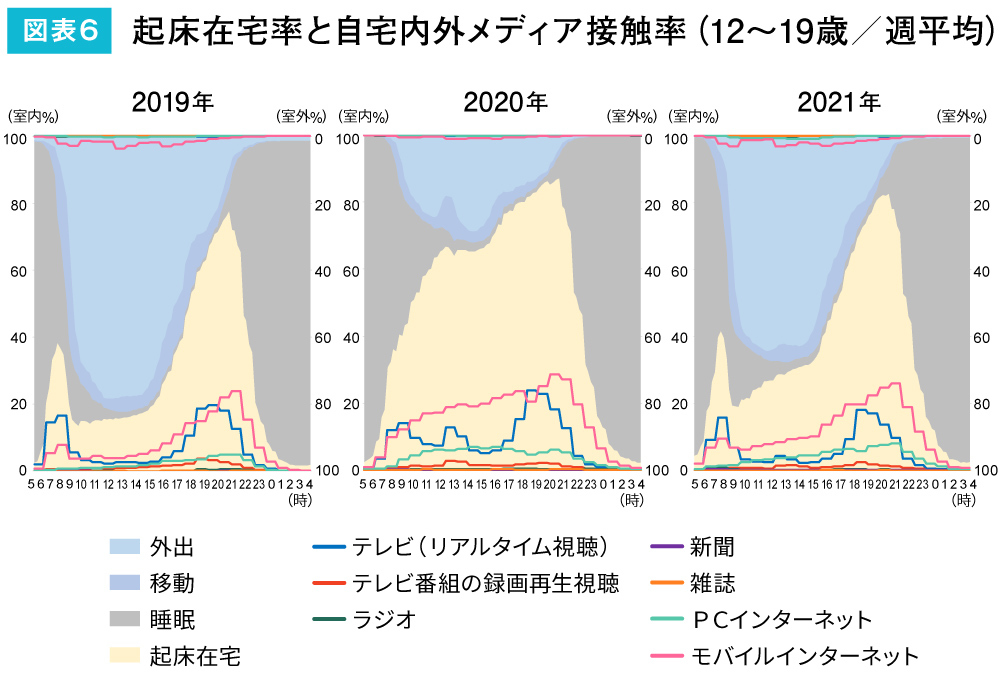
Mobile Internet Use Dominates Media Consumption Among Teens
Finally, we present the trends for 12- to 19-year-olds, where mobile internet usage is particularly pronounced (Figure 6). In 2021, daytime mobile internet usage at home decreased compared to the previous year due to increased outings. However, except for the morning hours, it surpassed television contact almost throughout the day.
Particularly after the peak TV viewing time around 7 PM, media engagement shifts to mobile internet. For evening media use, one can imagine scenarios such as watching TV with family during dinner, then primarily using smartphones in their rooms to access online videos and social media until just before bedtime.
In this way, media usage can be seen as part of daily life activities. While it is easily habitualized because it is integrated into daily life, it can also bring rhythm to life throughout the day. As life with COVID-19 continues, we will continue to watch how people's relationship with media evolves going forward.
[Survey Overview]
Survey Name: MCR/ex
Conducted: June and December of each year
Survey Method: Electronic questionnaire survey
Survey Areas: Tokyo 50km radius, Kansai region, Nagoya region, Northern Kyushu region, Sapporo region, Sendai region, Hiroshima region
Survey Participants: Individuals aged 12 to 69 (area-random sampling)
Survey Company: Video Research Ltd.

Was this article helpful?
Share this article
Newsletter registration is here
We select and publish important news every day
For inquiries about this article
Author

Mariko Morishita
Dentsu Inc.
Marketing Administration Center, Media Innovation Research Department (Dentsu Inc. Media Innovation Lab)
After working in the theater industry and research institutions, he joined Dentsu Inc. He conducts extensive research and studies on the impact of technological innovation on the information media market, focusing on audience trends. He also monitors developments in the broadcasting industry and related policies in Western countries.