Note: This website was automatically translated, so some terms or nuances may not be completely accurate.
Is Japan's Soft Power Driving Inbound Tourism Recovery? Latest Visitor Needs and Promotion Strategies
Over a year has passed since October 2022, when Japan significantly eased its border measures against COVID-19. The Japan National Tourism Organization (JNTO) announced on November 15th that October's inbound visitor numbers reached 2,516,500, representing 100.8% of the same month in 2019.This marks the first time since the COVID-19 outbreak that the number has exceeded the same month in 2019, indicating that Japan's inbound tourism has recovered to pre-pandemic levels.
While the weak yen certainly plays a role, the strong performance appears driven particularly by increased visitor numbers from Southeast Asia (led by Singapore), as well as from Europe, the US, Germany, and Australia. Will this momentum continue? What kind of people will visit Japan going forward? Based on the results of the "Dentsu Inc. Japan Brand Survey" ( details here ), we will consider the future of Japan's inbound tourism.
<Table of Contents>
▼Japan is the #1 destination people want to visit next, but there are differences by country/region. The key to continued growth lies with repeat visitors.
▼As COVID-19 impacts fade, "experiences only possible in Japan" gain popularity. Repeat visitors are now targeting "Hokkaido" and "Kyushu"
▼ Was Japan's soft power behind the inbound recovery? Fans of Japan, arriving through diverse entry points, experience the Japan they love
Japan is the No. 1 destination people want to visit next, but there are differences by country/region. The key to sustained growth lies with repeat visitors
When asked about specific countries/regions they are considering for their next overseas trip, Japan ranked No. 1, far outpacing the second-place United States. Notably, scores were particularly high among those with prior visit experience (Chart ①).
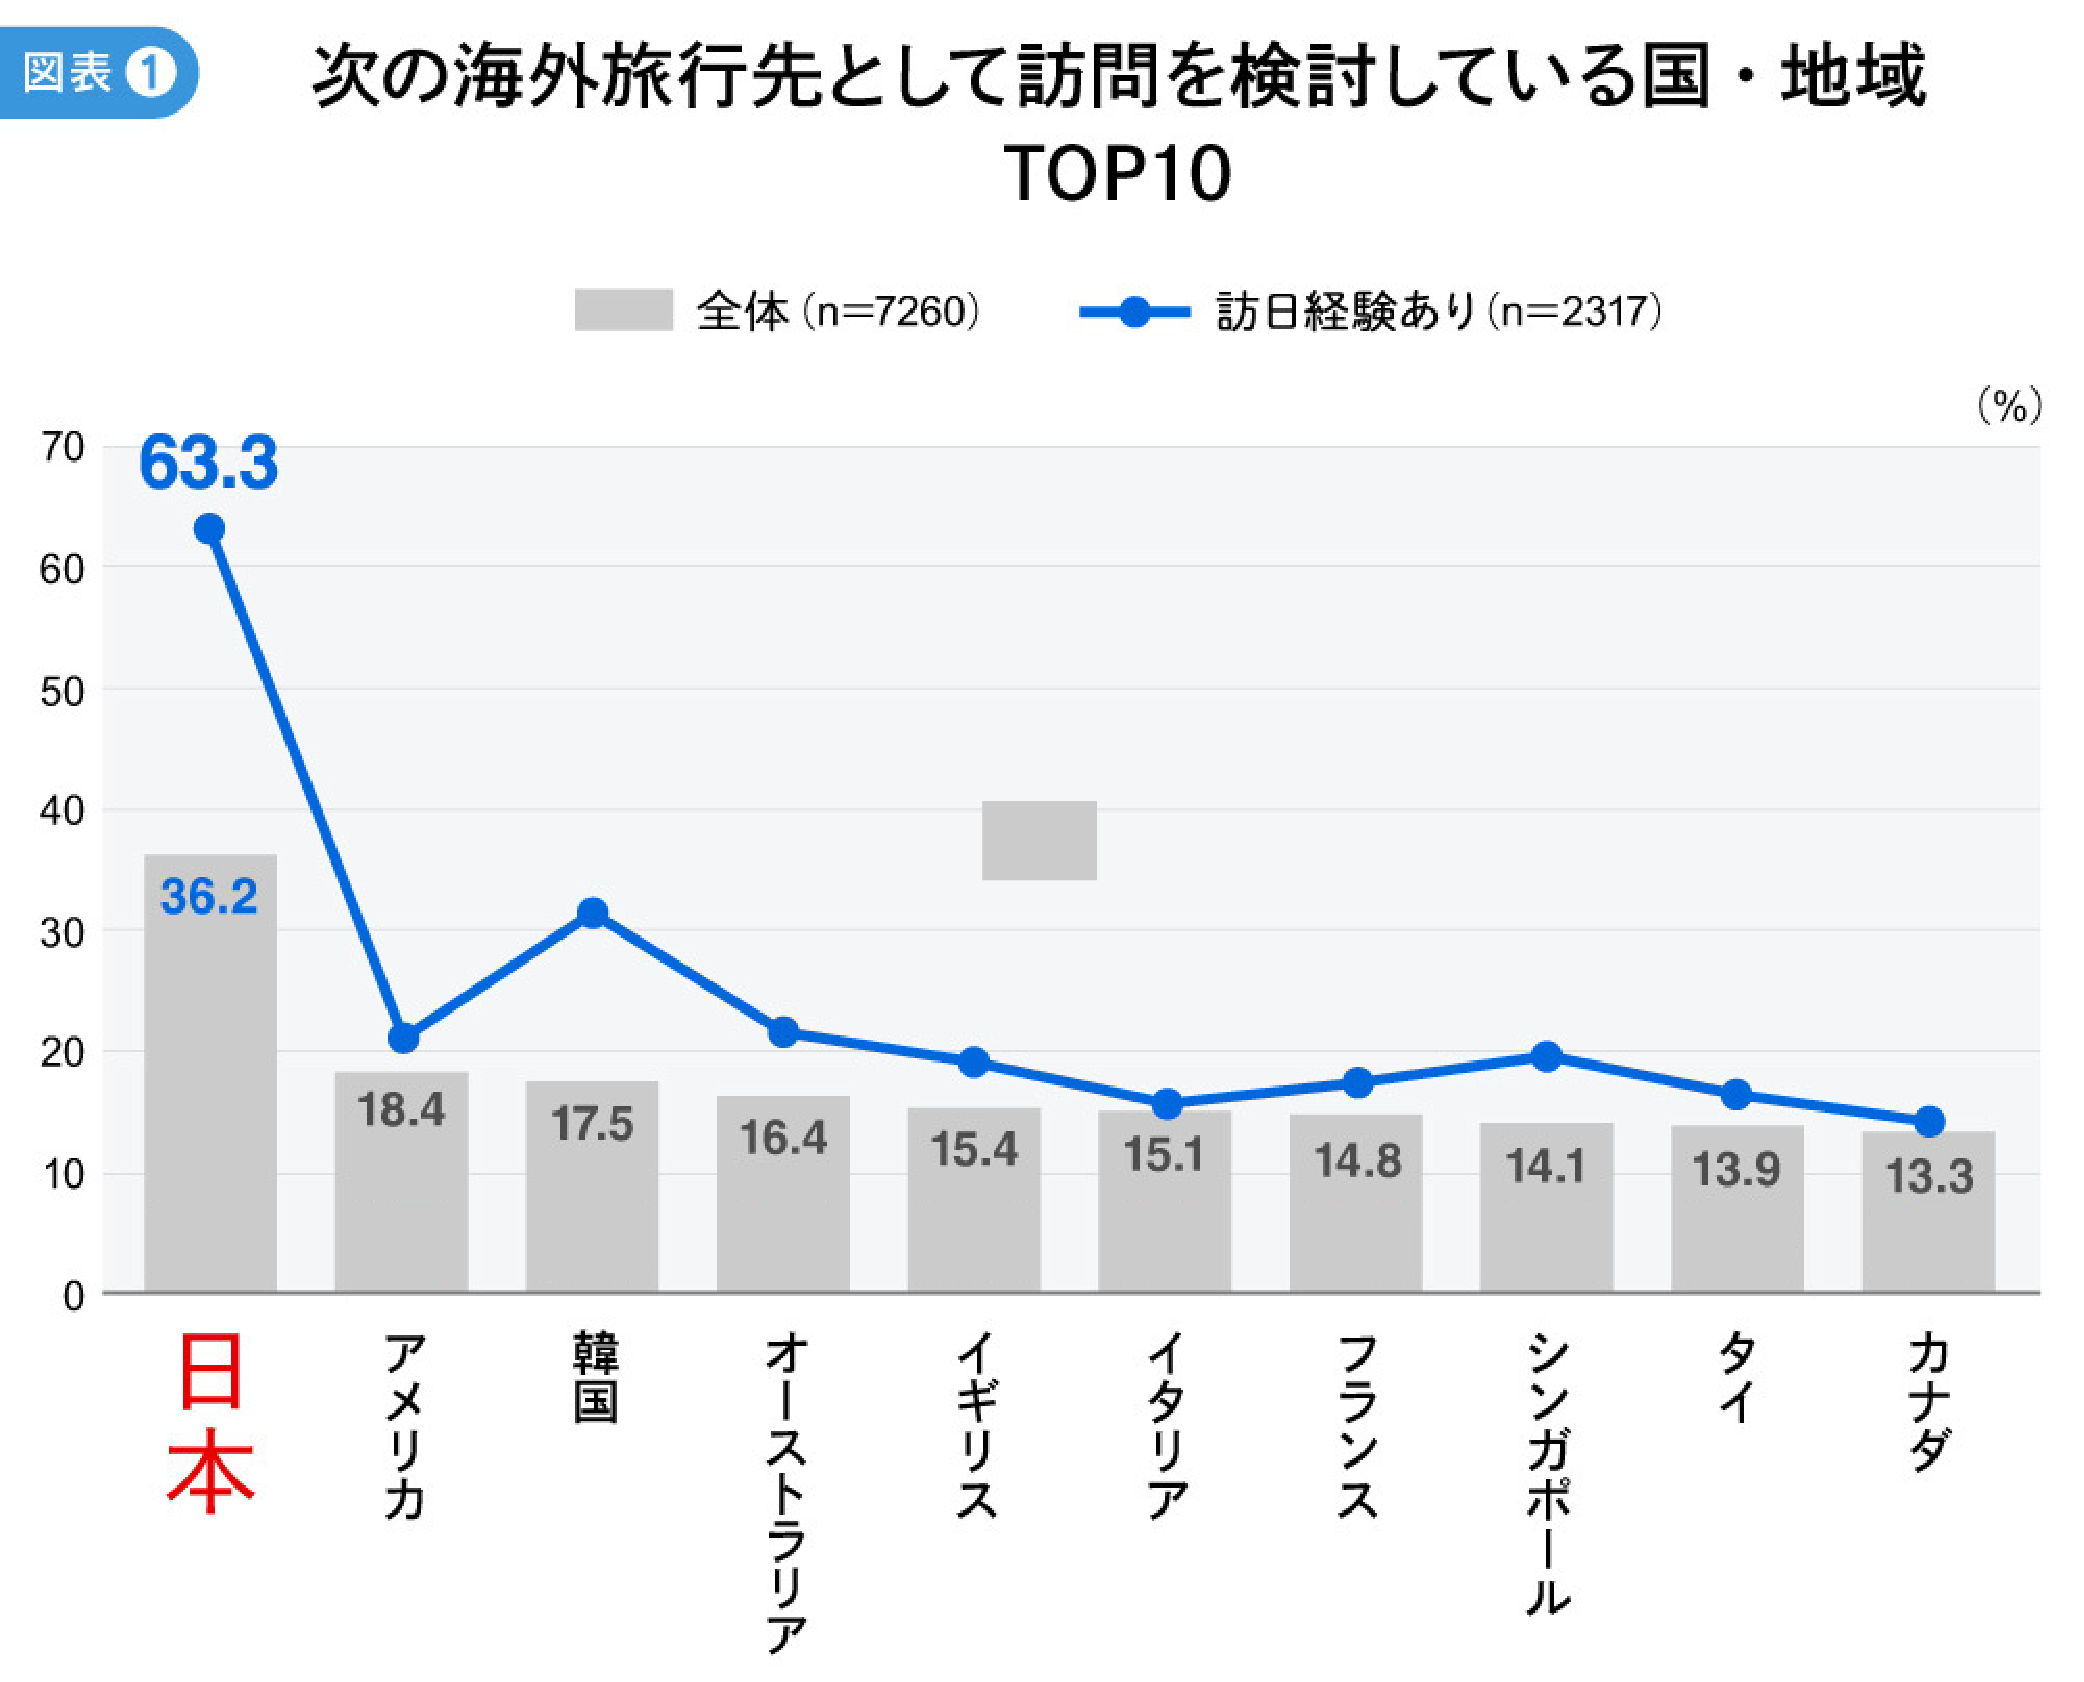
Conversely, examining Japan's ranking by country/region reveals it placed 4th in the US and failed to break into the top 5 in several European countries (Chart 2). This indicates that while Japan is recognized as a "desired future travel destination" (2022 survey), it is not yet widely considered as a concrete "next travel destination" by many.
For Japan's inbound tourism to continue growing, the challenge lies in prompting concrete action from those who vaguely "want to visit," particularly encouraging those who have already visited Japan—who seem more likely to take action—to return and nurturing them as repeat visitors.
As the impact of COVID-19 fades, "experiences unique to Japan" are gaining popularity. The areas repeat visitors are targeting next are "Hokkaido" and "Kyushu."
When asked again this year about "things they want to do in Japan," changes appeared in the top items. In the previous results, nature-related experiences, which had gained significant interest due to the pandemic, dominated the top spots and scored significantly higher than others.
In this survey, while nature-related experiences remain in the top 10, their scores and rankings have fallen. Instead, theme parks have risen in rank, and experiences like "staying at a traditional Japanese inn" and food-related activities have newly entered the top 10 (Chart 3).
Looking at the results for those with prior visit experience using the same question, the top items remain unchanged. However, compared to the overall results, "nature"-related experiences appear among the items with higher scores, while "food" and "hot spring"-related experiences stand out (Chart ④).
Food and hot springs were perennial top-ranked activities in pre-pandemic Japan travel. These results suggest that major demand for Japan travel has returned to pre-pandemic levels, while "unique Japanese experiences" perceived as appealing—such as theme parks and izakaya—are diversifying further.As overseas travel becomes commonplace again and the impact of COVID-19 fades, it seems we can interpret this as a growing tendency to seek "experiences only possible in that specific place," regardless of whether they are nature-related or not.
So, where specifically in Japan are visitors heading? The top "prefectures people want to visit" remain unchanged: Tokyo, Hokkaido, Osaka, Kyoto, and Okinawa. However, looking at the intentions of those with prior visit experience, scores are particularly high for Hokkaido and the Kyushu region.
Looking at the details, scores are high not only in popular areas like Hokkaido, Okinawa, and Kyoto, but also in "areas they haven't visited before" like Tohoku and Kyushu; "places with theme parks" like Osaka and Nagasaki; and "places accessible from major cities" like Kanagawa, Chiba, Saitama, and Nara (Figure 5).
From staple cities like "Tokyo," "Osaka," and "Kyoto" to nature-rich areas like "Hokkaido" and "Okinawa." Furthermore, repeat visitors delve deeper into the specific Japanese attractions that interest them, venturing into areas previously less frequented by foreign tourists. By nurturing repeat visitors, we can expect a broader spread of people to diverse regions.
Was Japan's soft power behind the inbound recovery? Fans of Japan who entered through diverse gateways experience the Japan they love
What kind of people are these "previous visitors" or "intended visitors" who are repeaters or have the potential to become repeaters? Looking at the impressions of Japan held by "previous visitors" and "intended visitors," it becomes clear that many have a high level of favorability toward Japan (Figure 6).
In a 2019 article, we noted that "people who like Japan are often those who have visited Japan," and this survey confirms the same trend.While positive sentiment toward Japan tends to be particularly high in Southeast Asian countries and regions, compared to pre-COVID levels, it has also increased in non-Asian countries like the United States, the United Kingdom, and Australia (compared to the 2019 survey, the combined score for "very fond" and "somewhat fond" increased by +5.1 points in the U.S., +9.5 points in Australia, and the "very fond" score rose by +7.8 points in the UK).
Earlier, we mentioned the increase in travelers from Southeast Asia and North America. This rising favorability is likely one factor driving the surge in visitor numbers to Japan, which are approaching pre-pandemic levels.
Moreover, people who like Japan not only have a higher frequency of eating Japanese cuisine (Chart ⑦) but also a higher rate of purchasing Japanese products (Chart ⑧). This tendency is even more pronounced among those who have visited Japan.
As seen in the earlier results regarding "things people want to do in Japan," "food" and "shopping" rank highly. People develop an affinity for Japan through various entry points like food, products, and content. They then visit Japan to experience their favorite things firsthand and purchase items they love. This suggests that Japan's soft power – its culture and values – is serving as the catalyst for visits and driving the recovery of inbound tourism.
Furthermore, visitors to Japan discover new charms and pursue different pleasures. This virtuous cycle likely fosters repeat visitors and expands business opportunities related to Japan.
Future inbound promotion planning should incorporate perspectives beyond travel needs. For instance, considering the distribution status of Japanese products and the penetration of Japanese culture and cuisine in target countries could lead to initiatives that drive more actionable engagement.
*Country and region names in this article are written for a Japanese domestic audience, adhering to Japanese social norms and business practices.
【Contact for Inquiries Regarding This Matter】
Dentsu Inc. Japan Brand Project Team
japanbrand@dentsu.co.jp
Japan Brand Survey Hub Page
https://www.dentsu.co.jp/knowledge/japan_brand/
【About the Dentsu Inc. Japan Brand Survey】
Dentsu Inc.'s proprietary survey launched in 2011 to understand how the Japan Brand was perceived globally when reputational damage affected Japanese agricultural and marine products and inbound tourism following the Great East Japan Earthquake. In 2022, it evolved into a cross-company project activity with enhanced expertise through a fundamental restructuring of its survey design, analytical approach, and outputs.In 2025, it will newly plan and build a knowledge portfolio for the general public, aiming to create social value grounded in consumer insights.
The Japan Brand Survey regularly gauges the awareness and actual attitudes of overseas consumers regarding the Japan Brand as a whole, covering areas such as inbound tourism, regional revitalization, food, Japanese products, content, values, lifestyles, and social trends. It visualizes the changing sentiments of consumers and the challenges and potential of the Japan Brand, contributing to increasingly complex corporate activities while also promoting cross-cultural understanding within Japanese society.
【Dentsu Inc. Japan Brand Survey 2023: Survey Overview】
・Target Areas: 19 countries/regions (United States, Mainland China, South Korea, Taiwan, Hong Kong, Singapore, Thailand, Malaysia, Indonesia, Vietnam, Philippines, India, Australia, Saudi Arabia, United Kingdom, France, Germany, Italy, Spain)
・Sample Size: 7,260 (Breakdown: United States 960, Mainland China 1,200, Other countries/regions 300 each)
・Survey Period: December 2022 to January 2023
・Respondent criteria: Men and women aged 20–59 (middle-income and above)
・Survey Method: Online survey
・Research Organizations: Dentsu Inc. (Principal Investigator), Video Research Ltd. (Implementation Support)
[Notes and Disclaimers]
※1: Mainland China coverage primarily includes Tier 1 cities; India coverage includes Delhi and Mumbai; Australia coverage includes the Sydney metropolitan area; Southeast Asia coverage is primarily limited to metropolitan areas.
※2: Definition of middle-income level: Criteria set per country based on national average income (e.g., OECD statistics) and social class classification (SEC).
※3: Samples were collected with equal allocation by gender and age group for each country/region, then weighted to match the population composition.
※4: Proportions in this survey are rounded to the second decimal place (or first decimal place for some integer values), so totals may not add up to 100%.
※5: Country and region names used in this survey report and on the website follow the longstanding views of the Japanese government, Japanese social norms, and business practices.
※6: In creating the charts and graphs for this survey, the names of the countries and regions analyzed use the international standard ISO Country Code (ISO 3166-1 alpha-2/3), with some exceptions.
United States/US/USA, Canada/CA/CAN, Australia/AU/AUS, United Kingdom/UK/GBR, Germany/DE/DEU, France/FR/FRA, Italy/IT/ITA,Spain/ES/ESP, Finland/FI/FIN, United Arab Emirates/UAE, Saudi Arabia/SA/SAU, India/IN/IND, Indonesia/ID/IDN, Singapore/SG/SGP, Malaysia/MY/MYS, Philippines/PH/PHL, Thailand/TH/THA,Vietnam/VN/VNM, Mainland China/CN/CHN, Hong Kong/HK/HKG, Taiwan/TW/TWN, South Korea/KR/KOR
※7: The names of countries and regions used in this survey are for statistical or analytical convenience only and do not indicate any political stance or viewpoint.
※8: The maps used in this survey (world map and Japan map) have been partially modified and cropped to suit the analysis content and page layout. They do not necessarily accurately reflect national borders or territorial boundaries.
Was this article helpful?
Share this article
Newsletter registration is here
We select and publish important news every day
For inquiries about this article
Author

Katsura Nakazato
Dentsu Inc.
Fourth Marketing Bureau
Communications Director
Since joining the company, I have been part of the Marketing Section. I have been responsible for communication planning for companies and government agencies across diverse fields including food, beverages, cosmetics, and apparel. I have also worked on numerous overseas public relations projects for government agencies and local governments. Since 2013, I have been in charge of conducting the 'Dentsu Japan Brand Survey.' I am a member of the Dentsu Inc. Team Cool Japan.