Note: This website was automatically translated, so some terms or nuances may not be completely accurate.
Examining the Reality of Hokuriku Tourism Through Location Data—Part 4 [NewsPicks × Dentsu Inc. News]
I'm Akimoto, a researcher at Dentsu Inc. 's "Human Flow Lab." This is the fourth installment of the "Hokuriku Tourism" series.
Please refer to the first, second, and third articles here.
Analyzing Hokuriku Tourism Trends Using Location Data - Part 1
Examining the Reality of Hokuriku Tourism Through Location Data - Part 2
Examining the Reality of Hokuriku Tourism Using Location Data - Part 3
For this final fourth installment, we will proceed with our analysis using visitors to Toyama Prefecture from the United States as an example.
Visitors from the United States have the highest average daily travel expenditure
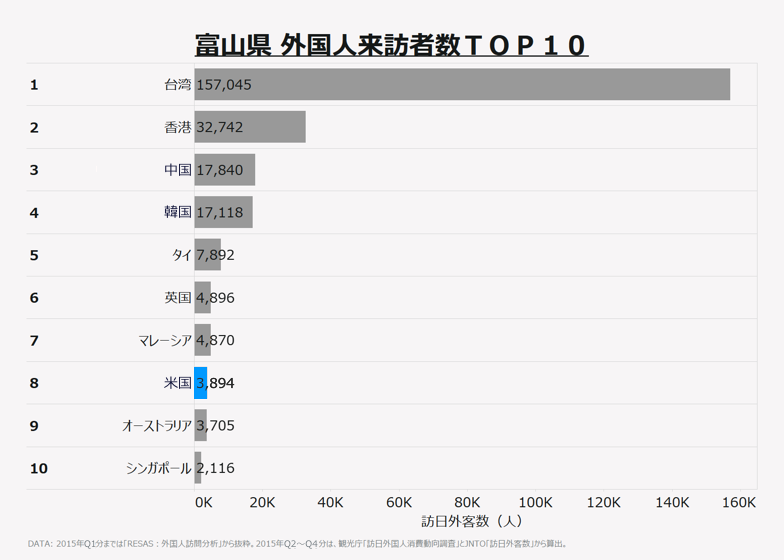
The graph above shows the ranking of foreign visitors to Toyama Prefecture by country/region from January to December 2015. Data for January to March 2015 (Q1) is excerpted from "RESAS: Foreign Visitor Analysis." Data for April to December 2015 (Q2 to Q4) is calculated from the Japan Tourism Agency's "Survey on Consumption Trends of Foreign Visitors to Japan" and JNTO's "Number of Inbound Visitors to Japan."
According to this data, visitors from Asia dominate the top positions, with visitors from the United States ranking eighth.
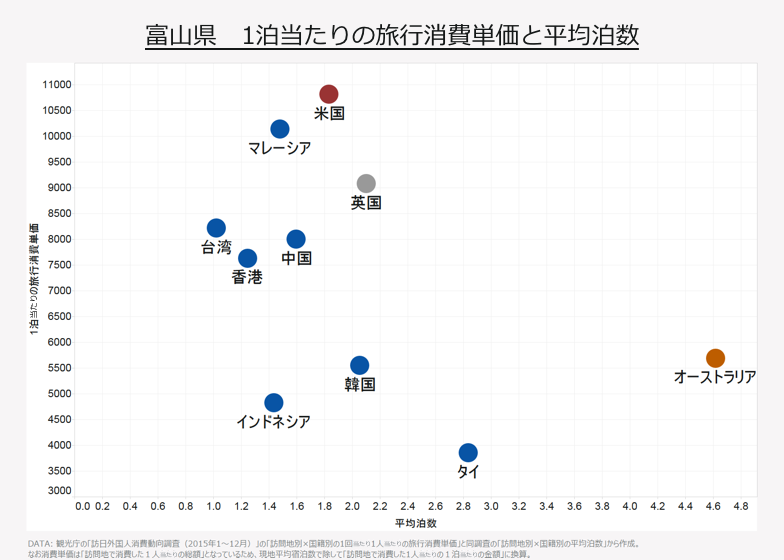
Next, we examine the average length of stay and per-person per-night travel expenditure in Toyama Prefecture by country/region. This scatter plot was created using data from the Japan Tourism Agency's "Survey on Consumption Trends of Inbound Visitors (January-December 2015)": "Per-Person Per-Visit Travel Expenditure by Destination and Nationality" and "Average Length of Stay by Destination and Nationality" from the same survey. (Since the per-person travel expenditure represents the "total amount spent per person at the destination," it is divided by the local average number of nights to convert it to the "amount spent per person per night at the destination").
This reveals that visitors from the United States have the highest per capita spending.
The pattern showing the highest number of visitors from the United States is Tokyo Area → Kyoto Prefecture → Toyama Prefecture.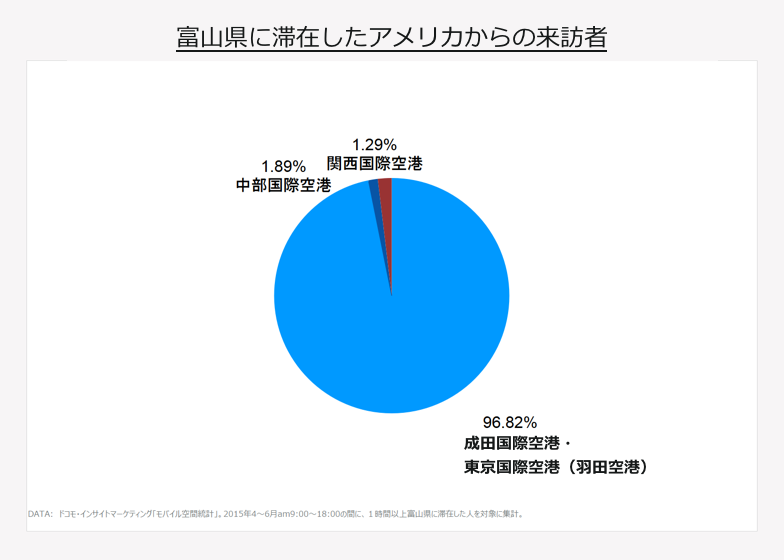
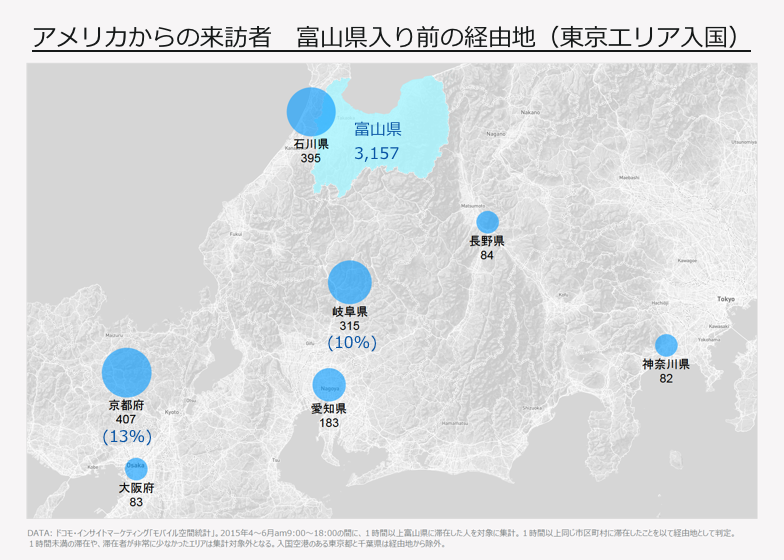
The transit points where visitors from the Tokyo area stop before entering Toyama Prefecture are widely spread across the western region. Among American visitors to Toyama Prefecture, those transiting through Kyoto account for as much as 13% of the total.
Compared to other prefectures serving as transit points, the per-person spending in Toyama Prefecture is among the highest.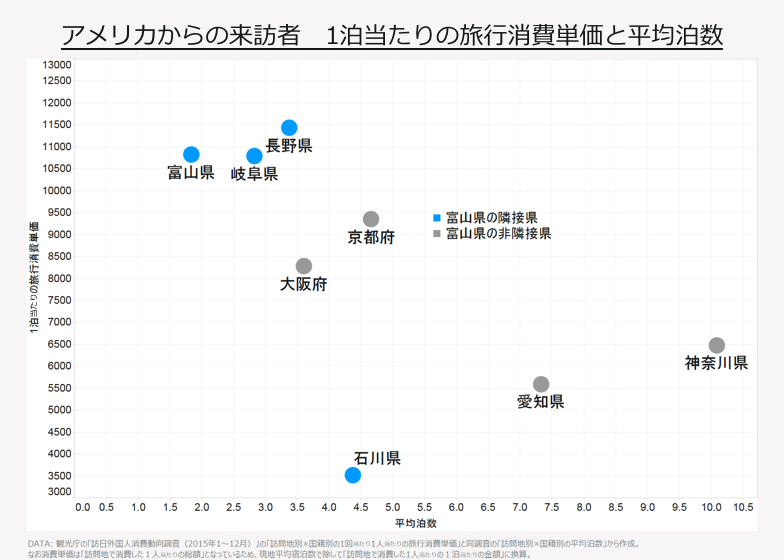
We compared the average spending per night and average length of stay with each of the prefectures identified as transit points. While the length of stay is challenging, the average spending per night ranks among the highest, alongside neighboring Nagano and Gifu Prefectures.
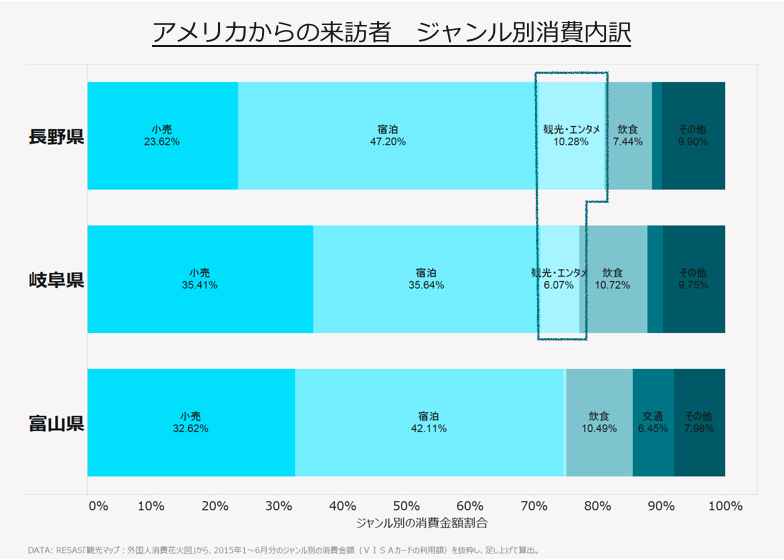
Let's examine the spending categories of visitors from the United States across the three prefectures of Nagano, Gifu, and Toyama.
Accommodation and retail combined account for about 70% of spending, a figure consistent across all three prefectures. Looking at the areas where Toyama lags in spending, Nagano and Gifu have significant tourism and entertainment spending, while Toyama has almost none. This spending covers activity fees and admission to museums or theme parks. Toyama has renowned trekking spots like the Tateyama-Kurobe area and well-known museums such as the Toyama City Museum of Art. As awareness of these tourism resources grows, it seems likely that the average spending per night could increase further.
Among foreign visitors, "Toyama Bay," "Sushi," and "Kurobe" are popular.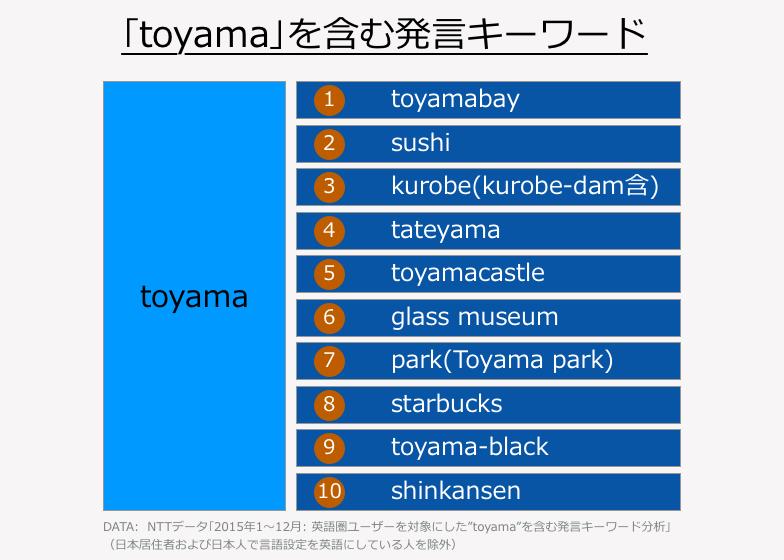
Seafood seems to resonate strongly, with "toyamabay" and "sushi" ranking as the top two mentions. Famous spots like "kurobe," "tateyama," "glass museum," and "park (Toyama-Iwate Canal Kansui Park)" are also frequently tweeted about. Incidentally, the Starbucks Coffee at Toyama-Iwate Canal Kansui Park is often described as "the world's most beautiful Starbucks store," and many tweets reflected this sentiment.
The overall impression from the tweets suggests that the appeal of Toyama Prefecture is effectively reaching foreign visitors. Going forward, the key will be further increasing awareness of these attractions and encouraging their inclusion in travel itineraries.
Using "Seafood Delights" as a Hook to Boost Visitors!?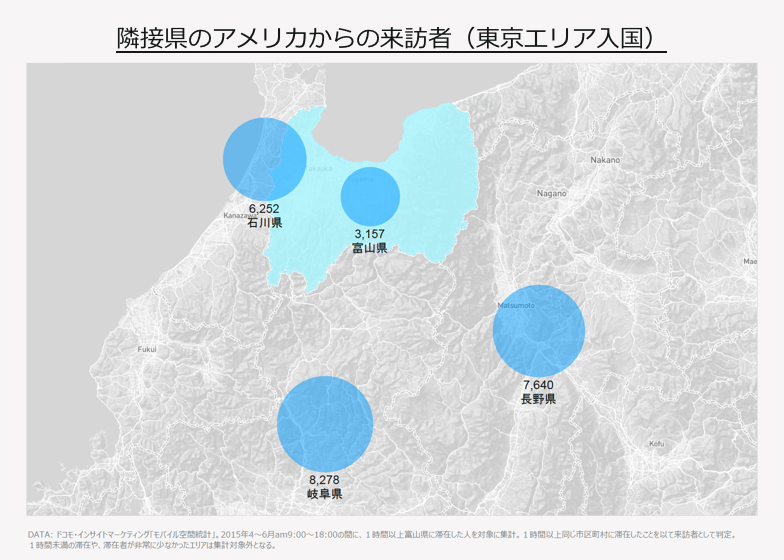
Looking at visitor numbers to Toyama Prefecture and its neighboring prefectures among visitors arriving from the Tokyo area who came from the United States, we saw a similar pattern to visitors from Taiwan: the number visiting neighboring prefectures exceeded those visiting Toyama Prefecture itself, with visits to Gifu and Nagano Prefectures being more than double. Since Gifu and Nagano Prefectures do not border the sea, teaming up with Toyama and Ishikawa Prefectures using "seafood" as a hook could significantly boost visitor numbers.
How did you find this four-part series, "Analyzing Hokuriku Tourism Trends Using Location Data"?
Let's summarize the key findings from the entire series.
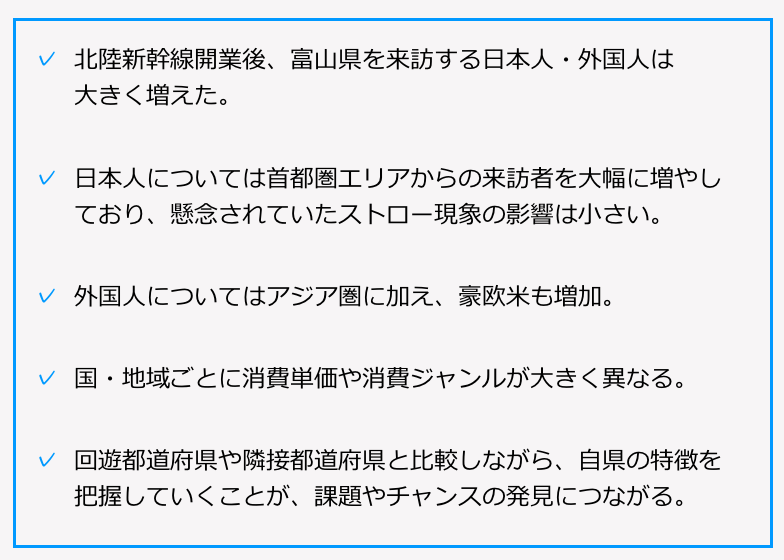
This series utilized various data sources, including RESAS and Japan Tourism Agency statistics. For broad visitor flows, we leveraged open data, while employing closed big data requiring detailed parameter settings for exploratory analysis. Qualitative use of social media data also helped grasp "behavior + purpose," making it easier to visualize the tourism realities of inbound foreign visitors.
Topics like "Regional revitalization through foreign tourists visiting Japan" and "Formation of Japanese DMOs" are frequently reported in the tourism sector. The need for data preparation and analysis is only increasing. We aim to accumulate insights to support rapid decision-making through data visualization.
NewsPicks NewsPicks offers original articles created by Japan's leading infographic editors, providing business-relevant information in an easy-to-understand format.
Mobile Spatial Statistics are population statistics created using NTT DOCOMO's mobile phone network infrastructure. "Mobile Spatial Statistics" is a registered trademark of NTT DOCOMO.
Contact: NTT DATA ソーシャルビジネス推進室info@nazuki-oto.com

Contact: Dentsu Inc. Human Flow Lab
contact@hitononagarelab.jp
Was this article helpful?
Share this article
Newsletter registration is here
We select and publish important news every day
For inquiries about this article
Back Numbers
Author

Ken Akimoto
Dentsu Inc.
Data Technology Center Geodata Solutions Department
After working at a major automaker's marketing subsidiary, joined the company in 2001. Expanding domains: Sales → New Business Development → Creative → Data Business. In 2018, launched a department solving client marketing challenges using location data, providing data-driven marketing services with "Data × Communication Design" as its strength. Awarded at ADFEST / Spikes Asia / D&AD / OneShow / JAA Consumer-Selected Advertising Contest / ACC Tokyo Creative Awards.