Note: This website was automatically translated, so some terms or nuances may not be completely accurate.
Analyzing the Reality of Hokuriku Tourism Through Location Data—Part 3 [NewsPicks × Dentsu Inc. News]
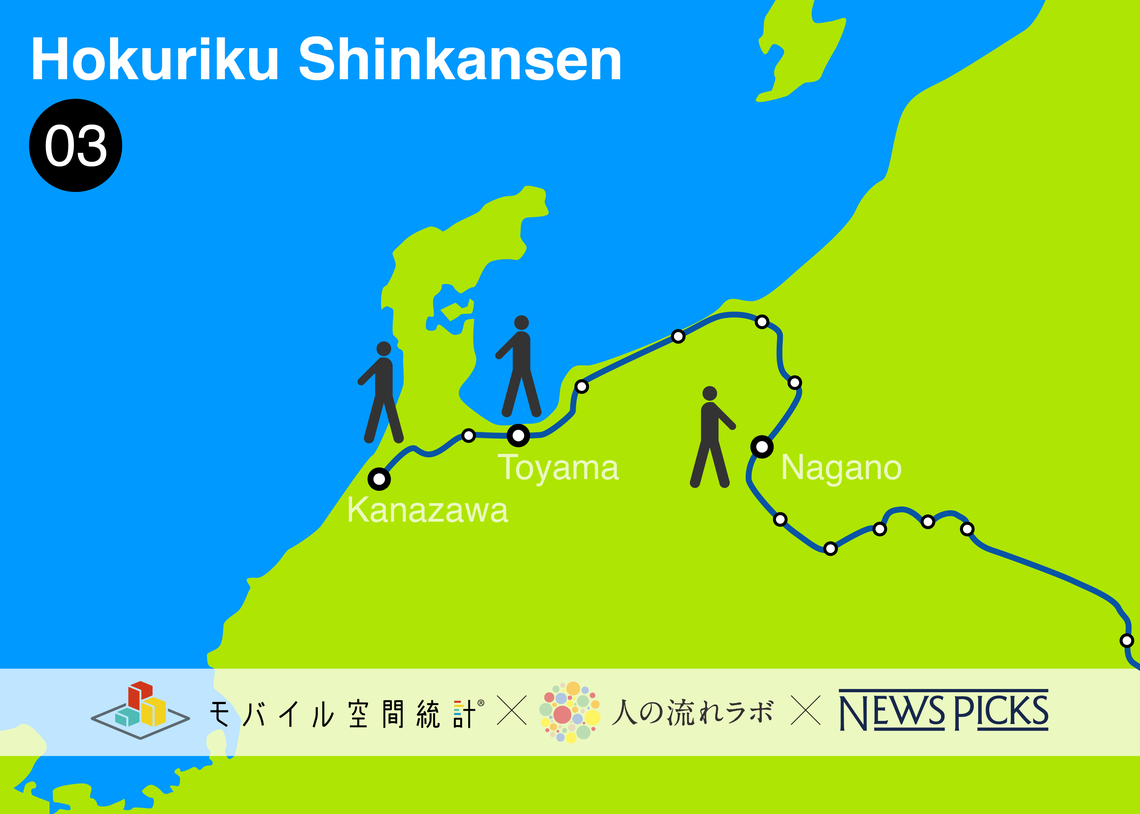
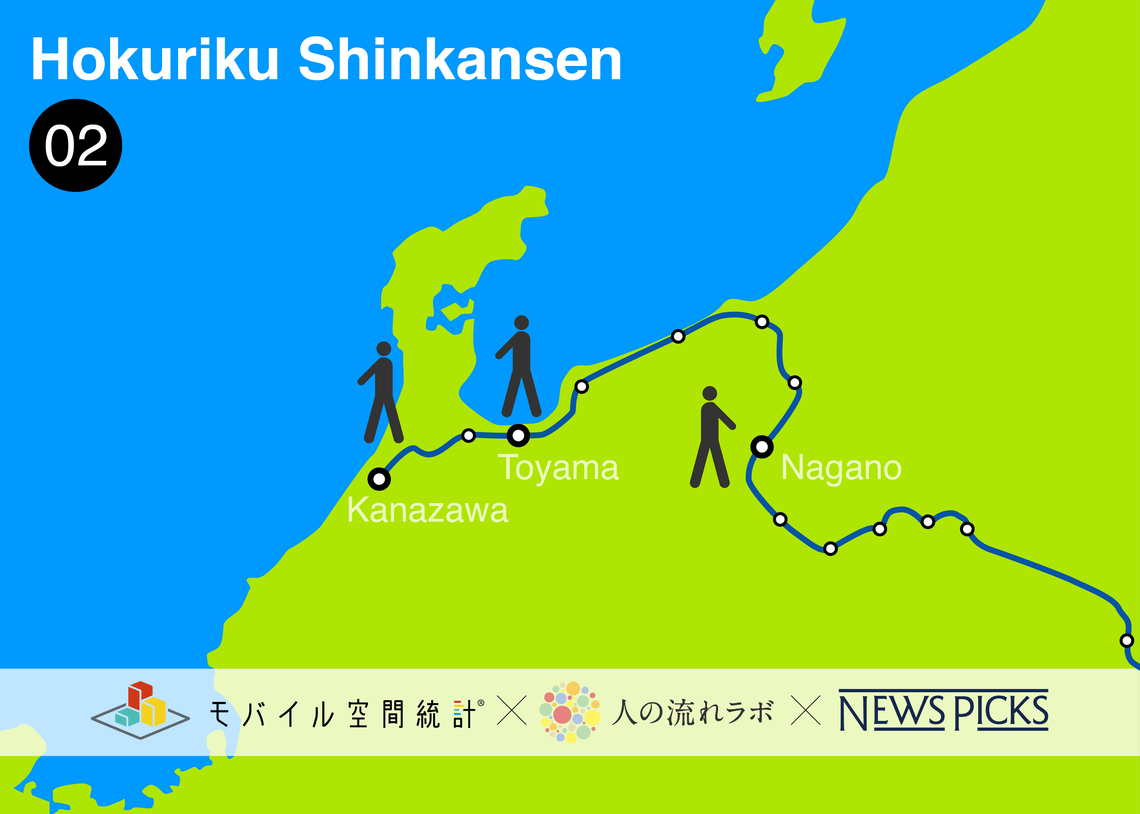
I'm Akimoto, a researcher at Dentsu Inc.'s "Human Flow Lab." This is the third installment in our series exploring how the opening of the Hokuriku Shinkansen has changed tourism flows in the Hokuriku region using location-based big data.
Please refer to the first and second articles here.
Examining the Reality of Hokuriku Tourism Through Location Data - Part 1
Examining the Reality of Hokuriku Tourism Through Location Data - Part 2
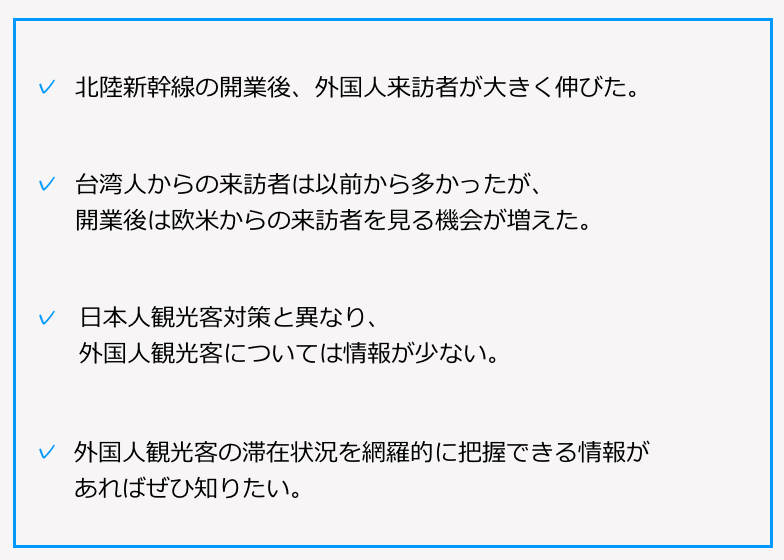
The first article analyzed Japanese visitors, while the second focused on Toyama Prefecture. Below is a summary.
This time, with the cooperation of DOCOMO Insight Marketing, we utilize Mobile Spatial Statistics* data to examine the characteristics of foreign visitors to Toyama Prefecture in detail.
*Mobile Spatial Statistics (Visitor Edition): Population statistics generated using NTT DOCOMO's mobile network infrastructure. It enables tracking of international visitors through hourly changes (time distribution surveys) and total numbers within specified periods (period surveys). Period surveys allow new types of analysis not possible with previous statistics, such as breakdowns by arrival/departure airports and aggregation of pre/post-visit locations.
The survey period compared the time before the Hokuriku Shinkansen opened (January to March 2015) with the period after its opening (April to June 2015). The time and area were defined as people staying in Toyama Prefecture for one hour or more between 9:00 AM and 6:00 PM, the typical tourist hours. Furthermore, this time, only those whose entire stay schedule from entry to departure was known were included in the count.
Significant Growth in Visitors from the Chubu and Tokyo Areas
Now, let's examine foreign visitors who stayed in Toyama Prefecture by their port of entry airport.
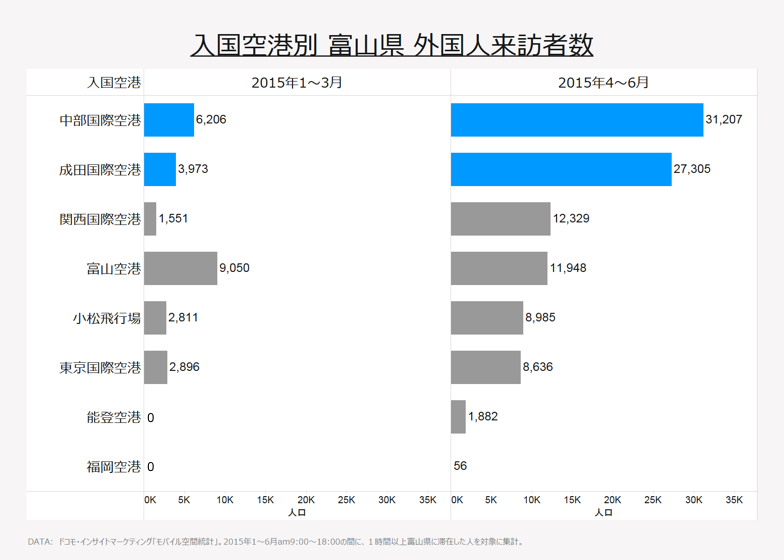
Chubu Centrair International Airport and Narita International Airport show overwhelmingly large increases. By region, the Tokyo Area (Narita International Airport and Tokyo International Airport <Haneda Airport>) and the Chubu Area (Chubu Centrair International Airport) are the two major entry areas.
Let's examine the residential areas of visitors from these two regions.
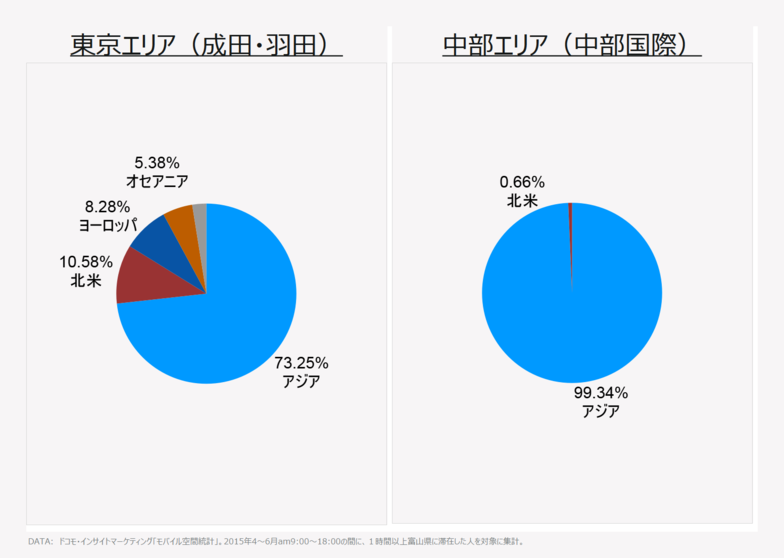
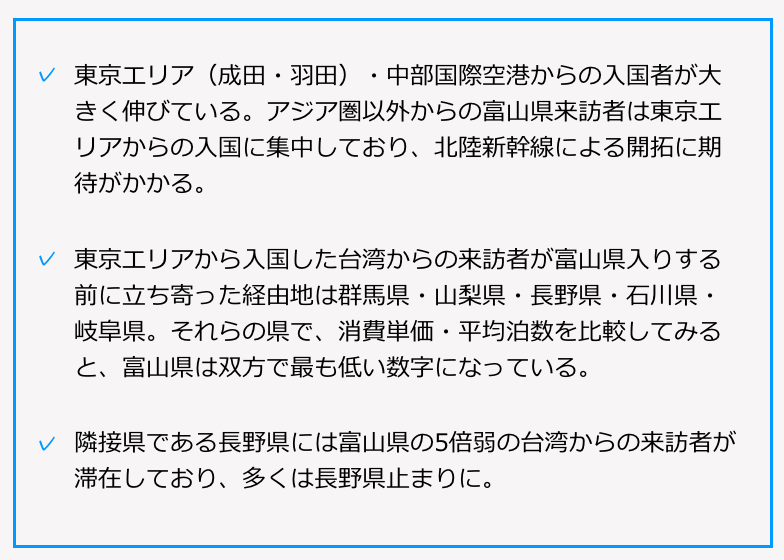
Approximately 30% of visitors from the Tokyo area reside outside the Asian region, whereas nearly 100% of visitors from the Chubu area come from within the Asian region. We examined the breakdown for Kansai International Airport and other airports similarly, and found that, like the Chubu area, over 90% of arrivals originated from within the Asian region. This means that the vast majority of visitors from outside the Asian region are flowing into Toyama Prefecture via the Tokyo area. The Hokuriku Shinkansen appears poised to significantly contribute to attracting visitors from outside the Asian region.
Let's examine transit points between the Tokyo area and Toyama
Next, focusing solely on visitors entering from the Tokyo area, let's examine the transit points they visited before entering Toyama Prefecture, broken down by municipality (only municipalities where visitors stayed for one hour or more are included in the count; stops under one hour are excluded).
Visitors from the United States sometimes take routes like "Tokyo Area → Aichi Prefecture, Osaka Prefecture, Kyoto Prefecture → Toyama Prefecture," showing a westward spread of transit points. In contrast, visitors from Asia tend to concentrate on a northbound route: "Tokyo Area → Yamanashi Prefecture, Gunma Prefecture, Nagano Prefecture, Ishikawa Prefecture, Gifu Prefecture Area → Toyama Prefecture." Visitors from Europe showed almost no stays in transit areas outside Tokyo and Chiba Prefectures (where airports are located). This indicates they either "entered directly into Toyama Prefecture" or "their stays were too brief at the city/town/village level to be counted due to anonymization processing."
Identifying Toyama Prefecture's Characteristics Through Spending Amounts and Average Length of Stay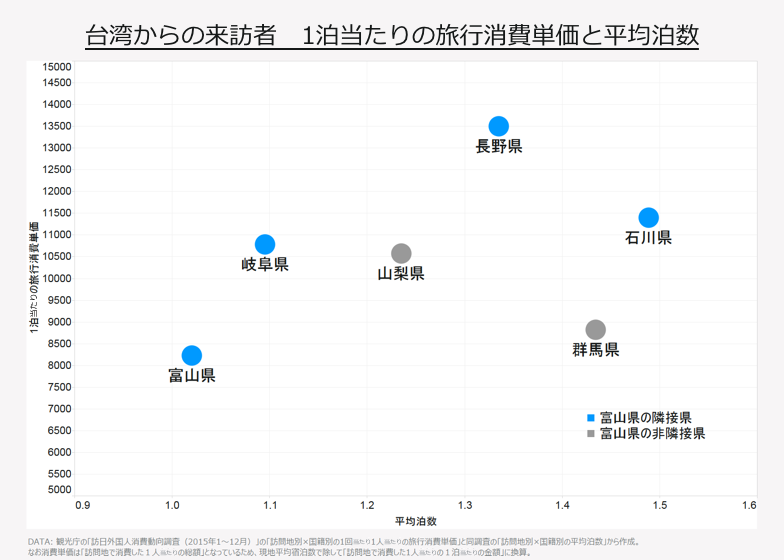
According to the Japan Tourism Agency's "Survey on Consumption Trends of Inbound Tourists" (2015), the average travel expenditure per Taiwanese visitor entering via the Tokyo area (Narita/Haneda) is approximately ¥128,000, with an average stay of about 6.8 nights. These figures are distributed among the prefectures visited.
Deepening the previous analysis, we identified that visitors from Taiwan enter Toyama Prefecture via Yamanashi, Gunma, Nagano, Ishikawa, and Gifu Prefectures. Therefore, we compared the figures for each of these prefectures with Toyama Prefecture's figures. This scatter plot was created using data from the Japan Tourism Agency's "Survey on Consumption Trends of Foreign Visitors to Japan (2015)" specifically the "Per-Person Per-Trip Travel Expenditure by Destination and Nationality" and the "Average Length of Stay by Destination and Nationality" from the same survey. Since the consumption amount represents the "total amount spent per person at the destination," we divided it by the local average number of nights to convert it to the "amount spent per person per night at the destination."
Looking at the figures, the per-night consumption amount in Toyama Prefecture is about 60% of that in Nagano Prefecture, and similarly, the average number of nights stayed is also lower compared to other prefectures.
How Visitors from Taiwan Spend Their Money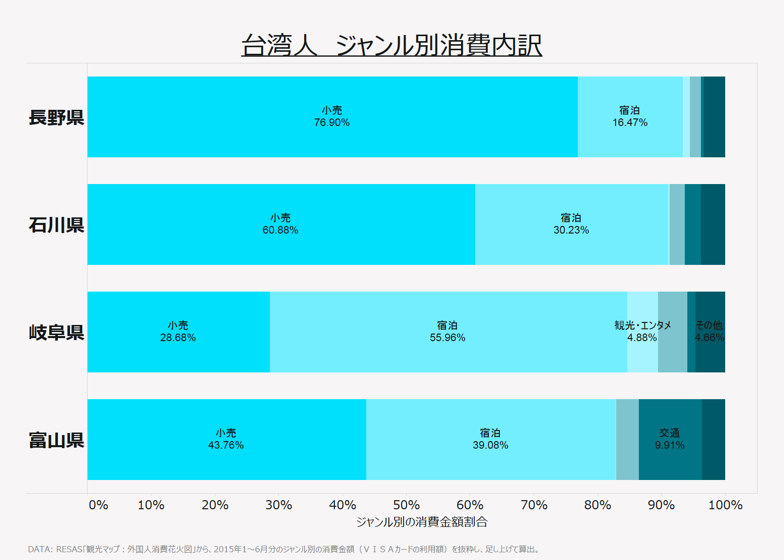
The data is extracted from RESAS's "Tourism Map: Foreign Spending Fireworks Diagram," showing the percentage of spending by category (VISA card usage) for January to June 2015. Since this data did not indicate sample sizes or estimation methods, we will focus on the percentages by prefecture and category to identify trends, rather than the actual monetary amounts.
The figures show that Nagano and Ishikawa Prefectures, which had high average spending per person, had a very high proportion of spending in the "Retail" category. Gifu Prefecture, on the other hand, had a high proportion in "Accommodation." Toyama Prefecture falls in between, with a notably higher proportion in "Transportation."
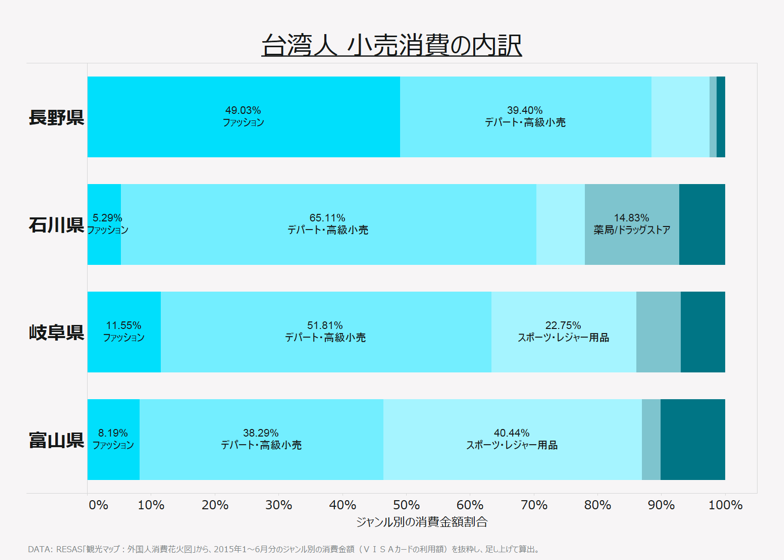
Let's examine the breakdown of "retail." In Nagano Prefecture, fashion and department stores/luxury retail account for about 90%. This is likely influenced by the large commercial facilities in Karuizawa and Nagano Station. Ishikawa Prefecture also has many department stores and luxury retailers, but it is also characterized by a higher proportion of pharmacies and drugstores compared to other prefectures.
Toyama Prefecture shows a high proportion of sports and leisure goods. This is likely linked to consumption related to famous hiking destinations like Tateyama and Kurobe. While Nagano and Ishikawa Prefectures excel as "places that make you want to shop," Toyama Prefecture aims to further expand its recognition as a "hiking and trekking destination." This would increase consumption of related gear and activity services, ultimately leading to more overnight stays.
Increasing visitors to Toyama Prefecture hinges on attracting visitors from Nagano Prefecture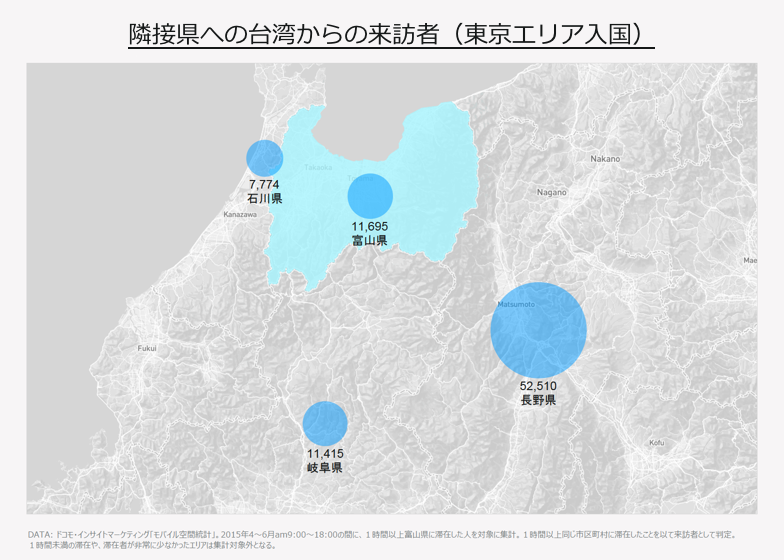
Finally, here is a summary of this report.
Next time, we plan to proceed with analysis of visitors from the United States.
NewsPicks NewsPicks offers original articles created by Japan's top infographic editors, providing business-related information in an easy-to-understand format.
Mobile Spatial Statistics are population statistics created using NTT DOCOMO's mobile phone network infrastructure. "Mobile Spatial Statistics" is a registered trademark of NTT DOCOMO.
Contact: Dentsu Inc. Human Flow Lab
contact@hitononagarelab.jp
Was this article helpful?
Share this article
Newsletter registration is here
We select and publish important news every day
For inquiries about this article
Back Numbers

Author

Ken Akimoto
Dentsu Inc.
Data Technology Center Geodata Solutions Department
After working at a major automaker's marketing subsidiary, joined the company in 2001. Expanding domains: Sales → New Business Development → Creative → Data Business. In 2018, launched a department solving client marketing challenges using location data, providing data-driven marketing services with "Data × Communication Design" as its strength. Awarded at ADFEST / Spikes Asia / D&AD / OneShow / JAA Consumer-Selected Advertising Contest / ACC Tokyo Creative Awards.