Note: This website was automatically translated, so some terms or nuances may not be completely accurate.
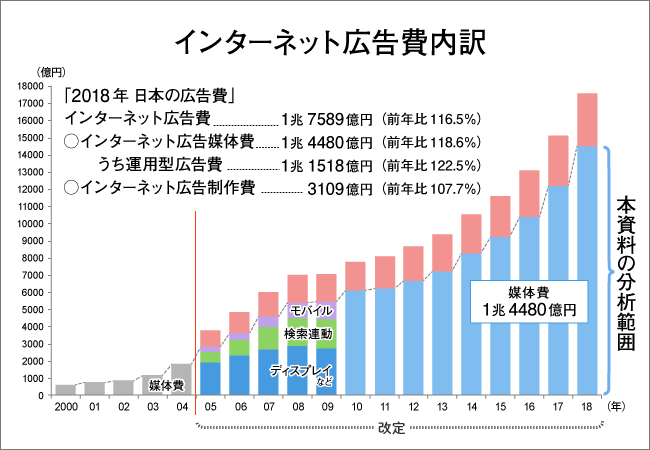
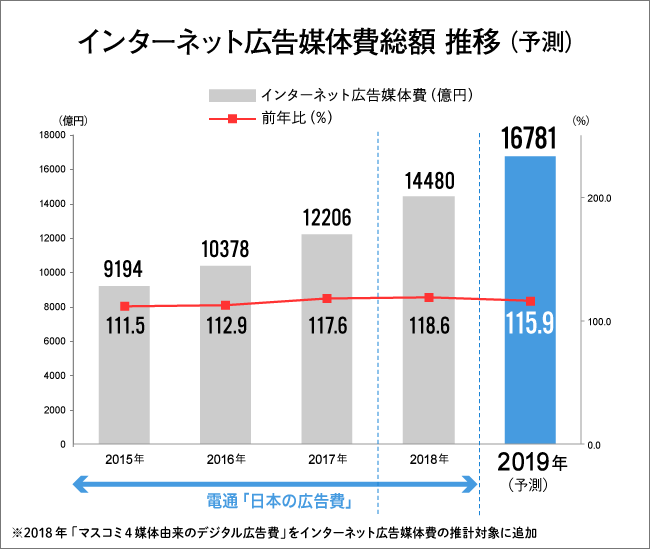
Internet advertising media spending reached ¥1.448 trillion in 2018. Focus on the growth of mobile and video advertising.
D2C Inc., Cyber Communications Inc. (hereinafter CCI), and Dentsu Group's three companies have released the "Detailed Analysis of Internet Advertising Media Expenditures in Japan's Advertising Spending for 2018." This analysis breaks down the "Internet Advertising Media Expenditures" section from Dentsu Inc.'s " 2018 Japan Advertising Expenditures " survey, announced in February 2019, by advertising type, transaction method, device, and other perspectives, and adds forecasts for 2019. Rika Kajiwara of CCI provides commentary.

<Table of Contents>
▼Internet Advertising Expenditures Reach 26.9% of Japan's Total Advertising Expenditures
▼Internet Advertising Media Costs by Advertising Type, Transaction Method, and Device
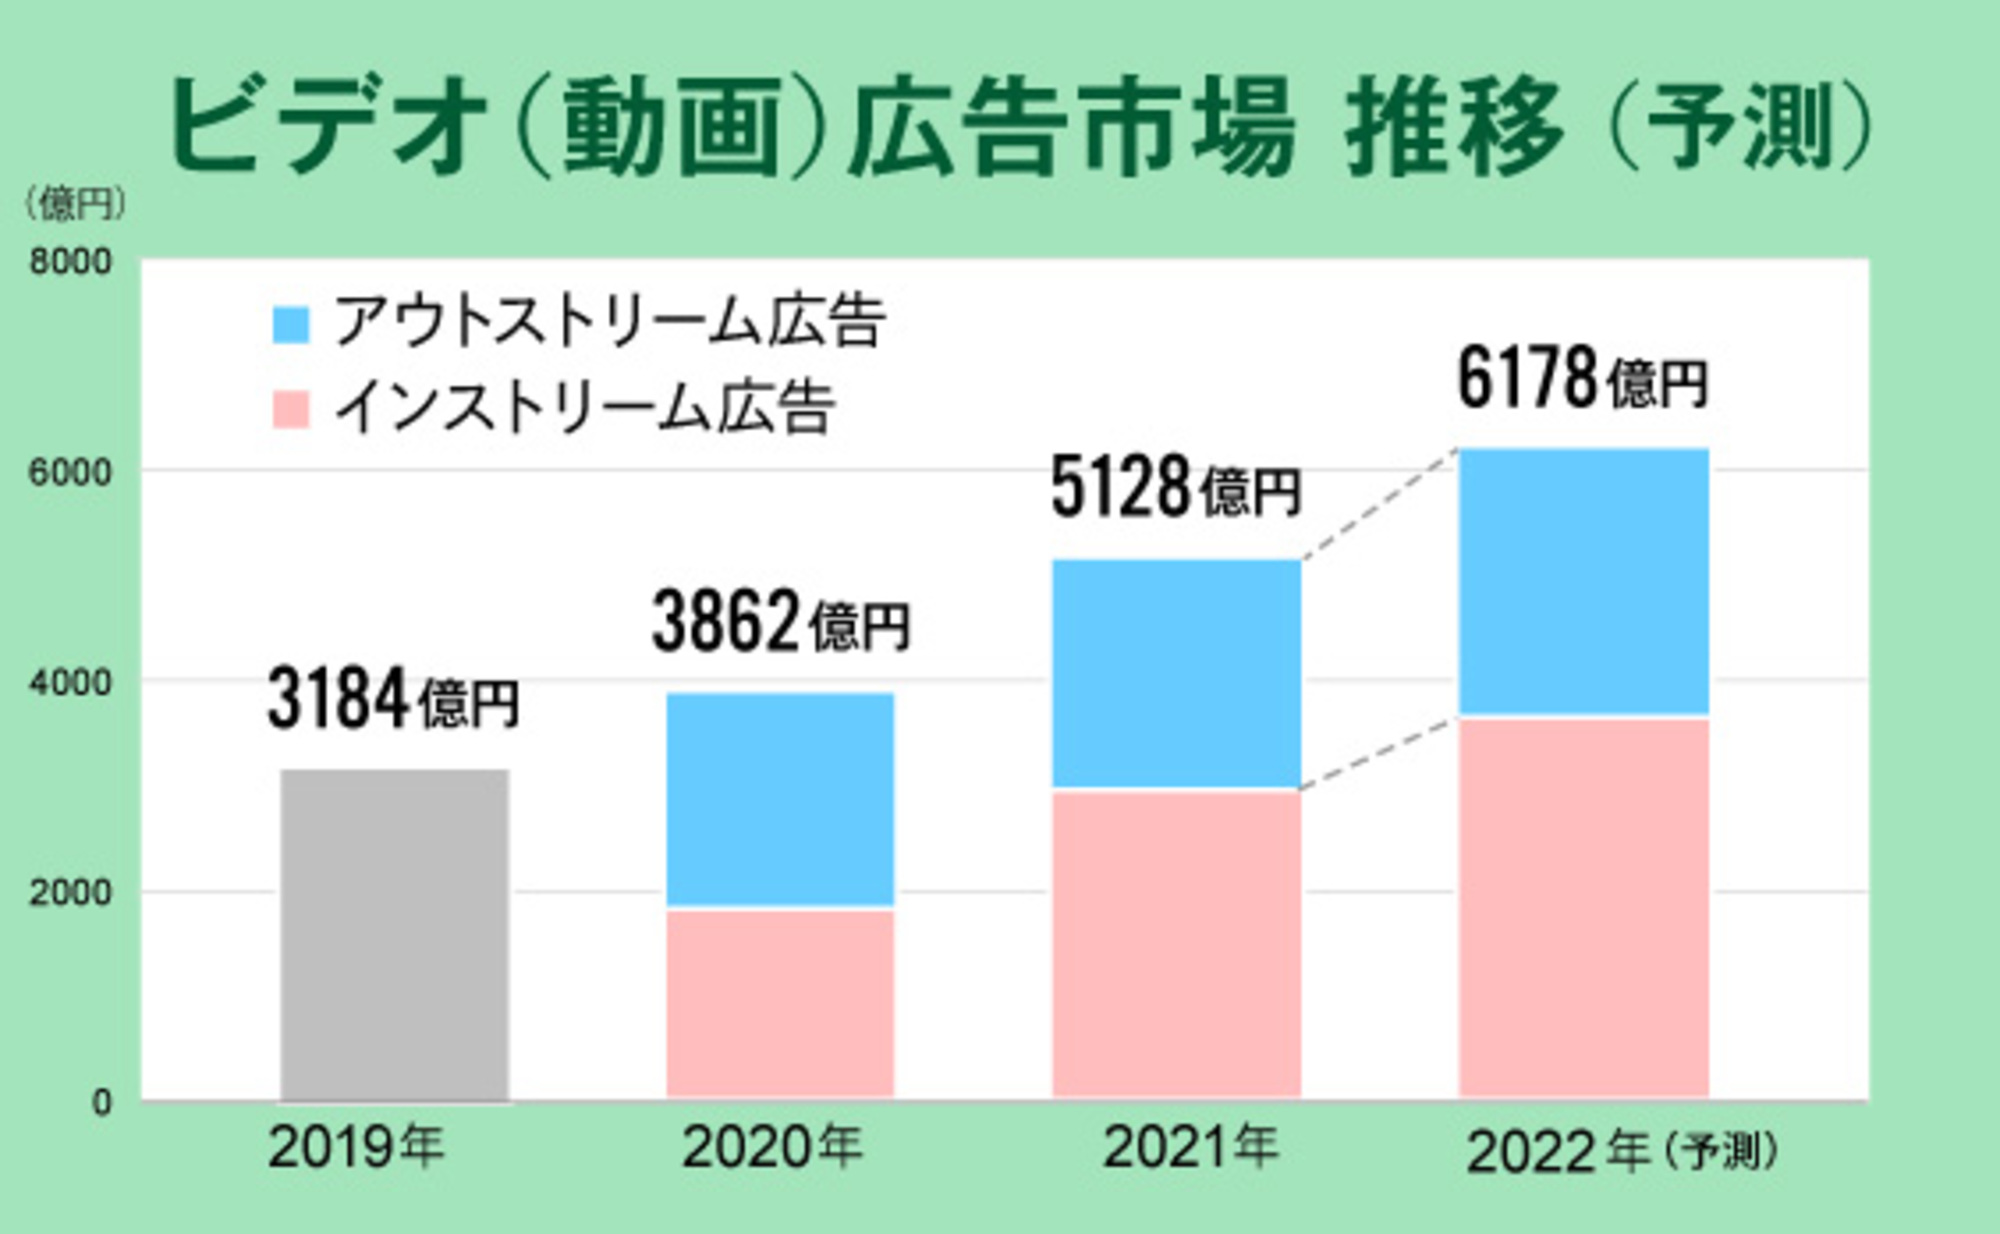
▼Significant Growth in "Video Advertising"
▼What will happen to internet advertising media spending in 2019?
▼Summary: For the Healthy Development of the Internet Advertising Market
Internet advertising expenditure reaches 26.9% of Japan's total advertising expenditure
Japan's total advertising expenditure in 2018 was ¥6.53 trillion. Internet advertising expenditure within this reached ¥1.7589 trillion, growing to account for 26.9% of the total.
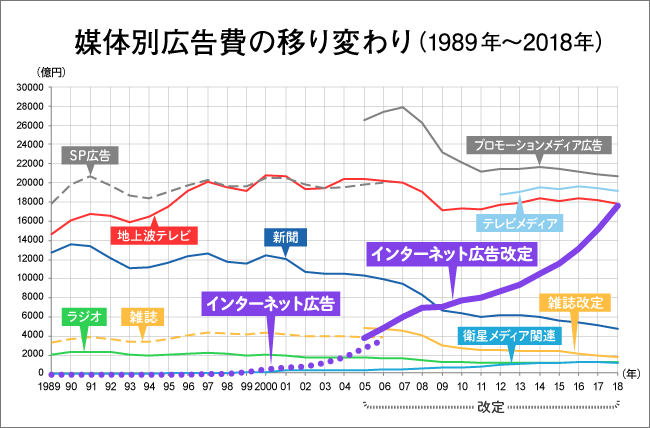
(Note 2) Starting with the 2014 announcement, television media advertising expenditure was defined as "Terrestrial TV + Satellite Media-related" and aggregated retroactively to 2012.
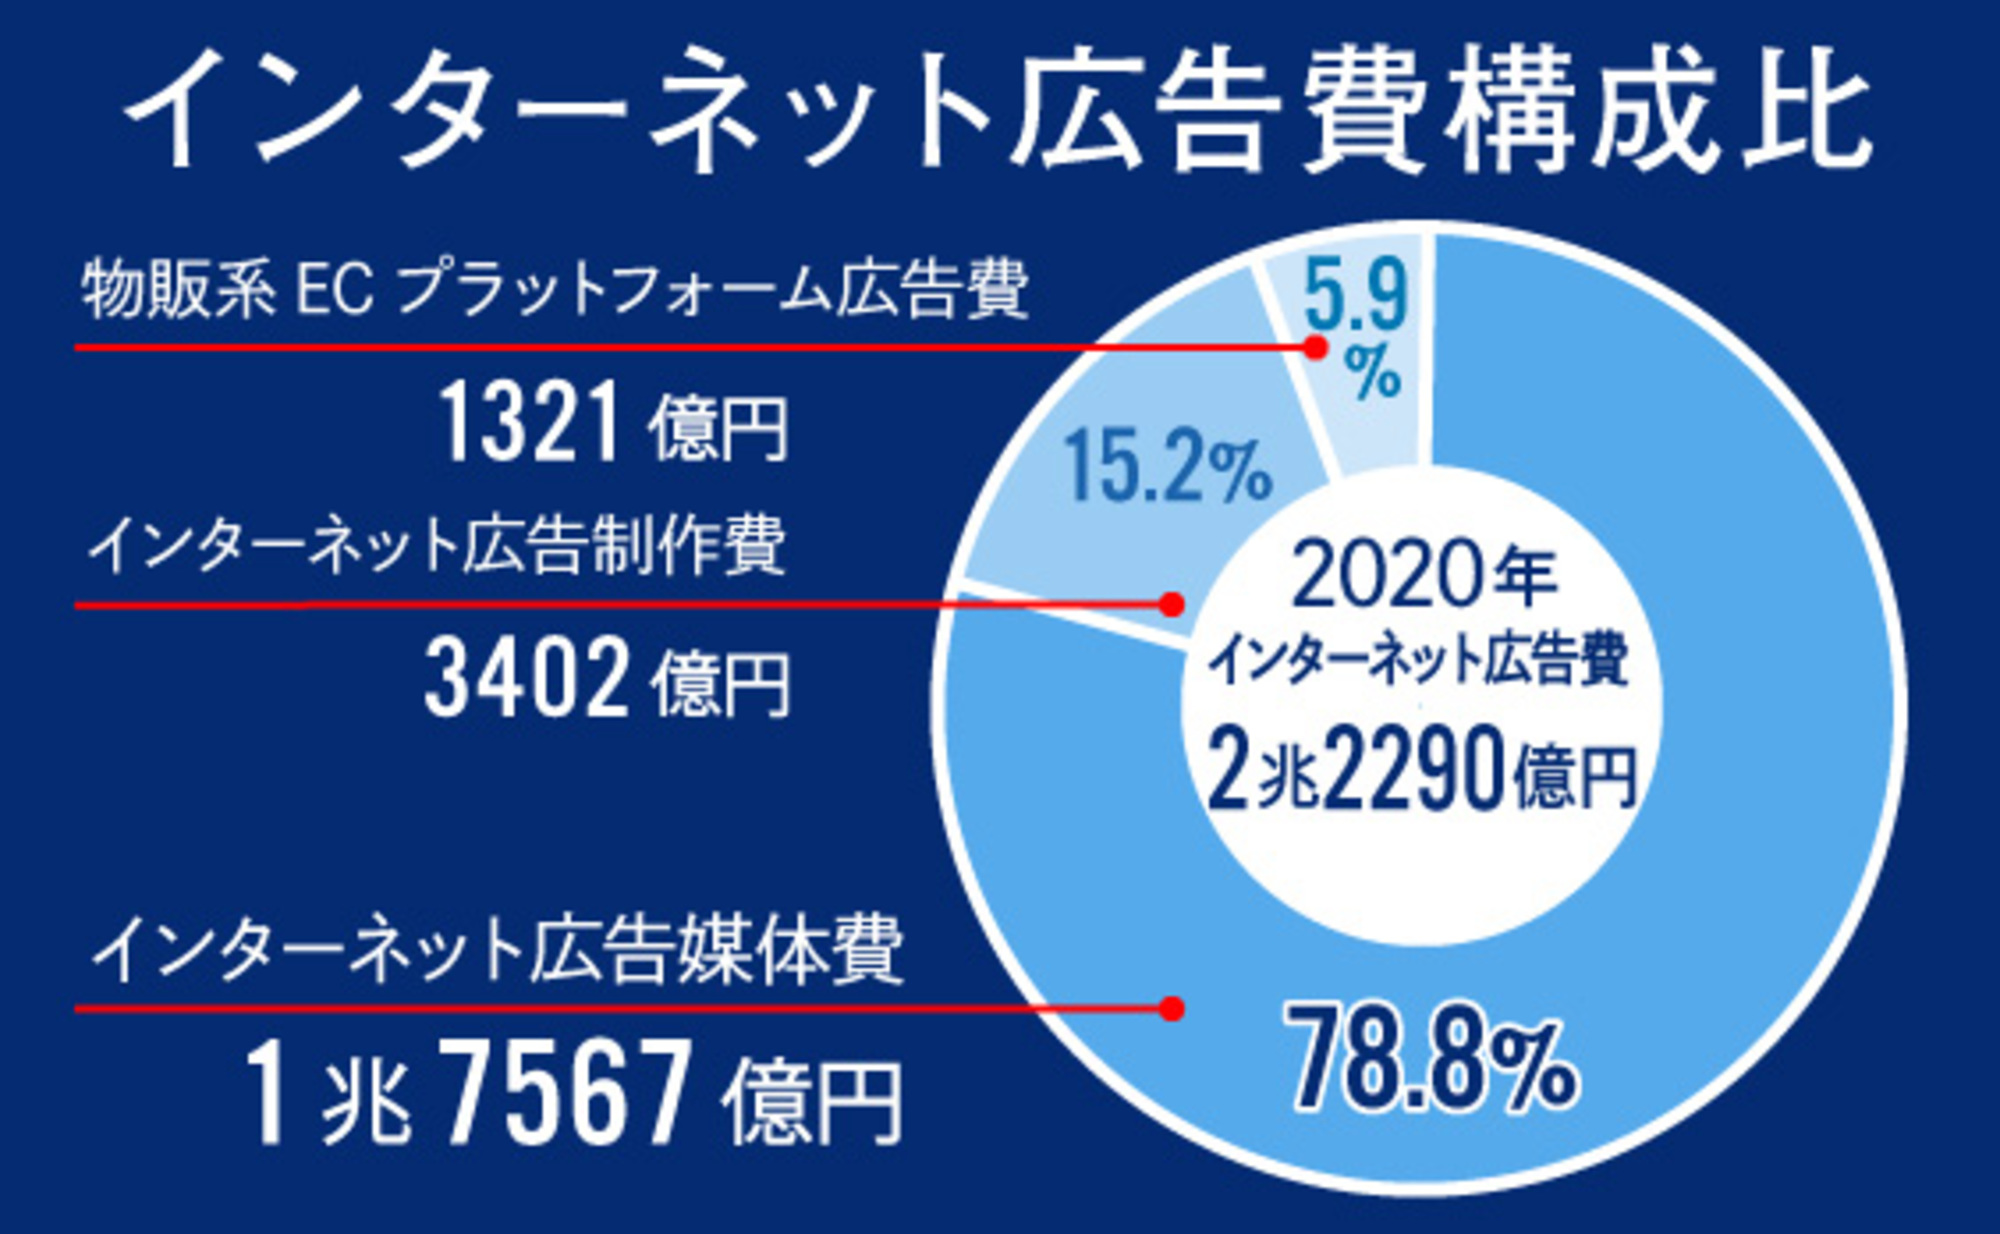
Internet advertising expenditure can be broadly divided into two categories. The first is "Internet Advertising Media Fees" at ¥1.448 trillion, and the second is "Internet Advertising Production Fees" at ¥310.9 billion. This time, we conducted a detailed analysis of the former, Internet Advertising Media Fees.
In addition to the 2018 analysis, we also forecast the size of the internet advertising market for 2019.
Internet Advertising Media Costs by Ad Type, Transaction Method, and Device
This detailed analysis examined the breakdown of the ¥1.448 trillion in internet advertising media costs by advertising type, transaction method, and device.
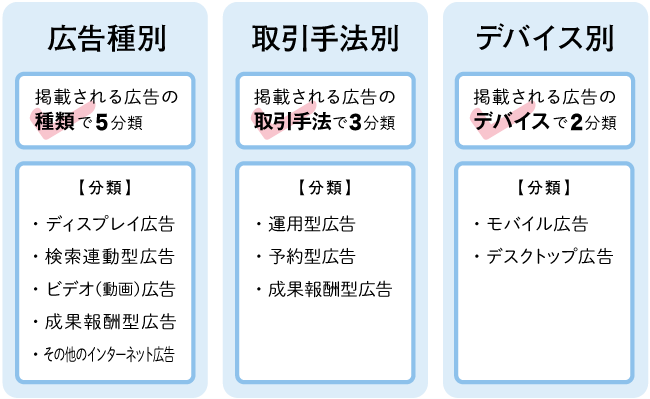
●Ad Type—Search-linked ads and display ads account for about 80% of the total
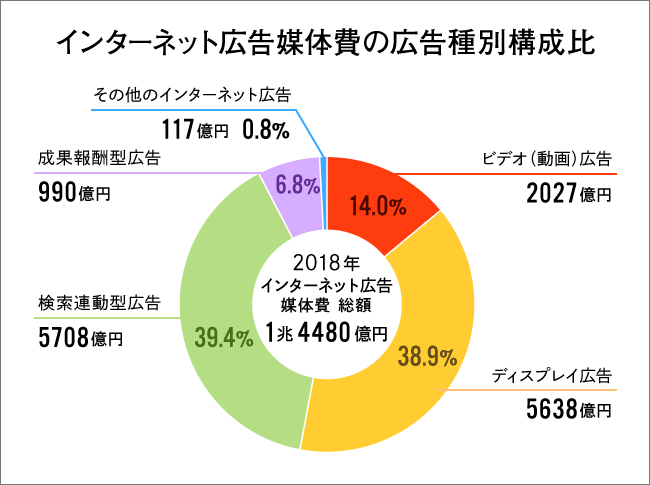
By advertising type, within the total internet advertising media expenditure of ¥1.448 trillion, "search-linked advertising" accounted for 39.4% (¥570.8 billion) and "display advertising" accounted for 38.9% (¥563.8 billion), together making up about 80% of the total.
Of particular note is "Video Advertising," which grew from ¥115.5 billion (9.5% of the total) in 2017 to ¥202.7 billion (14.0% of the total) in 2018.
*Note: 2017 figures are reference values, as "Digital Advertising Expenditures from Four Mass Media Sources" were added to the estimation scope for Internet advertising media costs in 2018.
● By Transaction Method: Performance-Based Advertising Accounts for About 80% of the Total
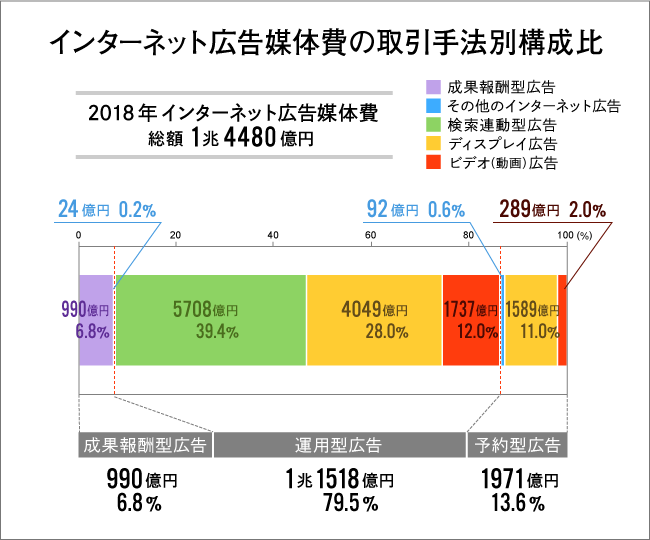
By transaction method, "performance-based advertising" accounted for 79.5% or ¥1.1518 trillion, representing approximately 80% of the total and clearly the mainstream of internet advertising transactions.
Furthermore, looking at the breakdown of advertising expenditure by transaction method and ad type (see figure above), "search-linked performance-based advertising" holds a very large share at 39.4% of the total, amounting to ¥570.8 billion, followed by "display performance-based advertising" at 28.0%, or ¥404.9 billion. Video advertising also shows a very high "programmatic" ratio, at 12.0% or ¥173.7 billion.
● By Device: Mobile Advertising Expenditures Surpass ¥1 Trillion for the First Time
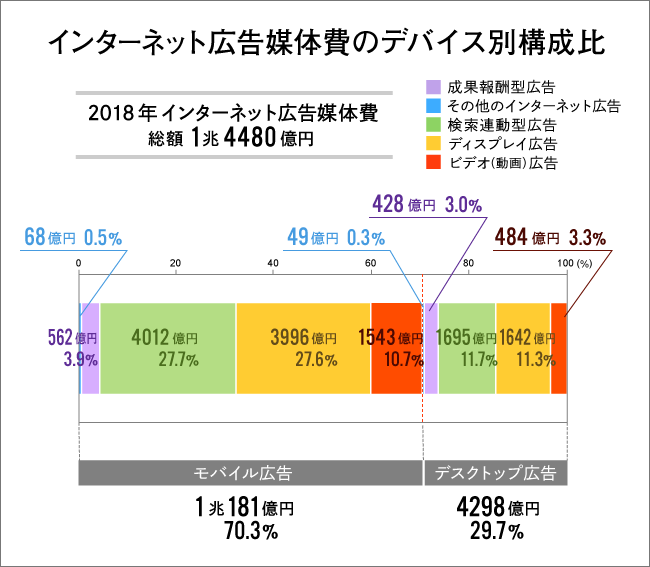
By device, "mobile advertising" accounted for 70.3% of the total at ¥1.0181 trillion, while "desktop advertising" accounted for 29.7% at ¥429.8 billion.
Looking at the cross-section of device and ad type, "mobile search-linked ads" accounted for 27.7% (¥401.2 billion), while "mobile display ads" accounted for 27.6% (¥399.6 billion). This shows that mobile advertising holds a high share within the dominant search-linked and display ad formats.
Video advertising also shows a significantly higher proportion of mobile ads compared to desktop.
Remarkable Growth in Video Advertising
Let's delve a bit deeper into the growth of video advertising.
As mentioned earlier, video advertising accounted for 9.5% of total internet advertising media spending in 2017, amounting to ¥115.5 billion (*). However, by 2018, this had grown to 14.0% of the total, reaching ¥202.7 billion, showing significant expansion in video advertising spending over just one year.
*Note: 2017 figures are for reference only, as "digital advertising spending originating from the four major media outlets" was added to the estimation scope for internet advertising media spending in 2018.
The background includes the growth of video media like TVer and AbemaTV, the continued user engagement with video-based social networks such as Instagram Stories and YouTube, and the rising popularity of video-sharing apps like TikTok, particularly among younger generations. This reflects the broader internet usage trend of "shifting from still images to video" that has become pronounced in recent years.
Another factor is that as web media impressions themselves are not increasing as they once did, publishers are shifting towards video advertising, which commands a higher cost per impression, aiming to expand their revenue.
From the user perspective, everyone now carries a smartphone with them at all times, enabling video viewing anytime, anywhere. Moreover, the environment for users to shoot and share videos on social media is well-established, significantly increasing opportunities to engage with and enjoy video content in various forms throughout daily life.
Meanwhile, advertisers see this environment as enabling rich creative expression through video. Expectations are rising that video advertising contributes to branding.
What will happen to internet advertising media spending in 2019?
Internet advertising media spending, which totaled 1.448 trillion yen in 2018, is estimated to grow to 1.6781 trillion yen in 2019, a 115.9% increase year-on-year.
Below, we introduce changes by device and forecasts for the spotlighted video advertising.
● Trends by Device: Mobile Advertising Spending Continues to Lead
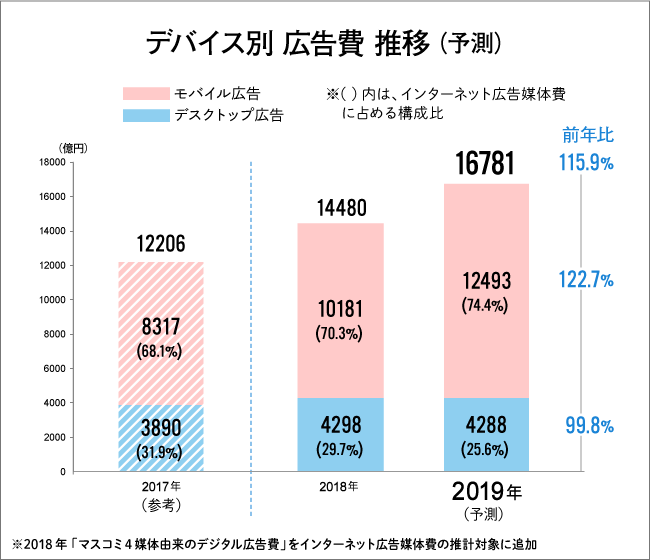
Mobile advertising spending exceeded 1 trillion yen in 2018. In 2019, it is projected to expand to 1.2493 trillion yen, a very high growth rate of 122.7% year-on-year.
Meanwhile, desktop advertising, which was ¥429.8 billion in 2018, is projected to remain largely flat in 2019 at ¥428.8 billion (99.8% year-on-year), maintaining a stable market size.
●Video Advertising Market Trends—Mobile Video Ad Spending to Exceed ¥200 Billion
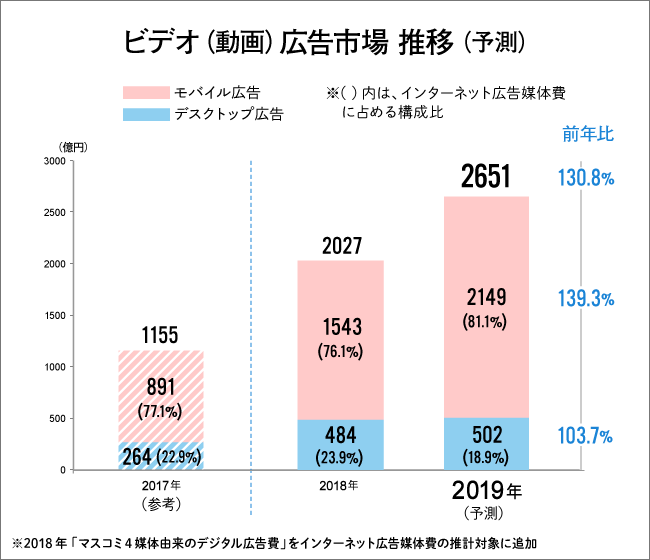
Among ad types, video advertising expenditure, which was ¥202.7 billion in 2018, is projected to achieve very high growth in 2019, reaching ¥265.1 billion, a 130.8% increase year-on-year.
Breaking down video advertising by device, mobile advertising already accounted for a very large share in 2018. In 2019, this share is projected to expand further, with mobile video advertising exceeding ¥200 billion, a 139.3% increase year-on-year. Desktop advertising is also projected to show steady growth, rising from ¥48.4 billion in 2018 to ¥50.2 billion in 2019, a 103.7% increase year-on-year.
Summary: For the healthy development of the internet advertising market
Media streaming devices that plug into TVs and connect to the internet are gaining attention. It's also conceivable that more people will listen to radio via smartphones. As devices become increasingly diverse, the boundary between "traditional mass media" and "the internet" will likely blur further.
Amidst this significant shift in the media landscape, the purpose of the "Detailed Analysis of Internet Advertising Media Costs," a collaborative effort by three Dentsu Group companies, is to capture the vast internet advertising market from various angles, paint a comprehensive picture, and aim for the healthier development of the advertising market.
For instance, with performance-based advertising now accounting for approximately 80% of the total and video advertising poised for further growth, initiatives focused on "brand safety" – ensuring ads are delivered without risk of brand damage – are becoming increasingly crucial. In this way, shifts in advertising expenditure ratios suggest various broader changes.
We hope that estimating and analyzing the detailed breakdown of advertising expenditures will help identify major trends and contribute to achieving better advertising communication between advertisers and consumers.
Was this article helpful?
Share this article
Newsletter registration is here
We select and publish important news every day
For inquiries about this article
Author

Rika Kajiwara
CARTA HOLDINGS, INC
Management Office
Group Communication Office Director
Responsible for public relations and market research. Primary research includes: "Japan's Advertising Expenditures" detailed analysis of internet advertising media costs, digital signage advertising market research, and video streaming service usage surveys.