Note: This website was automatically translated, so some terms or nuances may not be completely accurate.
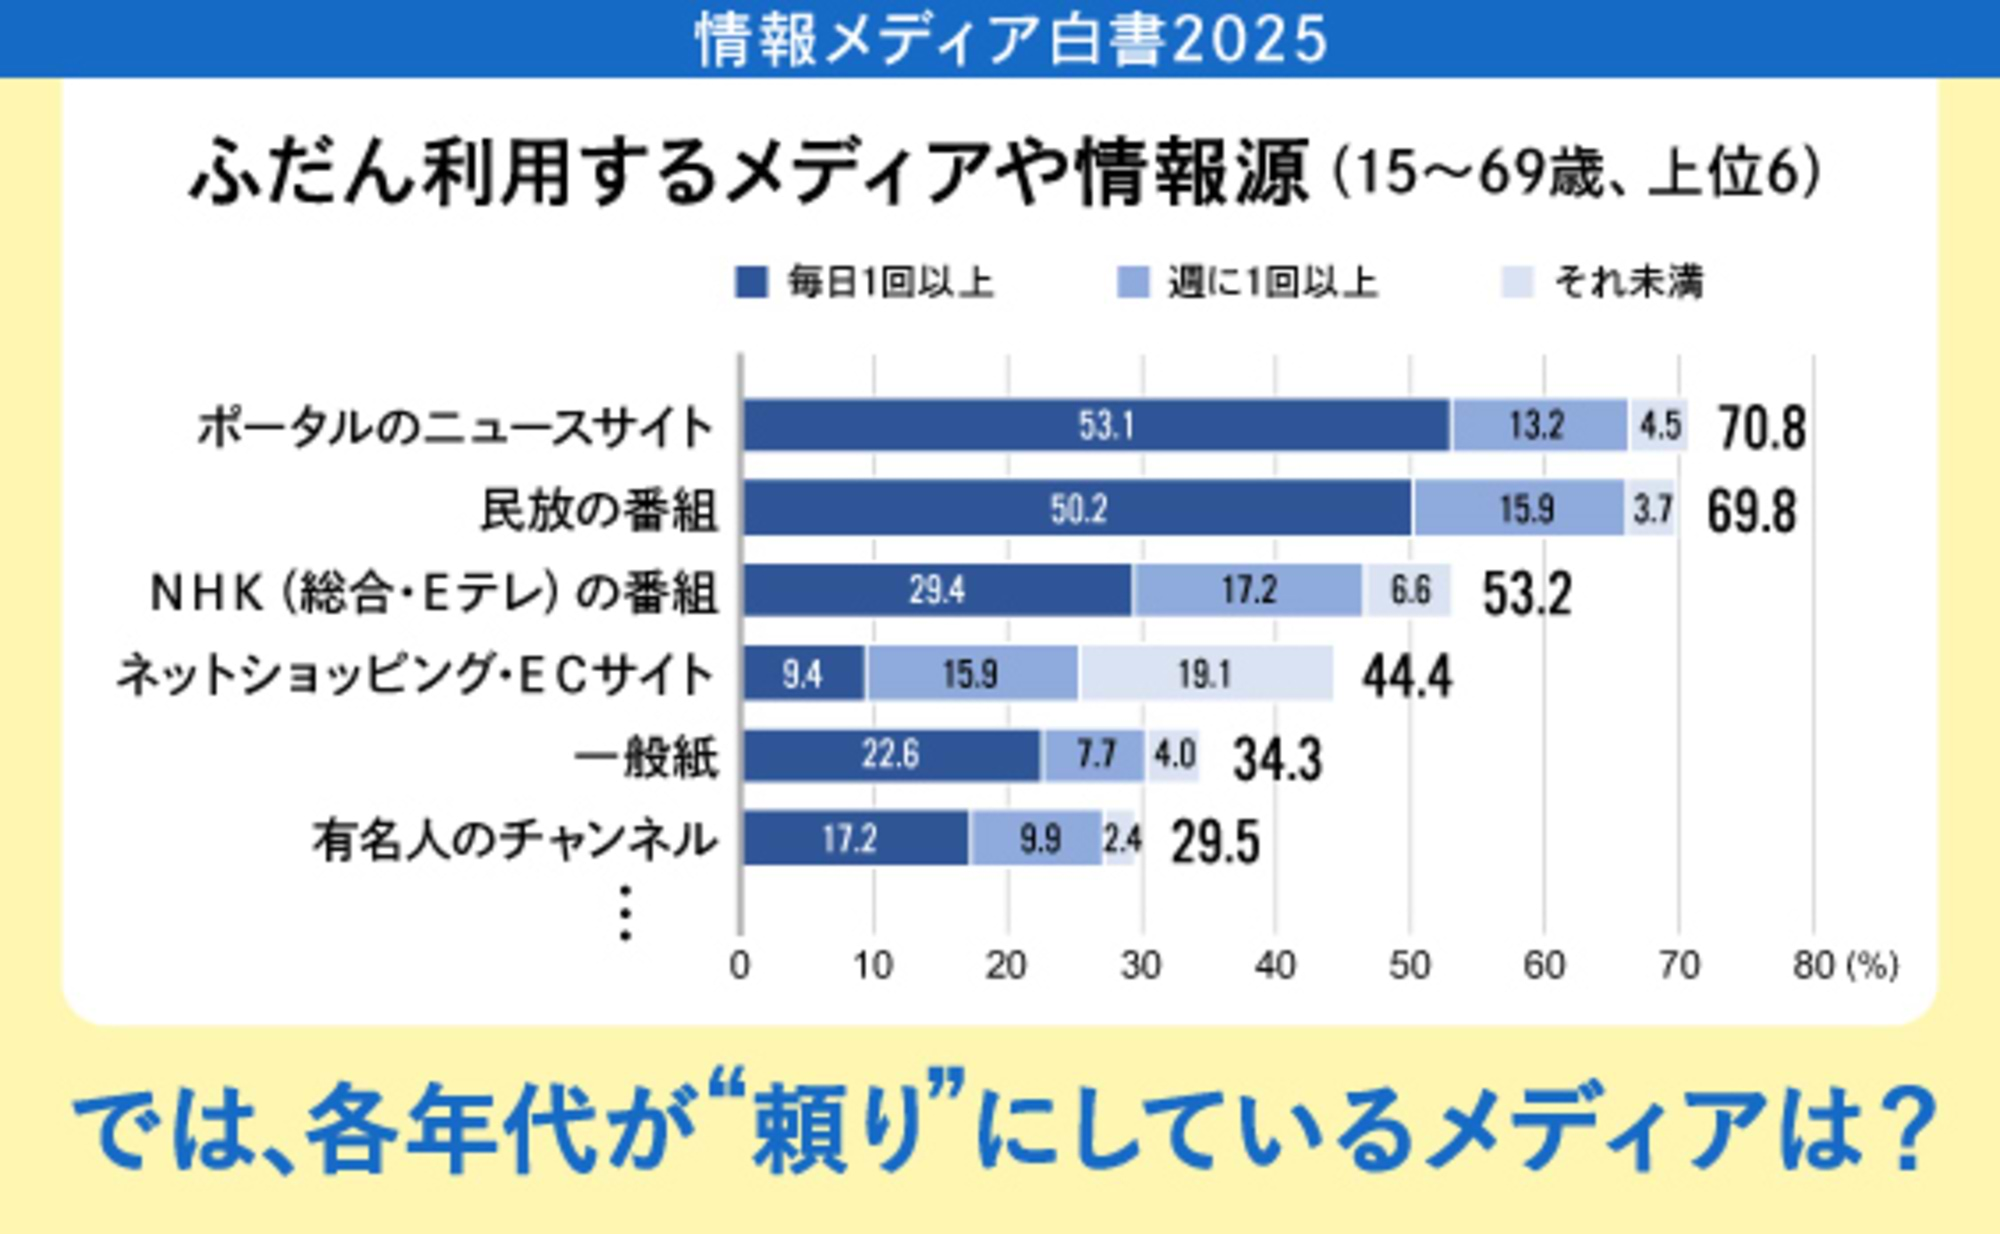
In an era where 80% of women work, analyze women's media behavior by life stage!
March 8th is International Women's Day.
This article introduces media behavior analysis focused on women's life stages, driven by the desire for messages from advertising and media to reach diverse segments of women appropriately and be perceived as positive.
▼Increasing Working Women and the Resolution of the M-Shaped Curve
▼Significant Differences Even Among Peers! Capturing the Diversification of Women's Life Stages
▼Life Stage-Specific Media Exposure Bubble Charts
▼Life Stage-Specific Differences in Information Awareness and Ad Perception
Working Women Increase, Moving Toward Resolving the M-Shaped Curve
According to the Ministry of Internal Affairs and Communications' Basic Survey on Employment Structure (conducted every five years), released in 2023, the female employment rate for those aged 25-39 exceeded 80% for the first time in 2022. This indicates that the traditional dip in the female employment rate observed in the 30s, known as the M-shaped curve, is gradually flattening. Women's life stages are diversifying.
This situation will significantly impact women's consumption and media behaviors. It's not just women. As dual-income households increase yearly, men's participation in household chores is rising, particularly in urban areas. Men's involvement in purchasing decisions as household managers—for example, buying food, daily necessities, and household appliances—is expected to grow. Marketing and media planning must also capture these changes.
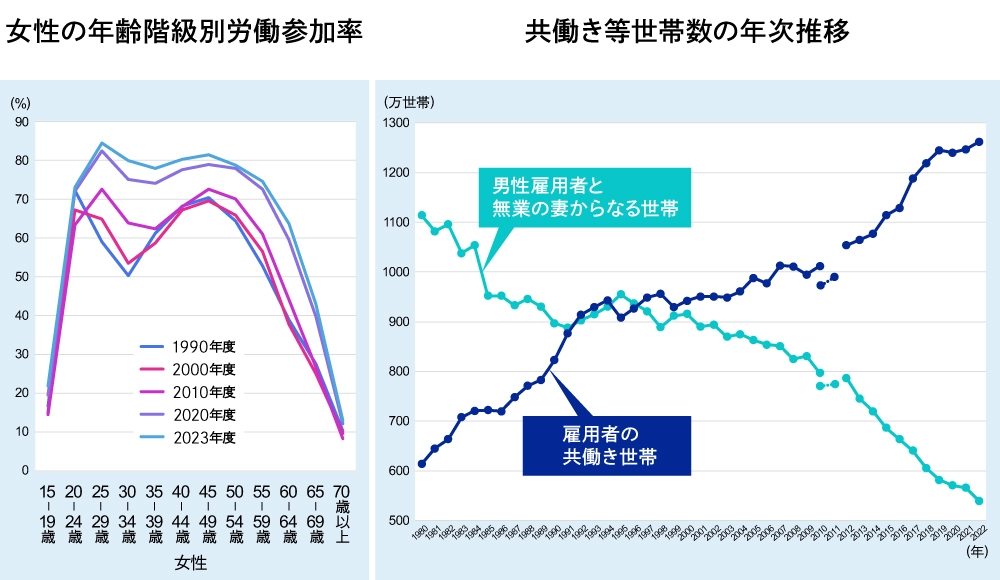 Left Figure: "Labor Force Survey" (Ministry of Internal Affairs and Communications) ( https://www.e-stat.go.jp/stat-search/files?page=1&layout=datalist&toukei=00200531&tstat=000000110001&cycle=0&tclass1=000001040276&tclass2=000001011681&tclass3val=0 )
Figure right: Created by modifying the "2023 White Paper on Health, Labour and Welfare" (Ministry of Health, Labour and Welfare) ( https://www.mhlw.go.jp/stf/wp/hakusyo/kousei/22/backdata/02-01-01-03.html )
Significant Differences Even Among Peers! Understanding the Diversification of Women's Life Stages
Let's examine the diversification of women's life stages using Dentsu Inc.'s large-scale survey data (Dentsu d-camp X / Details here ). We focused on factors like employment status, marital status, and children, extracting 11 segments where we could consistently maintain a fixed sample size.
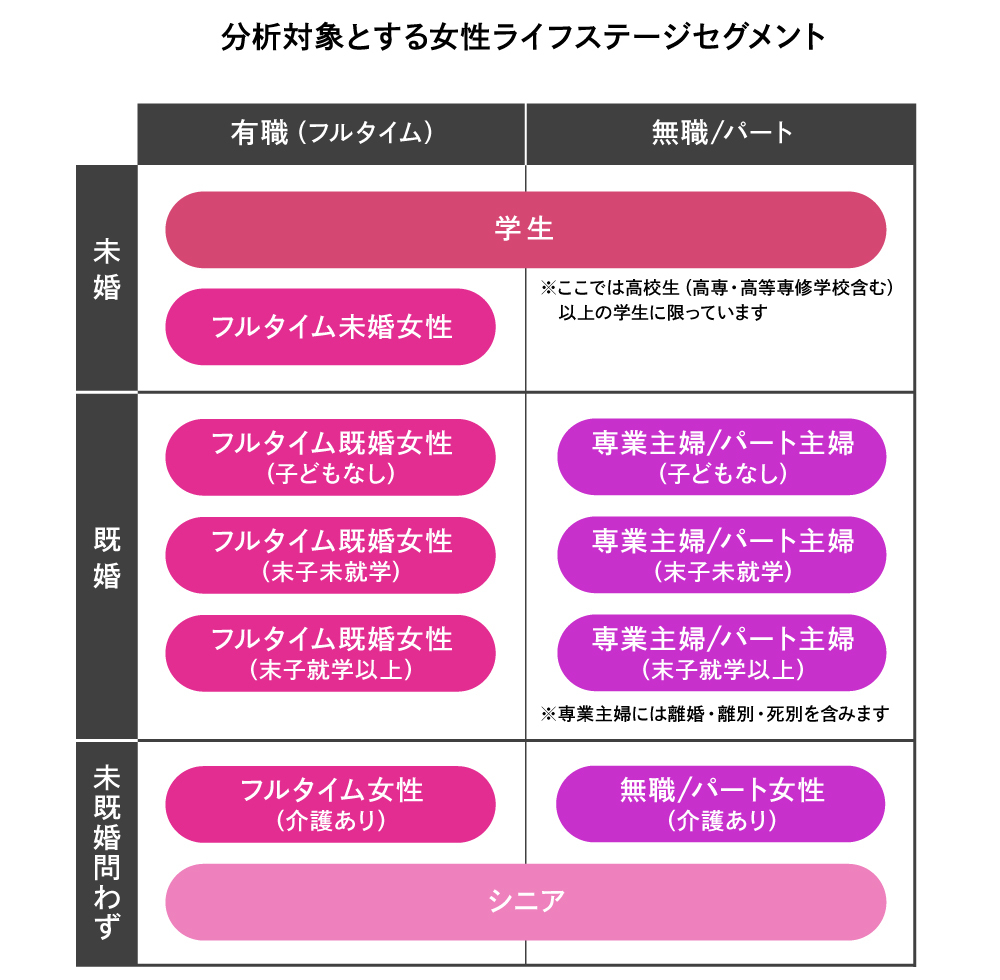 *Segments were extracted from Dentsu Inc. d-campX data and do not represent all women. In reality, diverse segments exist, such as married students, unemployed unmarried women, and unmarried women with children. Some segments may overlap.
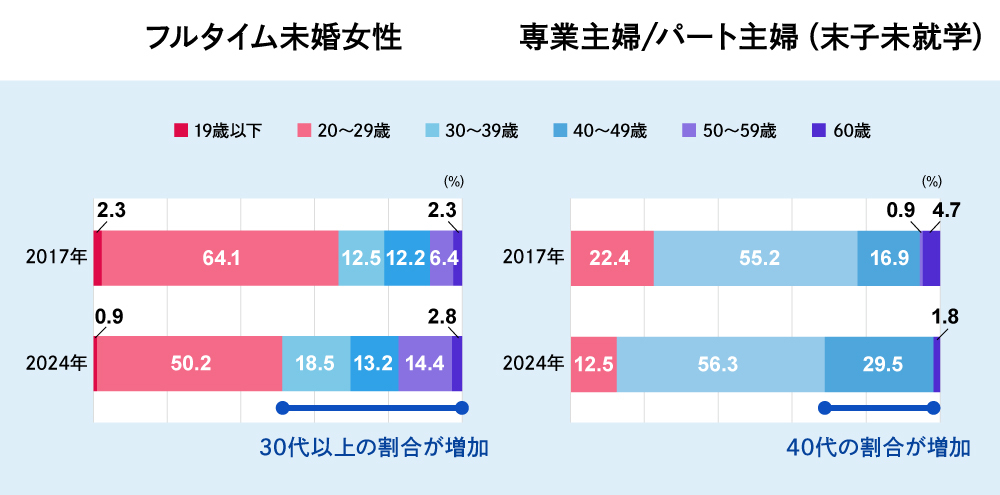
Looking at the trend from 2017 to 2024, when continuous data collection was possible, we see that the full-time homemaker/part-time homemaker segment is declining. Conversely, the full-time working woman segment is increasing across all segments, indicating a diversification of the full-time working woman segment.
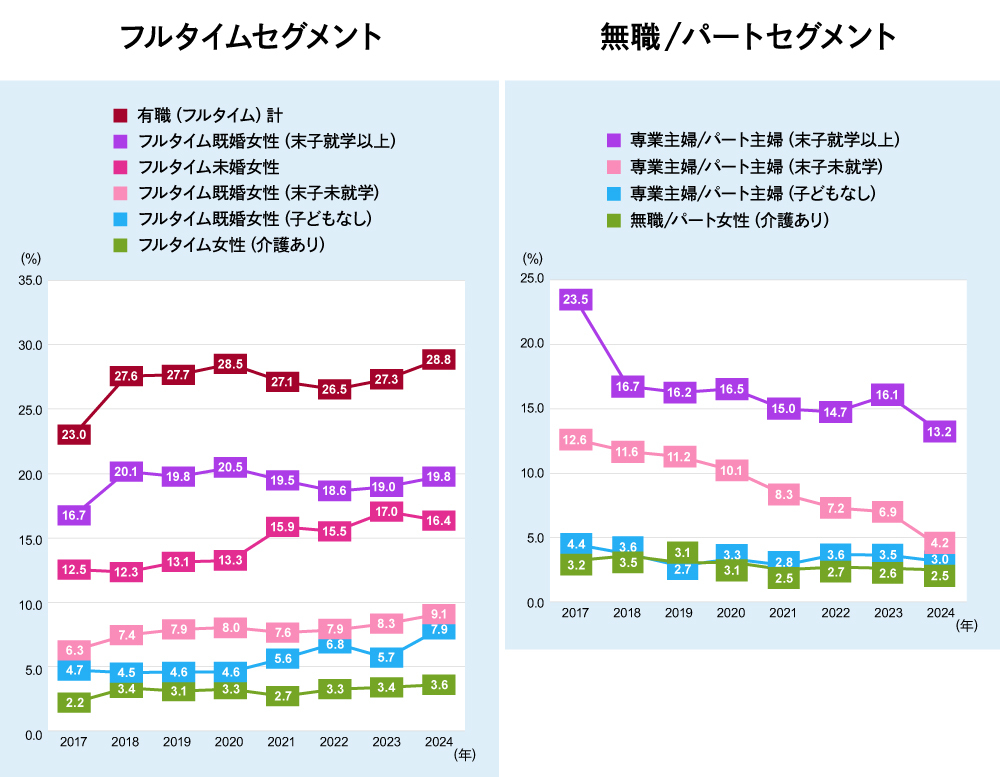
Furthermore, age distribution within segments is diversifying. For example, among full-time unmarried women, the proportion of those in their 20s—which previously accounted for over 60%—has shrunk, while those in their 30s and 50s have significantly increased. Similarly, for full-time homemakers/part-time homemakers (with youngest child not yet in school), the presence of mothers in their 40s at daycare centers and kindergartens is growing, indicating age dispersion within the same segment.
These changes suggest that women's media behavior may no longer be fully captured by traditional gender-age categories alone. Therefore, we aim to capture these signs of diversification and change by conducting analyses based on life stages.
Media Exposure Bubble Chart by Life Stage
First, let's examine the media contact bubble chart by life stage. The horizontal axis represents reach within the segment, the vertical axis shows weekly contact frequency, and bubble size indicates contact duration. Dividing into four quadrants based on 70% reach and 5 times frequency, the upper right quadrant plots media that many people contact frequently, which can be termed "mass-type media." Similarly, the lower quadrant shows "infrastructure-type media" with high reach but not particularly high contact frequency.
Note that contact with SNS accounts operated by individual media outlets (like magazines or newspapers) may be classified under "Internet (Smartphone)." Therefore, please view this as an overall trend.
As an example, let's first compare full-time married women (no children) and full-time married women (youngest child not yet in school).
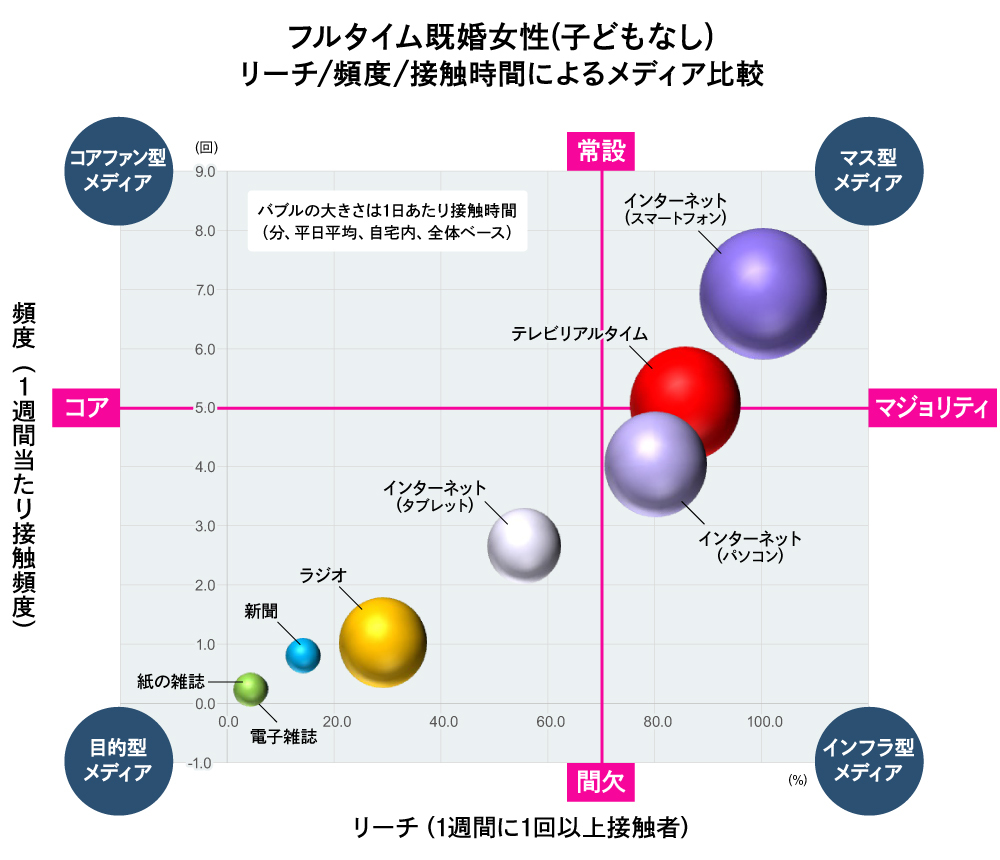
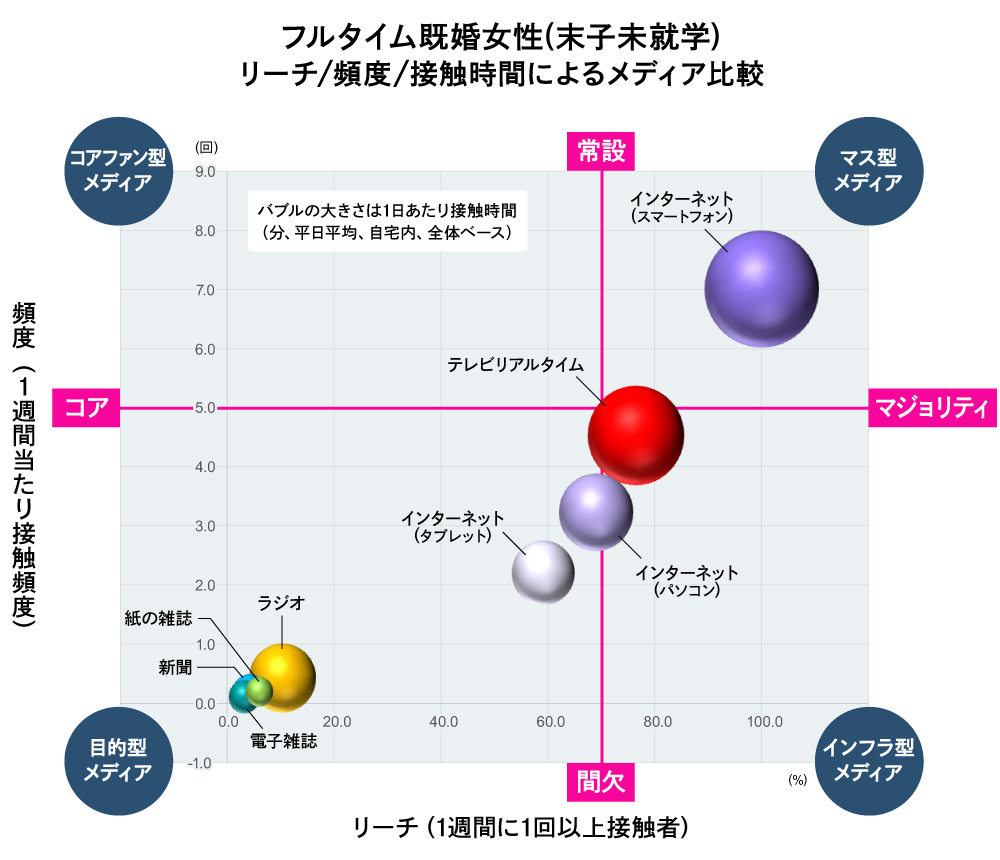
For full-time married women (no children), Internet (smartphone) and TV (live viewing) were mass media, while Internet (PC) was infrastructure media. Conversely, for full-time married women (youngest child not yet in school), mass media consisted solely of Internet (smartphone). Contact time for infrastructure media—TV (live viewing), Internet (PC), and Internet (tablet)—was noticeably reduced.
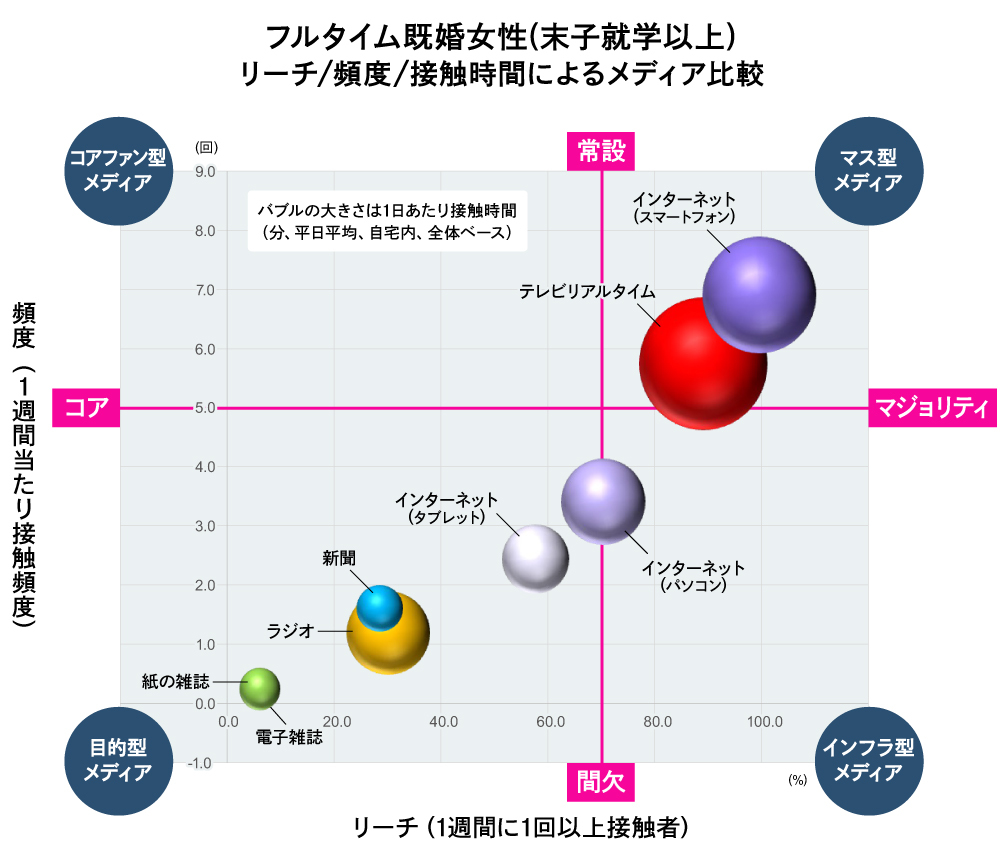
The life stage of full-time married women (youngest child not yet in school) tends to involve increased time spent on childcare and housework, leading to reduced media exposure. The same applies to full-time homemakers/part-time homemakers (youngest child not yet in school), resulting in the shortest total media exposure time across all segments. However, this trend does not appear to be one-directional.As children grow older, media exposure time begins to increase again. For full-time married women (youngest child in school or older), live TV viewing time increases significantly, and total media exposure time also rises.
Furthermore, even within the segment of women in the midst of raising their youngest child (not yet in school), regardless of employment status, while both live TV viewing and total media exposure time decrease, internet (smartphone) usage tends to be significantly longer compared to the preceding and following segments, ranking third only to students and full-time unmarried women. In other words, for busy women in the child-rearing phase, the internet (smartphone) may serve as a medium that fits into their limited time and space.
Differing Information Awareness and Ad Perception by Life Stage
Finally, let's examine attitudes and values related to media behavior. First, regarding information awareness and behavior, mapping each segment using correspondence analysis (*) revealed they could be categorized as either "information management oriented" or "information utilization oriented," and as either "proactive/aggressive" or "passive/conservative" towards information.
※Correspondence Analysis = An analytical method that visualizes relationships between categorical data. It measures the "distance" between categories and visualizes their "relationships," enabling a visual understanding of data patterns and structures. Items with strong relevance are plotted closer together, while those with weak relevance are plotted farther apart.
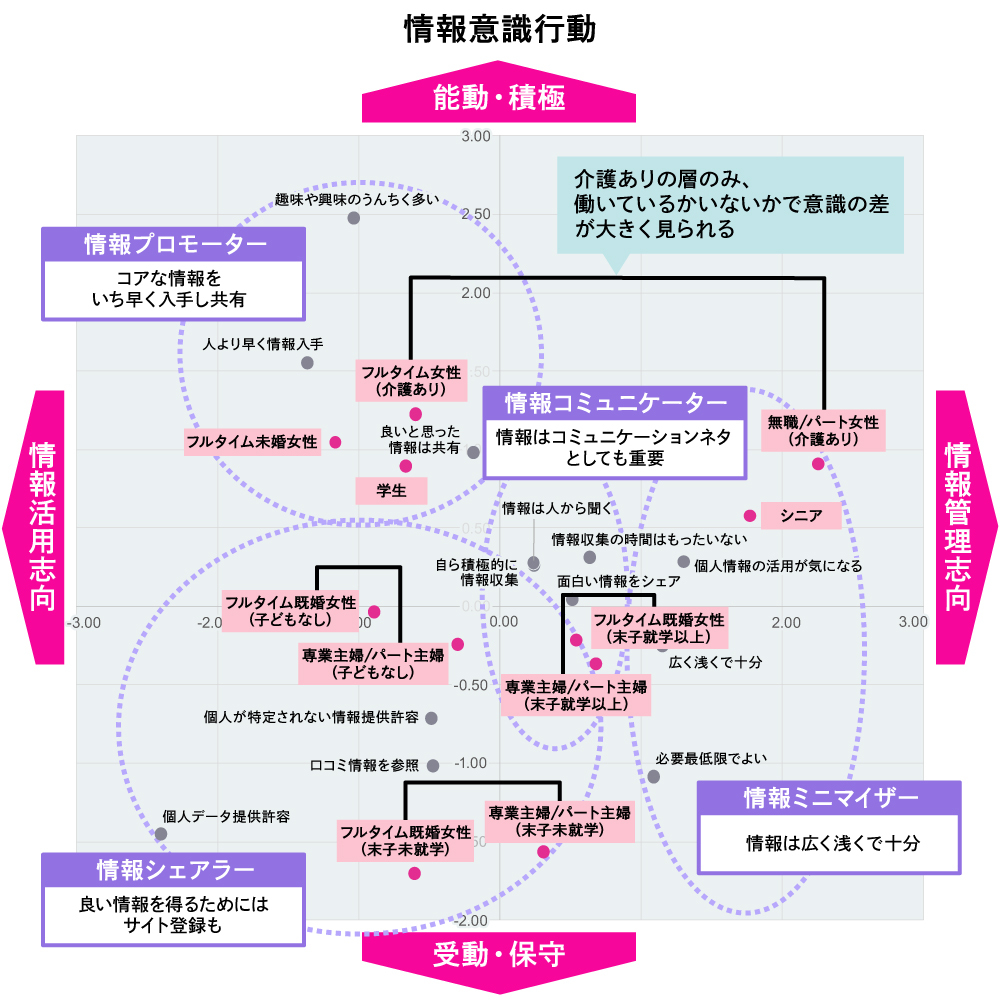
In this diagram, each segment was plotted as follows. Here is one example.
- Full-time unmarried women and students, who include many young people, are "Information Promoters" who actively seek out and share core information.
- The segment with youngest children not yet in school are "information sharers" who register on sites or use word-of-mouth to obtain good information.
- Those with youngest children in school or older are "Information Communicators" who enjoy using information as conversation topics.
- Seniors and unemployed/part-time women (with caregiving responsibilities) were plotted as "information minimizers," who seek only the bare minimum of information.
Generally, segments at similar life stages show similar information awareness and behavior.
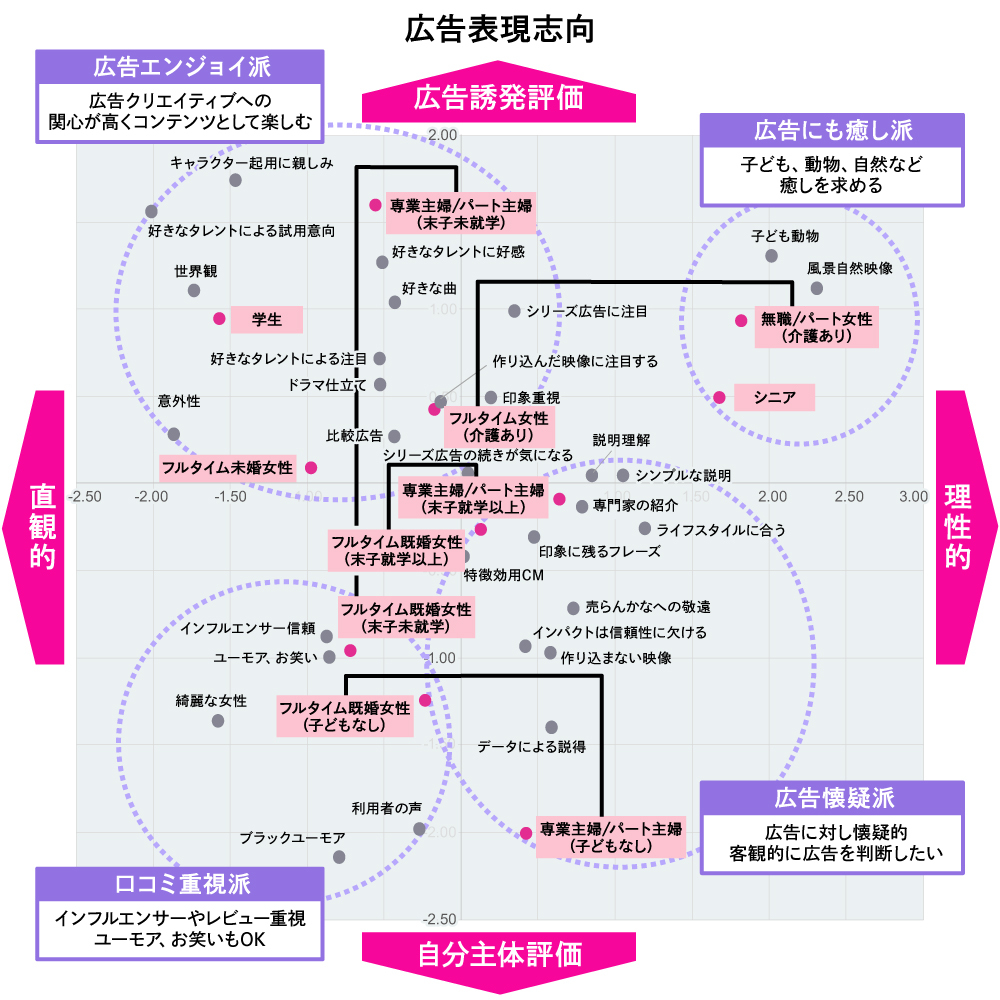
However, when examining how they perceive advertising—specifically advertising expression preferences—a significant divide emerged on the map based on employment status. For example, even within the same childless segment:
- Full-time married women (no children) were "Word-of-Mouth Focused," prioritizing influencers and reviews
- while full-time/part-time homemakers (no children) were divided into "advertising skeptics" who want to judge ads objectively.
. Furthermore,
- full-time married women (youngest child not yet in school) are "word-of-mouth prioritizers,"
- Full-time/part-time homemakers (youngest child not yet in school) are the "Advertising Enjoyment Group" who enjoy ads as content.
Let's also look at shopping behavior.
Let's also look at shopping attitudes. Here, we've organized food purchasing behavior at supermarkets and similar venues.
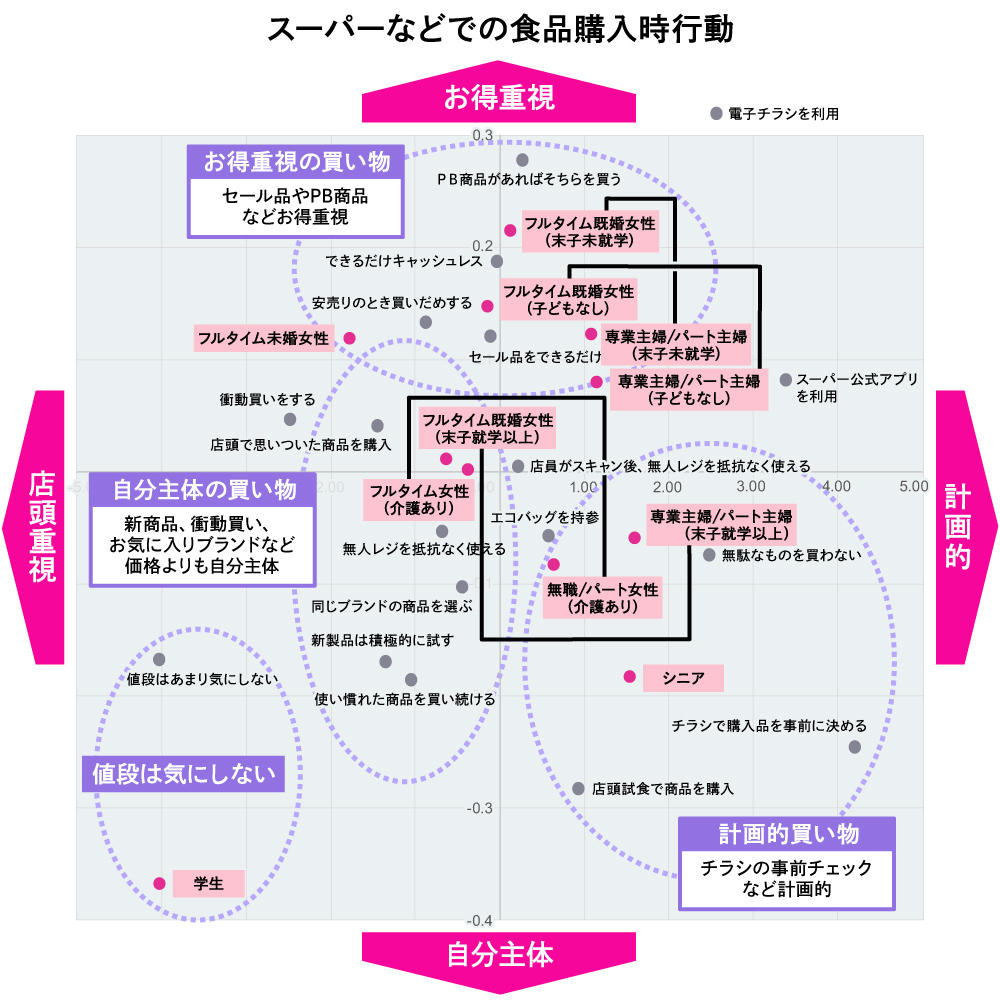
- In segments with relatively younger members—full-time unmarried women, full-time married women (no children), full-time homemakers/part-time homemakers (no children), full-time married women (youngest child not yet in school), and full-time homemakers/part-time homemakers (youngest child not yet in school)— "Value-focused shopping" for sale items and private brand (PB) products
- Full-time women (with caregiving responsibilities) and full-time married women (with youngest child in school or older) tend toward "self-directed shopping" for familiar products or brands.
- Full-time homemakers/part-time homemakers (youngest child in school or older), unemployed/part-time women (with caregiving responsibilities), and seniors tended toward "planned shopping," using flyers and samples to avoid unnecessary purchases.
Students, on the other hand, appear to shop without much concern for price.
We found differences in awareness, values, and behaviors depending on the segment. By referencing these trends alongside media behaviors by female life stage, more effective advertising communication may become possible.
At Dentsu Inc. Media Innovation Lab, we intend to continue capturing these signs of change among women, sharpening our planning and marketing intuition, and advancing our analysis by women's life stages.
Next time, we plan to focus on more detailed breakdowns of media behavior, such as temporal changes and content consumption.
[Survey Overview]
Data Source: Dentsu Inc. d-campX surveys conducted from 2017 to 2024
Survey Area: Greater Tokyo Area


Was this article helpful?
Share this article


Newsletter registration is here
We select and publish important news every day
For inquiries about this article
Author

Sakakibara Rie
Dentsu Inc.
Marketing Administration Center Media Innovation Research Department
Principal Researcher
After working at a bank, joined Dentsu Inc. Assigned to DENTSU SOKEN INC., then worked in Media Services / Newspaper Division's Data Solutions Department, and has been responsible for media research and studies since 2024. Current research focuses include generational media behavior, comparisons of local versus urban media behavior, surveys on actual SNS usage, and media behavior among women across life stages.
Series
Eiko Kitamura
Dentsu Inc.
Marketing Administration Center Media Innovation Research Department
Principal Researcher
After joining the company, I worked in the Data Marketing Center and other departments before joining the Media Innovation Research Department in 2022. I conduct research and studies on topics such as media environment analysis and media behavior by women's life stages.

dentsu Media Innovation Lab
Dentsu Inc.
Launched in October 2017, leveraging Dentsu Inc.'s longstanding media and audience research expertise. Conducts research and disseminates insights to capture shifts in people's diverse information behaviors and understand the broader media landscape. Provides proposals and consulting on the communication approaches companies need within this context.
Series Insight MemoSpecial Discussion: "Japan's Advertising Expenditures"Explore the Amazing World of YouTube Creators with UUUMInformation Media White Paper 2024: The Rapidly Changing Media Environment and ConsumersLife Stage Matters More Than Age!? Analyzing Women's Media Behavior in the Age of Diversity100 years since its birth. Radio, today...College Students and the Future of Media, Communication, and Advertising in Ten YearsInformation Media White Paper 2025: New Horizons in Communication Shaping the Future
Also read
▼Increasing Working Women and the Resolution of the M-Shaped Curve
▼Significant Differences Even Among Peers! Capturing the Diversification of Women's Life Stages
▼Life Stage-Specific Media Exposure Bubble Charts
▼Life Stage-Specific Differences in Information Awareness and Ad Perception
Working Women Increase, Moving Toward Resolving the M-Shaped Curve
According to the Ministry of Internal Affairs and Communications' Basic Survey on Employment Structure (conducted every five years), released in 2023, the female employment rate for those aged 25-39 exceeded 80% for the first time in 2022. This indicates that the traditional dip in the female employment rate observed in the 30s, known as the M-shaped curve, is gradually flattening. Women's life stages are diversifying.
This situation will significantly impact women's consumption and media behaviors. It's not just women. As dual-income households increase yearly, men's participation in household chores is rising, particularly in urban areas. Men's involvement in purchasing decisions as household managers—for example, buying food, daily necessities, and household appliances—is expected to grow. Marketing and media planning must also capture these changes.
Figure right: Created by modifying the "2023 White Paper on Health, Labour and Welfare" (Ministry of Health, Labour and Welfare) ( https://www.mhlw.go.jp/stf/wp/hakusyo/kousei/22/backdata/02-01-01-03.html )
Significant Differences Even Among Peers! Understanding the Diversification of Women's Life Stages
Let's examine the diversification of women's life stages using Dentsu Inc.'s large-scale survey data (Dentsu d-camp X / Details here ). We focused on factors like employment status, marital status, and children, extracting 11 segments where we could consistently maintain a fixed sample size.
Looking at the trend from 2017 to 2024, when continuous data collection was possible, we see that the full-time homemaker/part-time homemaker segment is declining. Conversely, the full-time working woman segment is increasing across all segments, indicating a diversification of the full-time working woman segment.
Furthermore, age distribution within segments is diversifying. For example, among full-time unmarried women, the proportion of those in their 20s—which previously accounted for over 60%—has shrunk, while those in their 30s and 50s have significantly increased. Similarly, for full-time homemakers/part-time homemakers (with youngest child not yet in school), the presence of mothers in their 40s at daycare centers and kindergartens is growing, indicating age dispersion within the same segment.
These changes suggest that women's media behavior may no longer be fully captured by traditional gender-age categories alone. Therefore, we aim to capture these signs of diversification and change by conducting analyses based on life stages.
Media Exposure Bubble Chart by Life Stage
First, let's examine the media contact bubble chart by life stage. The horizontal axis represents reach within the segment, the vertical axis shows weekly contact frequency, and bubble size indicates contact duration. Dividing into four quadrants based on 70% reach and 5 times frequency, the upper right quadrant plots media that many people contact frequently, which can be termed "mass-type media." Similarly, the lower quadrant shows "infrastructure-type media" with high reach but not particularly high contact frequency.
Note that contact with SNS accounts operated by individual media outlets (like magazines or newspapers) may be classified under "Internet (Smartphone)." Therefore, please view this as an overall trend.
As an example, let's first compare full-time married women (no children) and full-time married women (youngest child not yet in school).
For full-time married women (no children), Internet (smartphone) and TV (live viewing) were mass media, while Internet (PC) was infrastructure media. Conversely, for full-time married women (youngest child not yet in school), mass media consisted solely of Internet (smartphone). Contact time for infrastructure media—TV (live viewing), Internet (PC), and Internet (tablet)—was noticeably reduced.
The life stage of full-time married women (youngest child not yet in school) tends to involve increased time spent on childcare and housework, leading to reduced media exposure. The same applies to full-time homemakers/part-time homemakers (youngest child not yet in school), resulting in the shortest total media exposure time across all segments. However, this trend does not appear to be one-directional.As children grow older, media exposure time begins to increase again. For full-time married women (youngest child in school or older), live TV viewing time increases significantly, and total media exposure time also rises.
Furthermore, even within the segment of women in the midst of raising their youngest child (not yet in school), regardless of employment status, while both live TV viewing and total media exposure time decrease, internet (smartphone) usage tends to be significantly longer compared to the preceding and following segments, ranking third only to students and full-time unmarried women. In other words, for busy women in the child-rearing phase, the internet (smartphone) may serve as a medium that fits into their limited time and space.
Differing Information Awareness and Ad Perception by Life Stage
Finally, let's examine attitudes and values related to media behavior. First, regarding information awareness and behavior, mapping each segment using correspondence analysis (*) revealed they could be categorized as either "information management oriented" or "information utilization oriented," and as either "proactive/aggressive" or "passive/conservative" towards information.
※Correspondence Analysis = An analytical method that visualizes relationships between categorical data. It measures the "distance" between categories and visualizes their "relationships," enabling a visual understanding of data patterns and structures. Items with strong relevance are plotted closer together, while those with weak relevance are plotted farther apart.
In this diagram, each segment was plotted as follows. Here is one example.
- Full-time unmarried women and students, who include many young people, are "Information Promoters" who actively seek out and share core information.
- The segment with youngest children not yet in school are "information sharers" who register on sites or use word-of-mouth to obtain good information.
- Those with youngest children in school or older are "Information Communicators" who enjoy using information as conversation topics.
- Seniors and unemployed/part-time women (with caregiving responsibilities) were plotted as "information minimizers," who seek only the bare minimum of information.
Generally, segments at similar life stages show similar information awareness and behavior.
However, when examining how they perceive advertising—specifically advertising expression preferences—a significant divide emerged on the map based on employment status. For example, even within the same childless segment:
- Full-time married women (no children) were "Word-of-Mouth Focused," prioritizing influencers and reviews
- while full-time/part-time homemakers (no children) were divided into "advertising skeptics" who want to judge ads objectively.
. Furthermore,
- full-time married women (youngest child not yet in school) are "word-of-mouth prioritizers,"
- Full-time/part-time homemakers (youngest child not yet in school) are the "Advertising Enjoyment Group" who enjoy ads as content.
Let's also look at shopping behavior.
Let's also look at shopping attitudes. Here, we've organized food purchasing behavior at supermarkets and similar venues.
- In segments with relatively younger members—full-time unmarried women, full-time married women (no children), full-time homemakers/part-time homemakers (no children), full-time married women (youngest child not yet in school), and full-time homemakers/part-time homemakers (youngest child not yet in school)— "Value-focused shopping" for sale items and private brand (PB) products
- Full-time women (with caregiving responsibilities) and full-time married women (with youngest child in school or older) tend toward "self-directed shopping" for familiar products or brands.
- Full-time homemakers/part-time homemakers (youngest child in school or older), unemployed/part-time women (with caregiving responsibilities), and seniors tended toward "planned shopping," using flyers and samples to avoid unnecessary purchases.
Students, on the other hand, appear to shop without much concern for price.
We found differences in awareness, values, and behaviors depending on the segment. By referencing these trends alongside media behaviors by female life stage, more effective advertising communication may become possible.
At Dentsu Inc. Media Innovation Lab, we intend to continue capturing these signs of change among women, sharpening our planning and marketing intuition, and advancing our analysis by women's life stages.
Next time, we plan to focus on more detailed breakdowns of media behavior, such as temporal changes and content consumption.
[Survey Overview]
Data Source: Dentsu Inc. d-campX surveys conducted from 2017 to 2024
Survey Area: Greater Tokyo Area
Was this article helpful?
Share this article
Newsletter registration is here
We select and publish important news every day
For inquiries about this article
Author
Sakakibara Rie
Dentsu Inc.
Marketing Administration Center Media Innovation Research Department
Principal Researcher
After working at a bank, joined Dentsu Inc. Assigned to DENTSU SOKEN INC., then worked in Media Services / Newspaper Division's Data Solutions Department, and has been responsible for media research and studies since 2024. Current research focuses include generational media behavior, comparisons of local versus urban media behavior, surveys on actual SNS usage, and media behavior among women across life stages.

Eiko Kitamura
Dentsu Inc.
Marketing Administration Center Media Innovation Research Department
Principal Researcher
After joining the company, I worked in the Data Marketing Center and other departments before joining the Media Innovation Research Department in 2022. I conduct research and studies on topics such as media environment analysis and media behavior by women's life stages.
dentsu Media Innovation Lab
Dentsu Inc.
Launched in October 2017, leveraging Dentsu Inc.'s longstanding media and audience research expertise. Conducts research and disseminates insights to capture shifts in people's diverse information behaviors and understand the broader media landscape. Provides proposals and consulting on the communication approaches companies need within this context.