Note: This website was automatically translated, so some terms or nuances may not be completely accurate.
Both the purchasing funnel and content consumption vary this much depending on women's life stages!
This series analyzes media behavior with a focus on women's life stages.
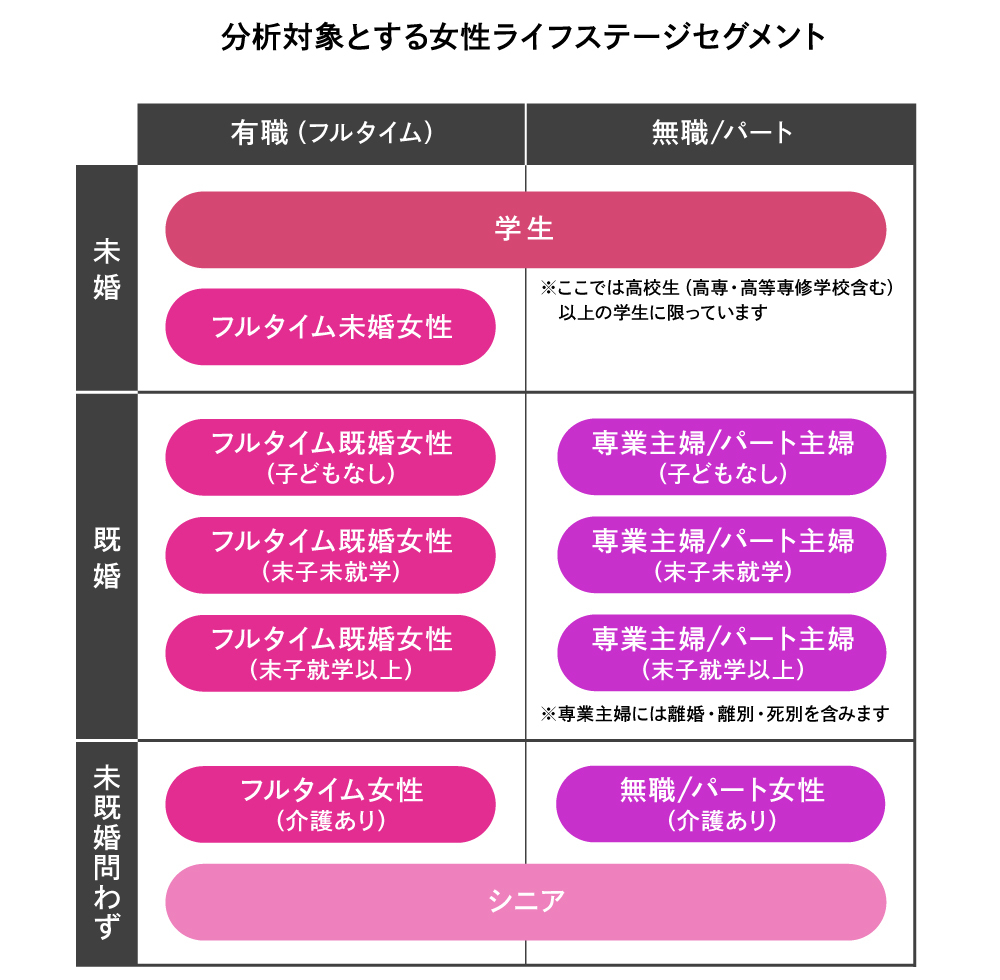
For the analysis, we examined Dentsu Inc.'s large-scale survey data ( Dentsu d-campX / details here ) to define women's life stages. We focused on factors like employment status, marital status, and children's presence, extracting 11 segments where we could consistently maintain a sufficient sample size.
This time, we introduce the role of media in the female purchasing funnel and the viewing content of each segment.
▼Is the "M-Shaped Curve" Inherent in Every Woman? Examining Women's Labor Participation Through Daily Time Use
▼Busy Working Moms Have a Shortened Purchase Funnel. How the Purchase Funnel Varies by Life Stage
▼Is Your Content Reaching Your Target's Life Stage?
Is the "M-Shaped Curve" Inherent in Every Woman? Examining Women's Labor Participation Through Daily Time Use
In Part 1, we mentioned that the number of working women is increasing and dual-income households now make up a high proportion. But honestly, it didn't feel right. I couldn't sense that women were participating in companies and society to such an extent.
Looking at macro data like labor participation rates, the "M-shaped curve" appears to be narrowing. But perhaps this is simply because the curve is now embedded within each individual, making it harder to see. Driven by this concern, we examined micro-level data on time use by gender and generation to understand labor participation patterns.
What I found was that men's daily work hours on weekdays significantly exceeded women's, with the gap widening notably among those in their 30s and 40s – a period when many are raising children.Looking specifically at time spent on household chores (cooking, cleaning, laundry, shopping, childcare, and miscellaneous household tasks combined), and particularly childcare time, women's time spent significantly exceeds men's, again centered around this age group. This reveals that the apparent resolution of the M-shaped curve stems from individual women shouldering a large proportion of household labor while working.Furthermore, if household chores are considered labor, the total working hours (combining paid work and household labor) show women exceeding men, particularly in their 30s. This suggests they are managing their limited disposable time to engage in media consumption and purchasing activities.
Therefore, this time, we will examine the data while focusing on segments such as busy mothers of youngest preschool children juggling work, housework, and childcare, as well as the differences between full-time married women and full-time homemakers/part-time homemakers.
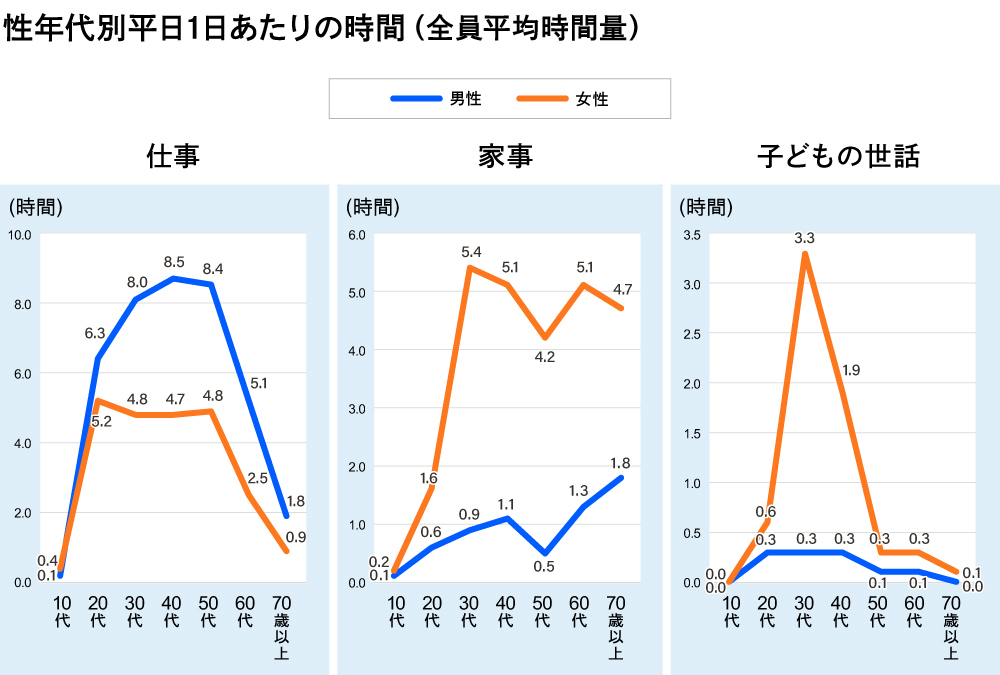 Source: Graph created by processing data from NHK Broadcasting Culture Research Institute's "2020 National Time Use Survey" ( https://www.nhk.or.jp/bunken/yoron-jikan/ )
Busy working moms also have a shortened purchasing funnel. The purchasing funnel varies by life stage
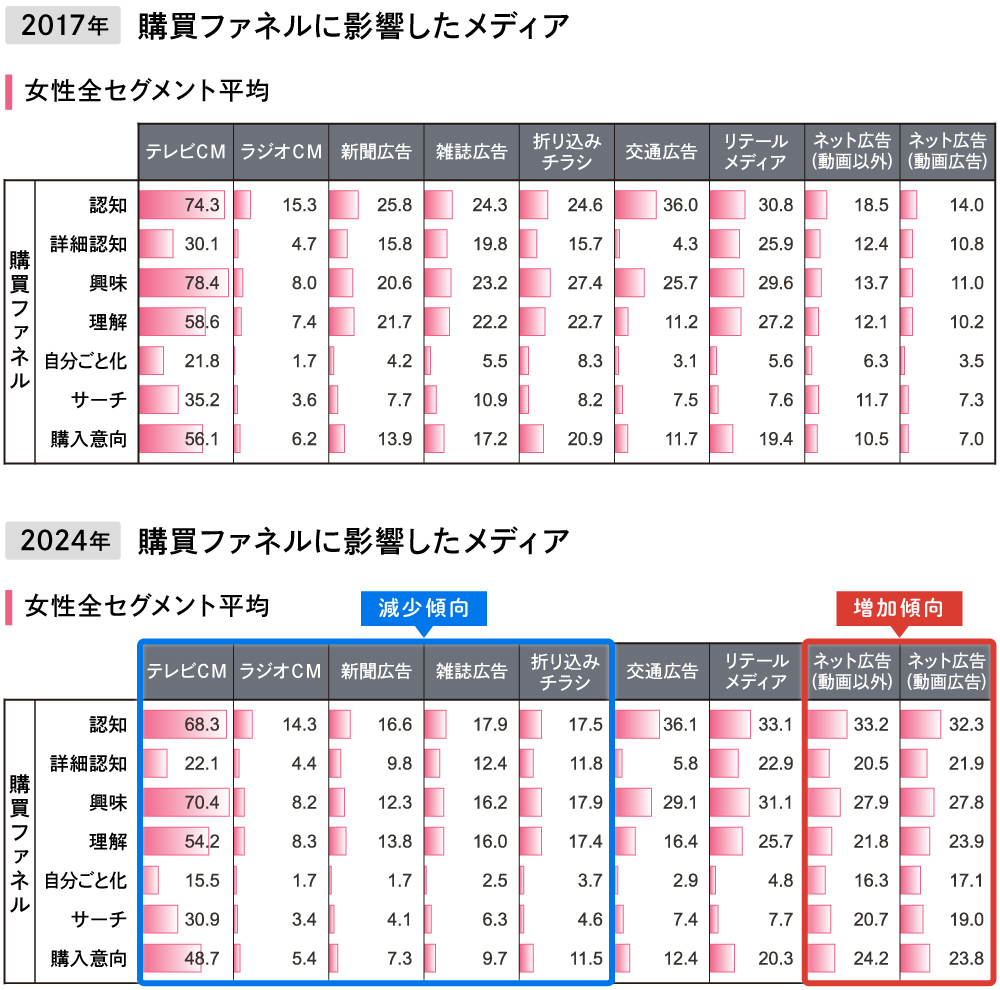
First, let's examine the role of each media channel in the purchase funnel. We compared responses from Dentsu Inc. d-campX data in 2017 and 2024 regarding which media channels "influenced" consumers at each stage from awareness to purchase intent. The funnel for the four mass media channels and insert flyers shows a shrinking trend, while conversely, online advertising—both video and non-video—showed significant score growth. This expansion is driven by smartphones.
We extracted TV commercials and online ads (video ads) from this data and compared four segments corresponding to child-rearing periods. To make the trends easier to see in the graph below, we listed the differences from the overall average for women. A larger positive difference indicates a stronger trend, while a smaller difference indicates a weaker trend. The results show diverging trends across the segments.
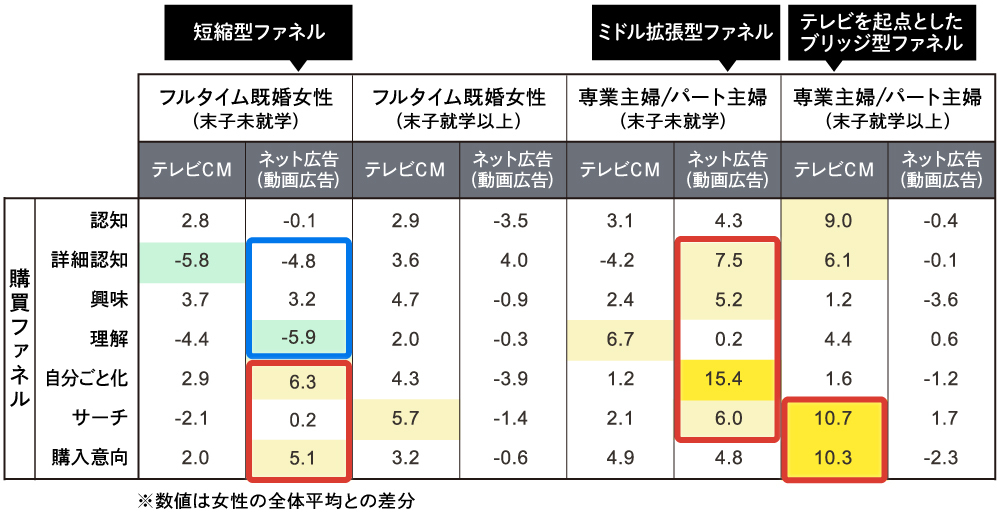
Particularly for full-time married women (youngest child not yet in school), it makes sense that they experience a shortened purchase funnel—moving directly from personal relevance to purchase—without passing through the middle funnel. This is likely because they are consumed by both work and childcare demands.
Full-time married women (youngest child not yet in school) → Shortened funnel
Focusing on online ads (video ads), scores for detailed awareness and understanding (middle funnel) are not high, but ad effectiveness is strong in personal relevance and purchase intent. This busy segment juggling work and childcare shows potential to reach purchase without passing through the middle funnel for online ads (video ads), suggesting a "shortened funnel."
Full-time/Part-time Housewives (youngest child not yet in school) → Middle-Expanded Funnel
Focusing on online ads (video ads), scores for the middle funnel—from detailed awareness to search—significantly exceed the average, indicating the middle funnel remains highly functional. Personalization, in particular, is notably high at 15.4 points.
Full-time/Part-time Housewives (Youngest Child in School or Older) → TV-Based Bridge Funnel
Compared to other segments, this group shows notably high TV commercial scores. Specifically, search intent and purchase intent exceed the overall female average by about 10 points. Since TV commercials drive online search behavior (like search) and in-store purchasing ( ), this can be termed a "bridge-type funnel."
Is the content reaching the target's life stage?
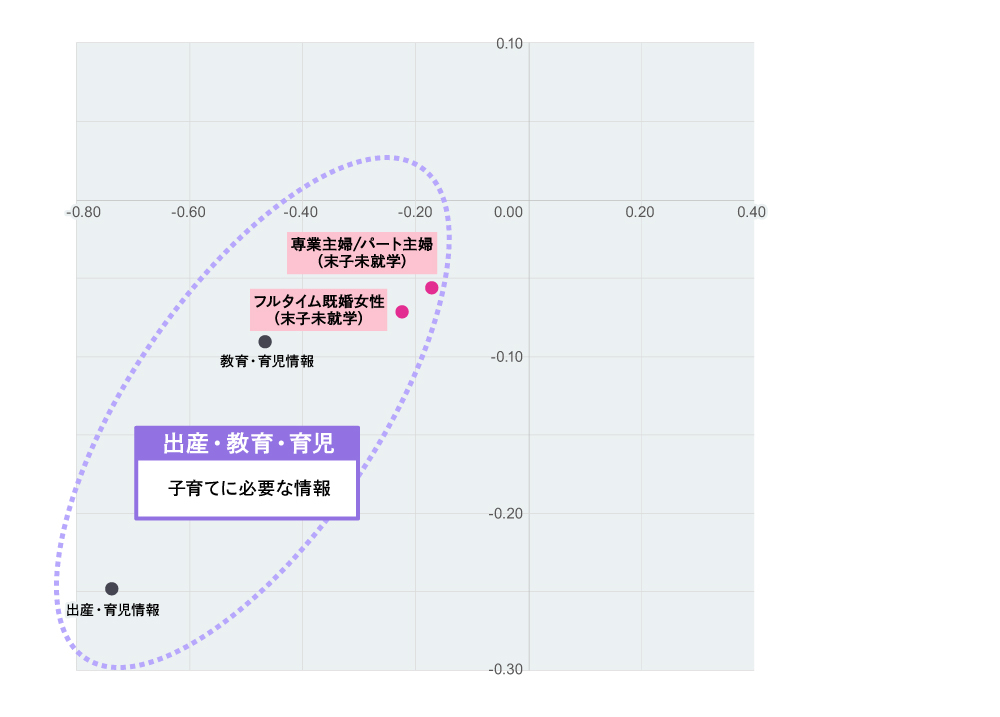
Finally, let's examine TV and online viewing content. Mapping each segment using correspondence analysis (*) revealed distinct content preferences per segment, identified by axes such as "information value" vs. "entertainment value" and whether content is "stock-type" or "flow-type."
※Correspondence Analysis = An analytical method that visualizes relationships between categorical data. It measures the "distance" between categories and visualizes their "relationships," enabling a visual understanding of data patterns and structures. Items with strong relevance are plotted closer together, while those with weak relevance are plotted farther apart.
Regarding preferred TV genres, segments with youngest children in school or older showed preferences for "entertainment content" like movies and dramas, while relatively older segments preferred "information variety" content such as home/lifestyle information and talk shows.
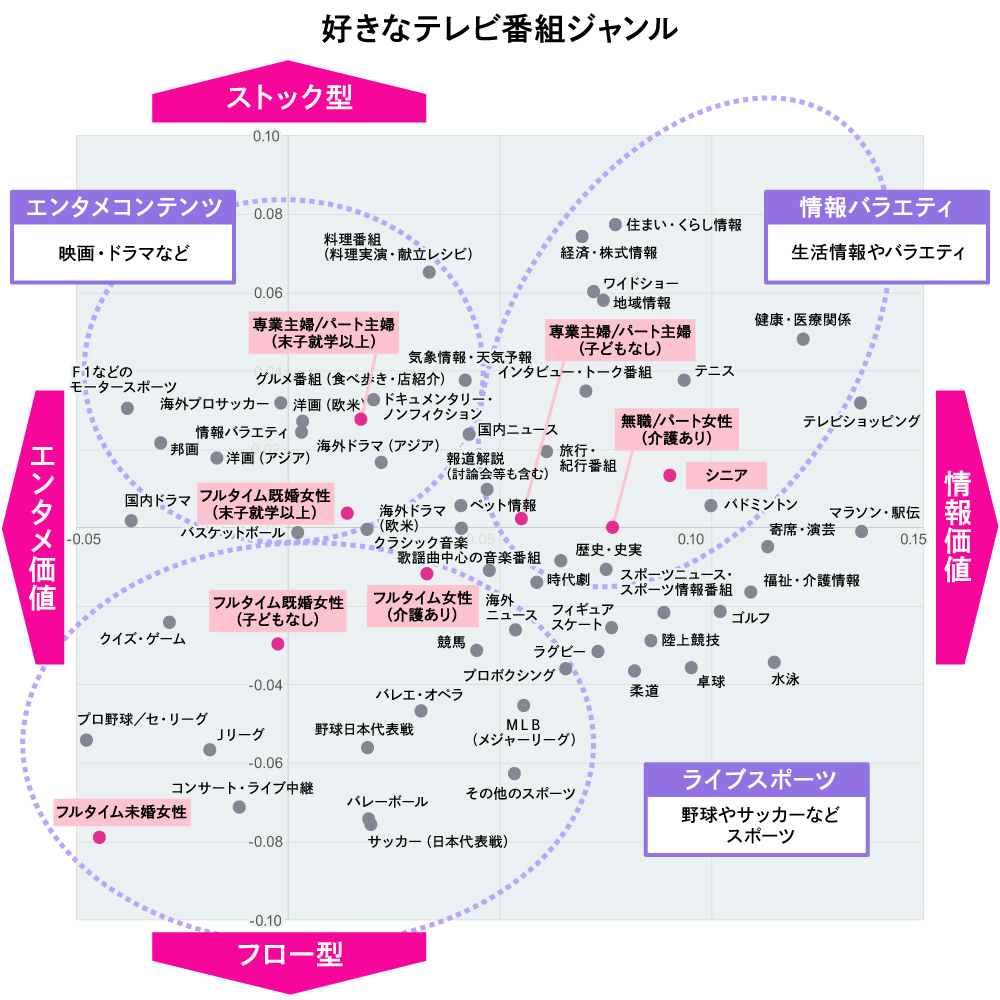
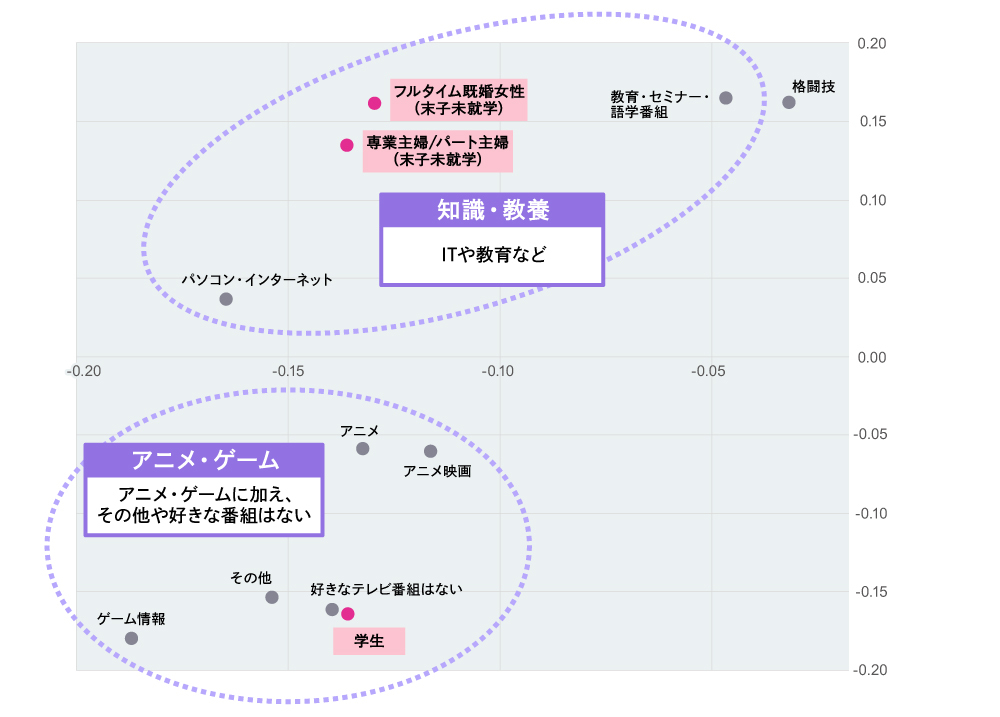
Interestingly, segments with students and those with youngest children not yet in school were plotted on the far left quadrant, outside the scope of this diagram. Students show a preference for "Anime/Games," while the segments with youngest children not yet in school appear to favor "Knowledge/Cultural Enrichment" content.
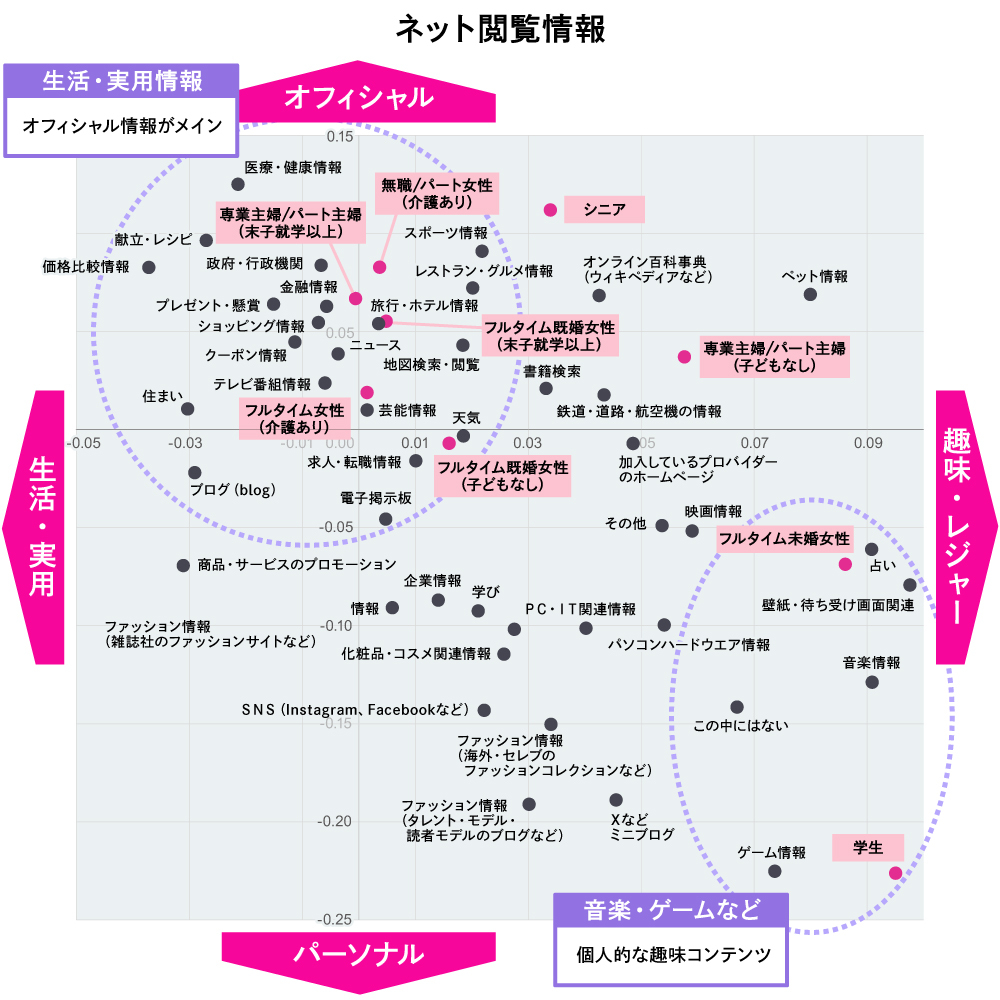
Regarding online browsing habits shown below, preferences include "Life/Practical Information" like government/administrative agency information and meal plans/recipes, as well as personal hobbies such as "Music/Games, etc."The youngest child not yet in school segment again fell outside the chart, plotted in the lower left quadrant. This segment actively sought information on "childbirth, education, and childcare," clearly distinguishing itself from the other segments. Thus, both the student segment and the youngest child not yet in school segment have distinctive content preference positioning. When planning TV commercials or online ads, it seems necessary to carefully consider the content being advertised.
Let's summarize the key points discussed so far.
Point 1: While working women are increasing, women still spend overwhelmingly more time on housework and childcare, managing media consumption within limited time.
Point 2: The purchasing funnel varies significantly by segment. For segments in the peak child-rearing phase where time is precious, the funnel may be shortened, necessitating planning that accounts for this.
Point 3: In addition to students, the segment with youngest children not yet in school occupies a unique position in content consumption. Note that advertising may struggle to reach them effectively using strategies similar to those for other closely related segments.
We are in an era of diverse lifestyles and values among women. Rather than segmenting female targets by age, approaching them by life stage can increase the resolution of target identification and media planning.As the number of working women increases, those in child-rearing years particularly tend to have limited disposable media time, which likely impacts their purchasing funnel and content preferences. The explosive growth of information and content, especially online, may further accelerate this trend. We intend to continue exploring advertising messages and communication approaches that align with the life stages of these women.
[Survey Overview]
Data Source: Dentsu Inc. d-campX Surveys conducted from 2017 to 2024
Survey Region: Greater Tokyo Area


Was this article helpful?
Share this article


Newsletter registration is here
We select and publish important news every day
For inquiries about this article
Back Numbers
Author

Sakakibara Rie
Dentsu Inc.
Marketing Administration Center Media Innovation Research Department
Principal Researcher
After working at a bank, joined Dentsu Inc. Assigned to DENTSU SOKEN INC., then worked in Media Services / Newspaper Division's Data Solutions Department, and has been responsible for media research and studies since 2024. Current research focuses include generational media behavior, comparisons of local versus urban media behavior, surveys on actual SNS usage, and media behavior among women across life stages.
Series
Eiko Kitamura
Dentsu Inc.
Marketing Administration Center Media Innovation Research Department
Principal Researcher
After joining the company, I worked in the Data Marketing Center and other departments before joining the Media Innovation Research Department in 2022. I conduct research and studies on topics such as media environment analysis and media behavior by women's life stages.

dentsu Media Innovation Lab
Dentsu Inc.
Launched in October 2017, leveraging Dentsu Inc.'s longstanding media and audience research expertise. Conducts research and disseminates insights to capture shifts in people's diverse information behaviors and understand the broader media landscape. Provides proposals and consulting on the communication approaches companies need within this context.
Series Insight MemoSpecial Discussion: "Japan's Advertising Expenditures"Explore the Amazing World of YouTube Creators with UUUMInformation Media White Paper 2024: The Rapidly Changing Media Environment and ConsumersLife Stage Matters More Than Age!? Analyzing Women's Media Behavior in the Age of Diversity100 years since its birth. Radio, today...College Students and the Future of Media, Communication, and Advertising in Ten YearsInformation Media White Paper 2025: New Horizons in Communication Shaping the Future
Also read
▼Is the "M-Shaped Curve" Inherent in Every Woman? Examining Women's Labor Participation Through Daily Time Use
▼Busy Working Moms Have a Shortened Purchase Funnel. How the Purchase Funnel Varies by Life Stage
▼Is Your Content Reaching Your Target's Life Stage?
Is the "M-Shaped Curve" Inherent in Every Woman? Examining Women's Labor Participation Through Daily Time Use
In Part 1, we mentioned that the number of working women is increasing and dual-income households now make up a high proportion. But honestly, it didn't feel right. I couldn't sense that women were participating in companies and society to such an extent.
Looking at macro data like labor participation rates, the "M-shaped curve" appears to be narrowing. But perhaps this is simply because the curve is now embedded within each individual, making it harder to see. Driven by this concern, we examined micro-level data on time use by gender and generation to understand labor participation patterns.
What I found was that men's daily work hours on weekdays significantly exceeded women's, with the gap widening notably among those in their 30s and 40s – a period when many are raising children.Looking specifically at time spent on household chores (cooking, cleaning, laundry, shopping, childcare, and miscellaneous household tasks combined), and particularly childcare time, women's time spent significantly exceeds men's, again centered around this age group. This reveals that the apparent resolution of the M-shaped curve stems from individual women shouldering a large proportion of household labor while working.Furthermore, if household chores are considered labor, the total working hours (combining paid work and household labor) show women exceeding men, particularly in their 30s. This suggests they are managing their limited disposable time to engage in media consumption and purchasing activities.
Therefore, this time, we will examine the data while focusing on segments such as busy mothers of youngest preschool children juggling work, housework, and childcare, as well as the differences between full-time married women and full-time homemakers/part-time homemakers.
Busy working moms also have a shortened purchasing funnel. The purchasing funnel varies by life stage
First, let's examine the role of each media channel in the purchase funnel. We compared responses from Dentsu Inc. d-campX data in 2017 and 2024 regarding which media channels "influenced" consumers at each stage from awareness to purchase intent. The funnel for the four mass media channels and insert flyers shows a shrinking trend, while conversely, online advertising—both video and non-video—showed significant score growth. This expansion is driven by smartphones.
We extracted TV commercials and online ads (video ads) from this data and compared four segments corresponding to child-rearing periods. To make the trends easier to see in the graph below, we listed the differences from the overall average for women. A larger positive difference indicates a stronger trend, while a smaller difference indicates a weaker trend. The results show diverging trends across the segments.
Particularly for full-time married women (youngest child not yet in school), it makes sense that they experience a shortened purchase funnel—moving directly from personal relevance to purchase—without passing through the middle funnel. This is likely because they are consumed by both work and childcare demands.
Full-time married women (youngest child not yet in school) → Shortened funnel
Focusing on online ads (video ads), scores for detailed awareness and understanding (middle funnel) are not high, but ad effectiveness is strong in personal relevance and purchase intent. This busy segment juggling work and childcare shows potential to reach purchase without passing through the middle funnel for online ads (video ads), suggesting a "shortened funnel."
Full-time/Part-time Housewives (youngest child not yet in school) → Middle-Expanded Funnel
Focusing on online ads (video ads), scores for the middle funnel—from detailed awareness to search—significantly exceed the average, indicating the middle funnel remains highly functional. Personalization, in particular, is notably high at 15.4 points.
Full-time/Part-time Housewives (Youngest Child in School or Older) → TV-Based Bridge Funnel
Compared to other segments, this group shows notably high TV commercial scores. Specifically, search intent and purchase intent exceed the overall female average by about 10 points. Since TV commercials drive online search behavior (like search) and in-store purchasing ( ), this can be termed a "bridge-type funnel."
Is the content reaching the target's life stage?
Finally, let's examine TV and online viewing content. Mapping each segment using correspondence analysis (*) revealed distinct content preferences per segment, identified by axes such as "information value" vs. "entertainment value" and whether content is "stock-type" or "flow-type."
※Correspondence Analysis = An analytical method that visualizes relationships between categorical data. It measures the "distance" between categories and visualizes their "relationships," enabling a visual understanding of data patterns and structures. Items with strong relevance are plotted closer together, while those with weak relevance are plotted farther apart.
Regarding preferred TV genres, segments with youngest children in school or older showed preferences for "entertainment content" like movies and dramas, while relatively older segments preferred "information variety" content such as home/lifestyle information and talk shows.
Interestingly, segments with students and those with youngest children not yet in school were plotted on the far left quadrant, outside the scope of this diagram. Students show a preference for "Anime/Games," while the segments with youngest children not yet in school appear to favor "Knowledge/Cultural Enrichment" content.
Regarding online browsing habits shown below, preferences include "Life/Practical Information" like government/administrative agency information and meal plans/recipes, as well as personal hobbies such as "Music/Games, etc."The youngest child not yet in school segment again fell outside the chart, plotted in the lower left quadrant. This segment actively sought information on "childbirth, education, and childcare," clearly distinguishing itself from the other segments. Thus, both the student segment and the youngest child not yet in school segment have distinctive content preference positioning. When planning TV commercials or online ads, it seems necessary to carefully consider the content being advertised.
Let's summarize the key points discussed so far.
Point 1: While working women are increasing, women still spend overwhelmingly more time on housework and childcare, managing media consumption within limited time.
Point 2: The purchasing funnel varies significantly by segment. For segments in the peak child-rearing phase where time is precious, the funnel may be shortened, necessitating planning that accounts for this.
Point 3: In addition to students, the segment with youngest children not yet in school occupies a unique position in content consumption. Note that advertising may struggle to reach them effectively using strategies similar to those for other closely related segments.
We are in an era of diverse lifestyles and values among women. Rather than segmenting female targets by age, approaching them by life stage can increase the resolution of target identification and media planning.As the number of working women increases, those in child-rearing years particularly tend to have limited disposable media time, which likely impacts their purchasing funnel and content preferences. The explosive growth of information and content, especially online, may further accelerate this trend. We intend to continue exploring advertising messages and communication approaches that align with the life stages of these women.
[Survey Overview]
Data Source: Dentsu Inc. d-campX Surveys conducted from 2017 to 2024
Survey Region: Greater Tokyo Area
Was this article helpful?
Share this article
Newsletter registration is here
We select and publish important news every day
For inquiries about this article
Back Numbers

Author
Sakakibara Rie
Dentsu Inc.
Marketing Administration Center Media Innovation Research Department
Principal Researcher
After working at a bank, joined Dentsu Inc. Assigned to DENTSU SOKEN INC., then worked in Media Services / Newspaper Division's Data Solutions Department, and has been responsible for media research and studies since 2024. Current research focuses include generational media behavior, comparisons of local versus urban media behavior, surveys on actual SNS usage, and media behavior among women across life stages.

Eiko Kitamura
Dentsu Inc.
Marketing Administration Center Media Innovation Research Department
Principal Researcher
After joining the company, I worked in the Data Marketing Center and other departments before joining the Media Innovation Research Department in 2022. I conduct research and studies on topics such as media environment analysis and media behavior by women's life stages.
dentsu Media Innovation Lab
Dentsu Inc.
Launched in October 2017, leveraging Dentsu Inc.'s longstanding media and audience research expertise. Conducts research and disseminates insights to capture shifts in people's diverse information behaviors and understand the broader media landscape. Provides proposals and consulting on the communication approaches companies need within this context.