Note: This website was automatically translated, so some terms or nuances may not be completely accurate.
The Reality of Video Viewing on Smartphones and PCs as Seen Through Log Data
Watching videos online offers diverse options, including paid streaming services, free streaming services, and video-sharing platforms. Viewing devices also support multi-screen enjoyment across smartphones, computers, and internet-connected TVs, allowing consumers to choose according to their preferences.

However, unlike televisions designed specifically for video viewing, smartphones and computers—which are not dedicated devices—are constantly used for a wide variety of apps with entirely different purposes, such as email, social media, and news sites.
So, how much time is actually spent using video services on smartphones and PCs? Until now, the reality of this usage has been largely unknown.
Therefore, DENTSU SOKEN INC. focused on web and app usage log data. Log data allows for the aggregation of access logs to each video service, enabling a more accurate measurement of usage time on apps and browsers without relying on the respondents' memory. This time, using INTAGE's i-SSP, we aggregated access logs for both smartphone and PC panels over a four-week period from July 4 to 31, 2016, to explore the reality of video viewing on internet-connected devices.
*Note: The survey panels for smartphones and PCs are different. Furthermore, the aggregated results represent the actual situation during the fourth week of July 2016.
Free streaming, video sharing, subscription-based, curated content, and other options have increased for online video services.
First, let's summarize online video services in Japan.
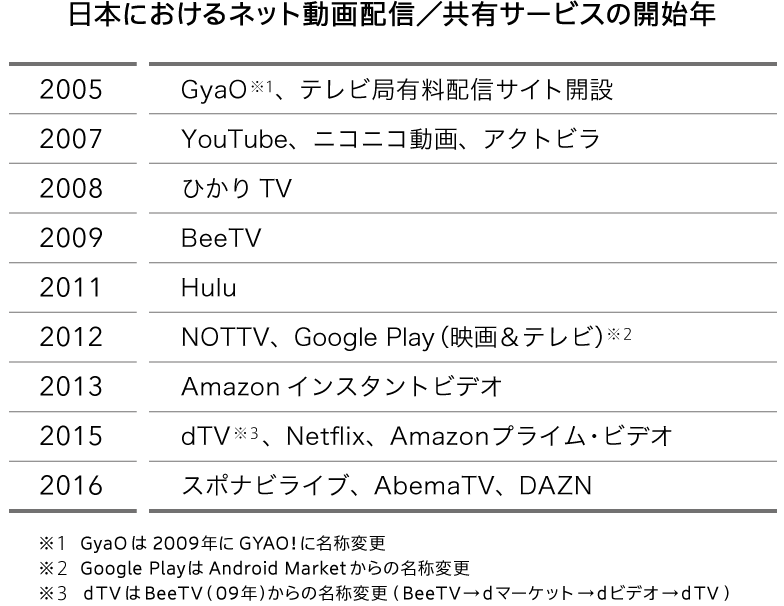
It began with the free streaming service "GYAO!" in 2005, followed by the addition of video sharing services like "YouTube" and "NicoNico Douga" in 2007. In 2011, the US-originated "Hulu" launched, pioneering subscription-based services. Subsequently, similar services like "Amazon Prime Video," "Netflix," and "dTV" started one after another by 2015.
In 2016, the landscape further expanded with the addition of video streaming services like "AbemaTV," which offers curated content; "Sponavi Live," specializing in live sports broadcasts; and "DAZN," which gained significant attention after acquiring J.League broadcasting rights. These additions have significantly broadened consumer choices.
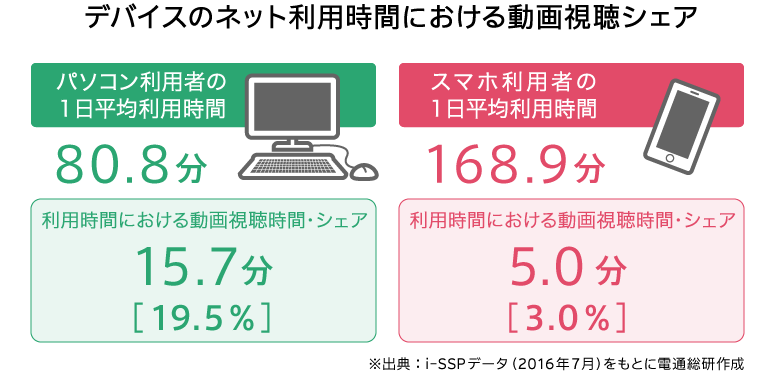
PC video viewing share: 19.5%, smartphones: 3.0%
According to the survey, the average daily internet usage time for PC users was 80.8 minutes, while smartphone users spent an average of 168.9 minutes on the internet and apps, a gap of nearly double. Among video service users, the average daily viewing time was 15.7 minutes (19.5% share) for PCs and 5.0 minutes (3.0% share) for smartphones.
While these are results from the fourth week of July 2016, a pattern emerged where PC > smartphone in terms of video viewing time. PCs are used for longer video viewing sessions, while smartphones show services competing for attention within very limited viewing time.
Furthermore, within service categories like video streaming (paid/free) and video sharing, both PCs and smartphones show video sharing services overwhelmingly dominating the usage time share. This likely reflects the fact that these services are free, have been established for a relatively long time, and have become firmly ingrained habits for many users.
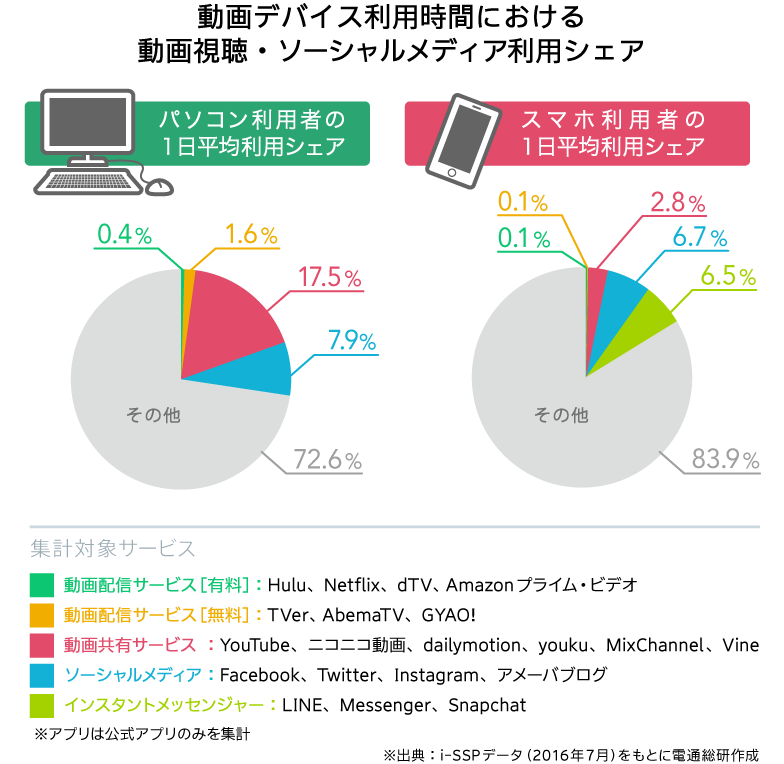
For reference, comparing usage time between social media and video services yielded contrasting results.
On PCs, social media usage time share is 7.9%, lower than video services' 19.5%, showing video dominance. Conversely, on smartphones, social media and instant messengers combined account for 13.2%, while video services are only 3.0%—a gap of over four times, indicating social media dominance.
The younger the demographic, the longer the viewing time for online videos
Next, we isolated video service users and analyzed them by gender and age group.
The average daily video viewing time for video service users is longer than the overall average for each device user: 45.7 minutes on PCs and 17.3 minutes on smartphones. Notably, males in their teens and twenties spent 71.3 minutes on PCs and 27.4 minutes on smartphones.
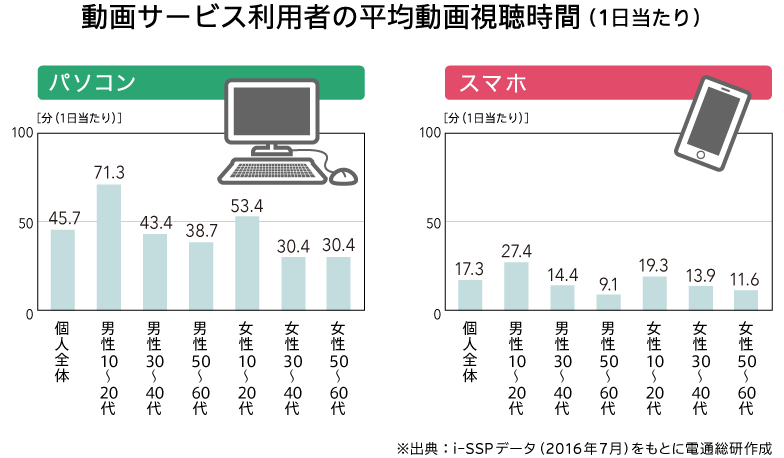
Despite conditions such as data usage limits, smaller screens, and communication-focused usage patterns on smartphones, males in their teens and twenties still dedicate a substantial amount of time—about 30 minutes per day—to video viewing.
Overall, both men and women tend to spend more time watching videos on PCs and smartphones as they get younger. While the proportion of video viewing on smartphones is currently low, as this generation with such viewing habits gradually ages, online video usage is likely to expand further.
Differences in viewing time also emerged across video services by gender and age. YouTube users showed longer viewing times among younger users regardless of gender, with males in their teens and twenties averaging 58.3 minutes per day on PCs.
Broadcaster catch-up services like TVer and GYAO! are characterized by relatively longer viewing times among women. For GYAO! PC users, viewing time was 38.4 minutes for women in their teens and 20s, and 34 minutes for women in their 50s and 60s, showing nearly equal usage.For TVer users on PCs, women in their teens and 20s averaged 17.8 minutes, while women in their 50s and 60s averaged 28.8 minutes, showing that older women spent more time watching. This seems to reflect the distinct characteristics of each service.
Focus on TV as a Device for Online Video Viewing
Log aggregation results show that overall, smartphone users still spend relatively limited time using video services.
To encourage more people to watch videos on smartphones, it's necessary to carefully overcome each hurdle. This includes not only environmental factors like data usage but also improving affinity for communication-focused devices through short-form content suited to smartphones, small-screen optimization, social media integration, and fostering viewing habits. On the other hand, we discovered that men in their teens and twenties represent a "new audience" well-adapted to smartphones.
It's clear that PCs hold a relative advantage over smartphones for video viewing. Comparing only video service users, the average daily viewing time shows a gap of more than double, revealing that people tend to watch longer-form video content more leisurely on PCs. This is likely due to factors like the larger screen size compared to smartphones, relatively lower concerns about data costs, and the ability to watch comfortably in one's own room.
Thus, it's important to recognize that even for the same video service, viewers' attitudes and desired content may differ depending on the viewing device.
On the other hand, careful consideration is needed regarding whether PCs will remain the sole device meeting household video content viewing needs. While PC penetration stands at 79.1% in households with two or more people, it has been stagnant in recent years (according to the Cabinet Office's "Consumer Trends Survey 2016").
As the demographic accustomed to watching online videos on smartphones begins to desire "viewing online videos on a larger screen," the trend of the television set—the largest screen in the home—gaining attention as a device for watching online videos is likely to intensify.
After all, the TV in the living room is, above all, a dedicated video viewing device. It offers higher picture and sound quality, and the viewing environment should be better than that of a PC. While TV viewing is primarily for broadcasts, when consumers begin to recognize the TV as another internet device, a serious competition for viewing time, distinct from that of smartphones, may begin in earnest.
While the current internet connectivity rate for TV sets or TV-connected devices stands at 26.9% (May 2016, d-campX; base population = TV set owners), which is still not particularly high, future trends warrant attention.
[Survey Overview]
● Data Source
Intage i-SSP Panel Log Data (Nationwide, ages 15-69, male/female)
● Devices and Valid Respondents (using weight-back adjusted data)
【PC】n=66,583 ※ Weighting values use Intage's [PC Population]
【Smartphone】n=71,797 ※ Weighting values based on INTAGE's [Mobile Internet Population]
●Log Data Used for Analysis
【PC】PC website access logs
【Smartphone】Browser access logs + App launch logs ※Only official apps were included.
●Survey Period
4 weeks from Monday, July 4, 2016 to Sunday, July 31, 2016
Was this article helpful?
Share this article
Newsletter registration is here
We select and publish important news every day
For inquiries about this article
Back Numbers

Author

Naota Ogura
Dentsu Inc.
Future Scenario Consulting Department, 4th Marketing Bureau
General Manager (GM)
After working in newspaper advertising, he served as an Account Executive for telecom companies and restaurant chains, planning advertising campaigns. Later, as a Media Planner, he joined the "Dentsu Inc. Media Innovation Lab," where he uncovered and disseminated insights on the latest media usage, from television to social media. In 2019, he established a specialized division supporting companies through future forecasting. Building on this expertise, he founded "Future Business Creation Research" in July 2021.Using proprietary methodologies, he supports corporate new business and product development. Furthermore, in November 2021, he launched the consumer research project "DENTSU DESIRE DESIGN," focusing on developing solutions that leverage the underlying psychology behind consumer behavior—namely, "desire." His publications include 'Information Media White Paper 2018,' 'Information Media White Paper 2019,' 'Future Thinking Concepts,' and 'What Will Future Consumers Desire?'

dentsu Media Innovation Lab
Dentsu Inc.
Launched in October 2017, leveraging Dentsu Inc.'s longstanding media and audience research expertise. Conducts research and disseminates insights to capture shifts in people's diverse information behaviors and understand the broader media landscape. Provides proposals and consulting on the communication approaches companies need within this context.