Note: This website was automatically translated, so some terms or nuances may not be completely accurate.
"2022 Internet Advertising Media Costs" Explained: What's the Breakdown of the Record-Breaking ¥3.0912 Trillion?
CARTA COMMUNICATIONS (CCI), D2C Inc., Dentsu Inc., Dentsu Digital Inc., and SEPTENI HOLDINGS CO.,LTD. jointly released the "2022 Detailed Analysis of Japan's Advertising Expenditures: Internet Advertising Media Costs" (hereinafter referred to as this survey). Kumiko Tanimoto of CCI explains the key points of this survey.

*News Release : "Detailed Analysis of Internet Advertising Media Costs in Japan's Advertising Expenditures for 2022"
<Table of Contents>
▼Major difference from 15 years ago: Internet advertising accounts for 43.5% of Japan's total advertising expenditure
▼By "Advertising Type": Search-linked advertising continues to increase its share
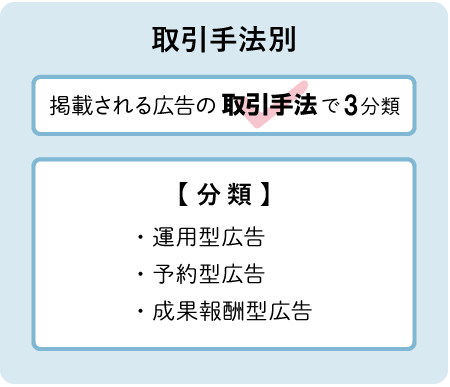
▼By Transaction Method: Programmatic Advertising Accounts for 85.4% of Total
▼Breakdown of Internet Advertising Expenditures by Advertising Type × Transaction Method
▼Topic ① Video Advertising Continues Significant Growth!
▼Topic ② Social Advertising Market Divided Between SNS and Video Sharing Platforms
▼Supplement: What is Advertising on E-commerce Platforms?
▼What Will Happen to Internet Advertising Expenditures in 2023?
Related Article:
Interview with CyberAgent President Susumu Fujita: The State of Advertising Today. Special Discussion on "2022 Japan Advertising Expenditures"
"2022 Japan Advertising Expenditures" Analysis: Exceeding ¥7 Trillion, the Highest in 15 Years. Internet Advertising Surpasses ¥3 Trillion
A Major Difference from 15 Years Ago: Internet Advertising Accounts for 43.5% of Japan's Total Advertising Spending
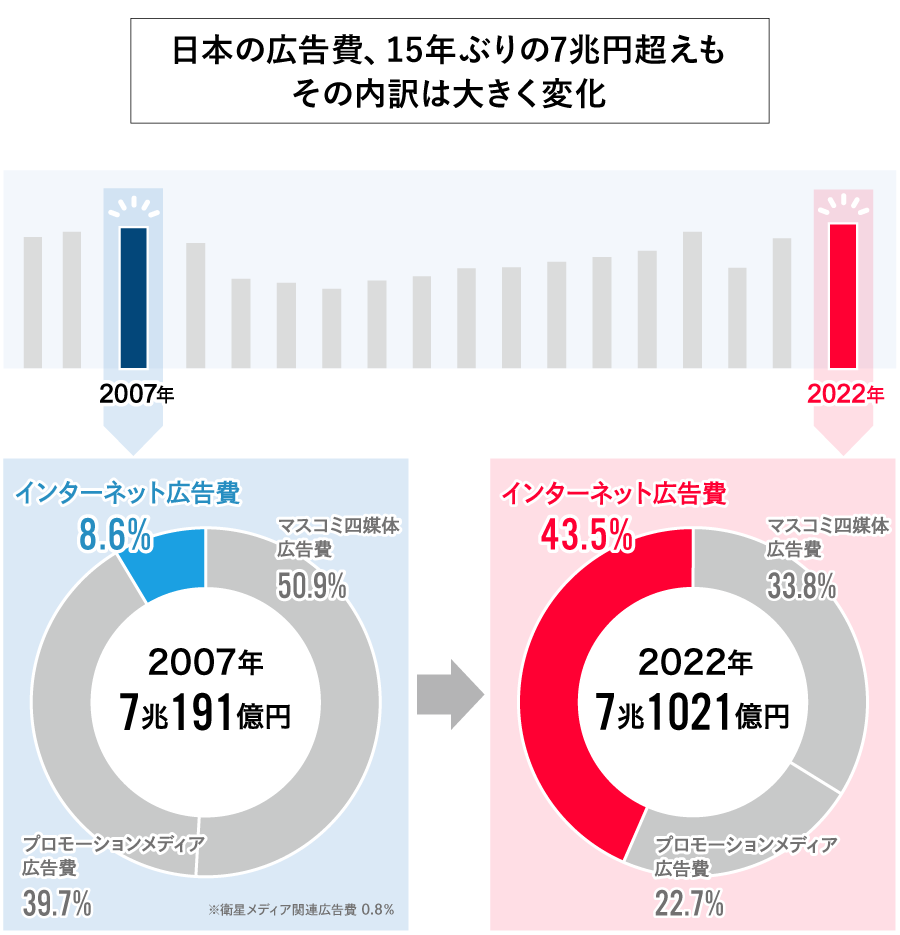
Japan's total advertising expenditure in 2022 exceeded 7 trillion yen for the first time since 2007, setting a new record high after 15 years. Driving this growth is the expansion of internet advertising spending.
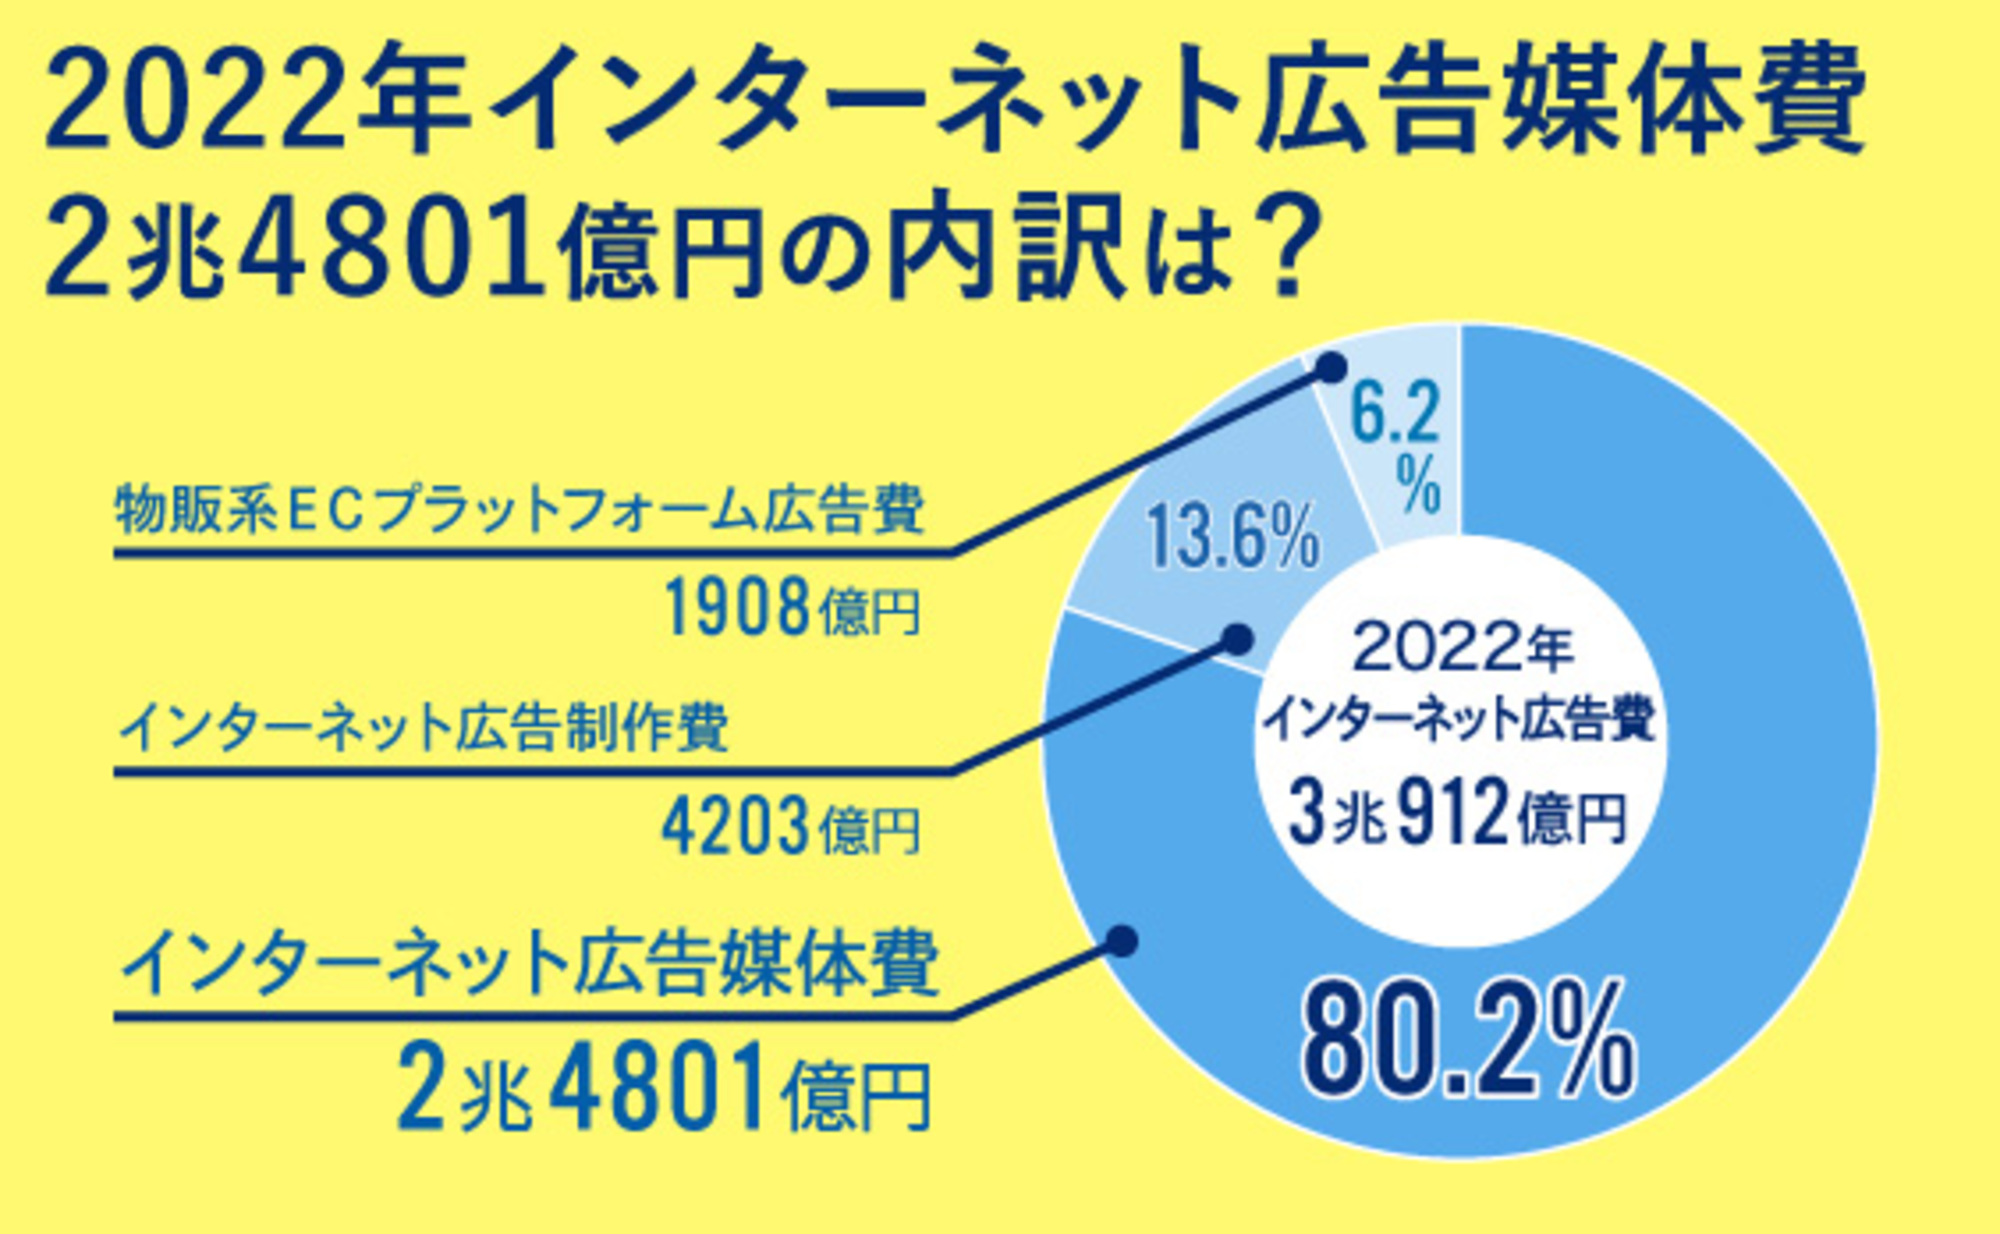
In 2007, the last time spending exceeded 7 trillion yen, internet advertising accounted for only 600.3 billion yen, or 8.6% of Japan's total advertising expenditure. However, 15 years later in 2022, internet advertising reached 3.0912 trillion yen, now representing 43.5% of Japan's total advertising expenditure.
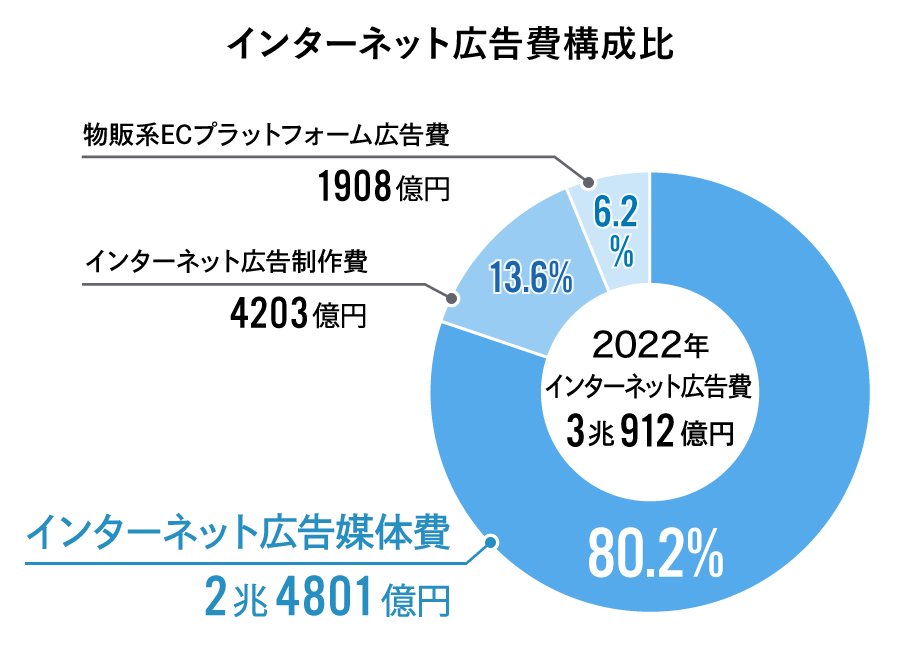
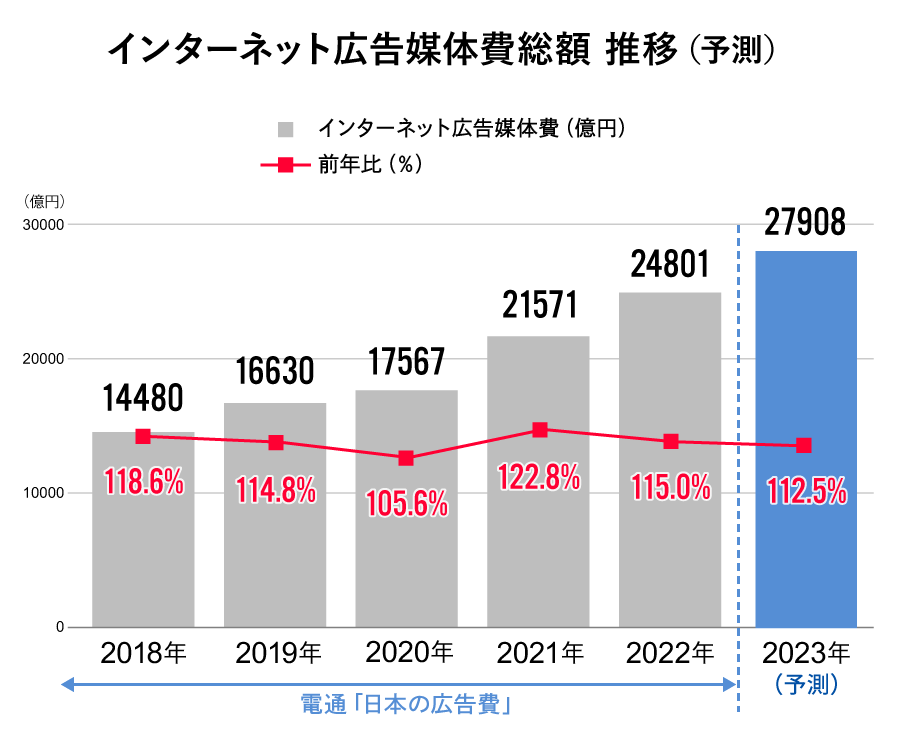
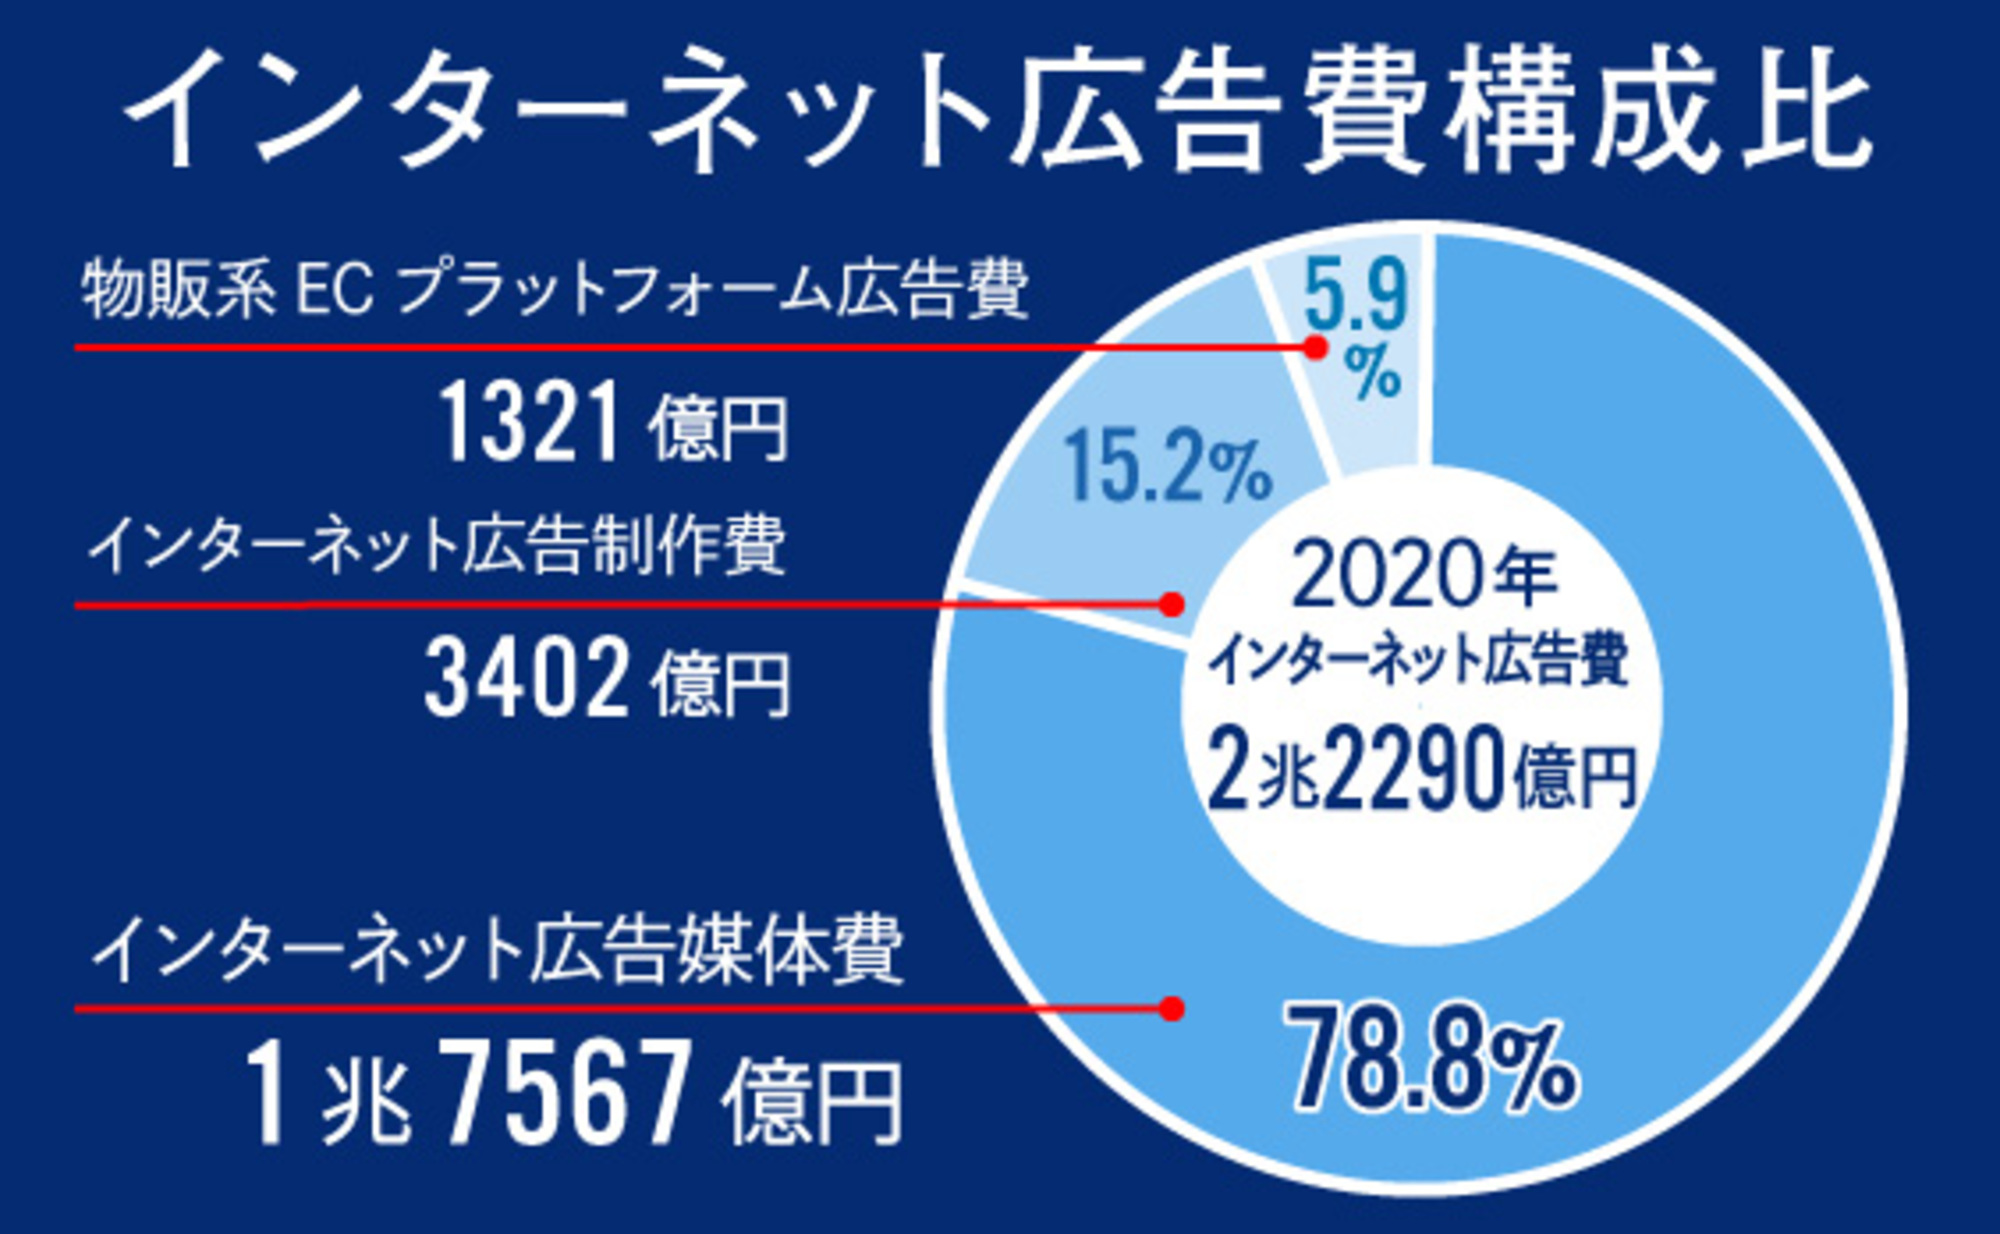
This article explains the breakdown of the ¥2.4801 trillion in "Internet Advertising Media Costs" – derived from total internet advertising expenditure after excluding "Internet Advertising Production Costs" and "Product Sales-Oriented E-Commerce Platform Advertising Costs".
By "Advertising Type," the share of search-linked advertising continues to increase
First, let's examine the breakdown of Internet advertising media costs by "advertising type." Advertising types are classified into the following five categories.

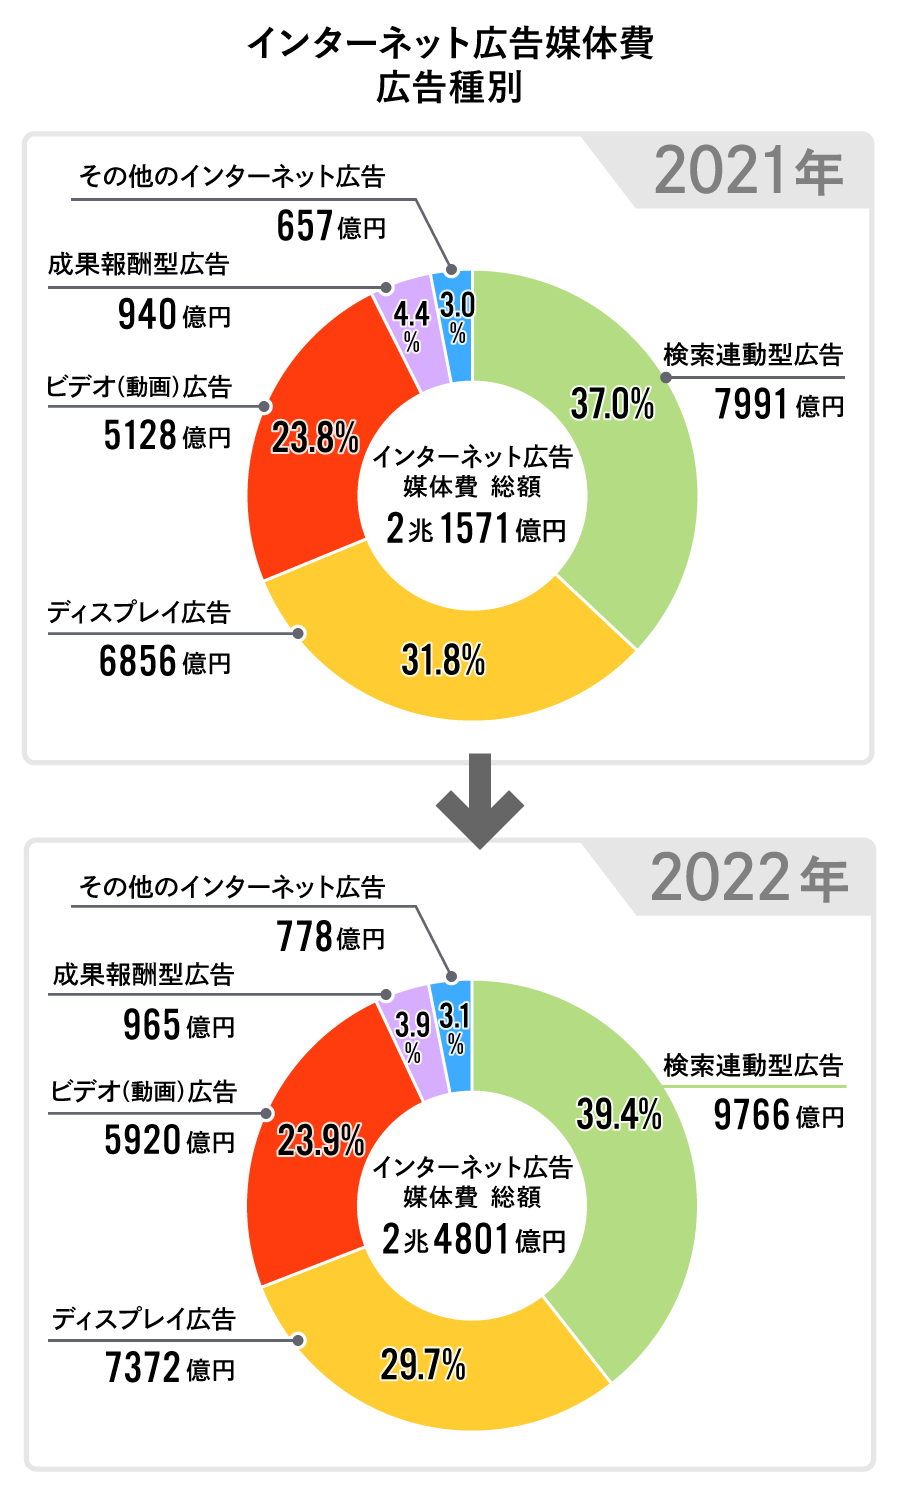
A key point to note in the "advertising type" breakdown is the growth rate of "search-linked advertising." Search-linked advertising refers to ads displayed on search engine results pages based on specific keywords entered into search engines, primarily search sites. This includes what are commonly known as listing ads.
Since detailed analysis of internet advertising media spending began in 2017, search-linked advertising has consistently shown year-over-year growth, driving internet advertising media spending. In 2022, it reached ¥976.6 billion, a 122.2% increase year-over-year, with its share growing to 39.4%, recording a higher growth rate than in previous years.
Compared to the past two years heavily impacted by the COVID-19 pandemic, increased willingness to go out due to relaxed restrictions and nationwide travel support measures likely contributed to the rising demand for search-linked advertising.
Next, banner-type "display ads" appearing on various websites totaled ¥737.2 billion, accounting for 29.7% of the total.
Video advertising reached ¥592 billion, a 115.4% increase year-on-year, accounting for 23.9% of the total. Video advertising refers to advertisements in video file format (visuals and audio).
While growth appears slightly moderated compared to the previous year's rate (132.8%), this remains a steadily expanding sector, as evidenced by the sharp rise in "TV Media-Related Video Advertising" (※), which surged 140.6% year-on-year to ¥35 billion.
※TV media-related video advertising = Video advertising on TV program video platforms primarily operated by TV media companies, such as TVer and ABEMA.
We will delve into video advertising in more detail later.
By transaction method, programmatic advertising accounts for 85.4% of the total
Next, let's break down internet advertising media spending by "transaction method."
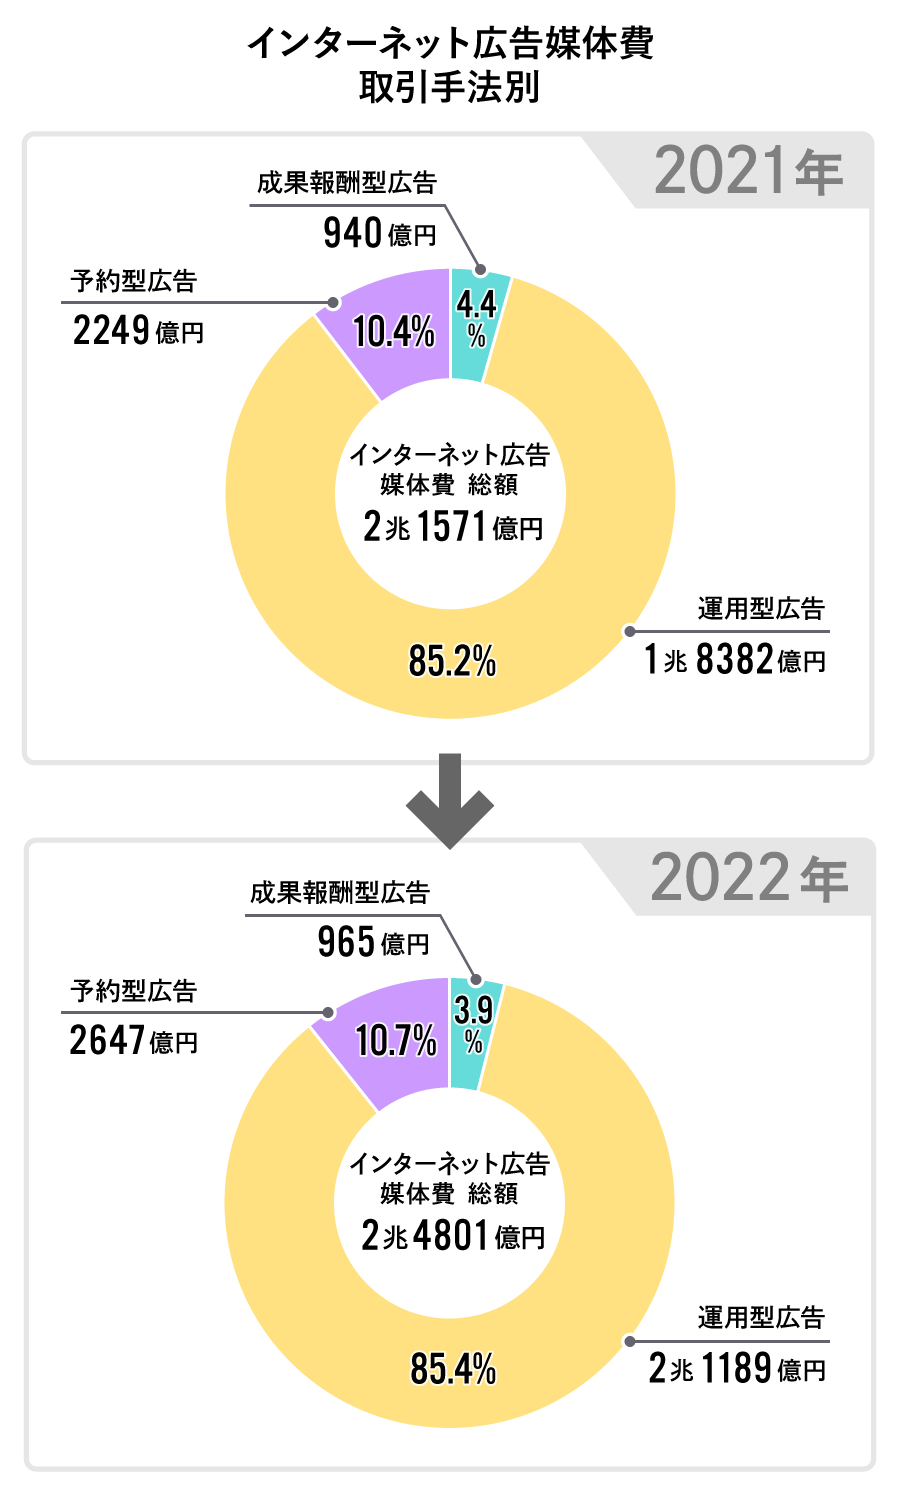
When breaking down internet advertising media costs by transaction method, programmatic advertising dominates. In 2022, it reached ¥2.1189 trillion, a 115.3% increase from the previous year, surpassing ¥2 trillion for the first time since estimates began. Programmatic advertising constitutes 85.4% of internet advertising media costs.
Performance-based advertising refers to ads traded via "auction-based methods" through platforms such as search-linked ads, video-sharing sites, SNS, and ad networks.
Outside of programmatic, "reserved advertising"—transacted at a "fixed price (non-auction)" as specific non-programmatic ads or tie-up ads—reached ¥264.7 billion, a 117.7% increase year-on-year.
Performance-based advertising, where media and users are compensated based on actions taken after viewing the ad, reached ¥96.5 billion, a 2.7% increase year-on-year.
Breakdown of Internet Advertising Expenditures by "Ad Type × Transaction Method"
We've examined the breakdown by advertising type and transaction method so far. Combining these reveals the actual state of internet advertising media spending.
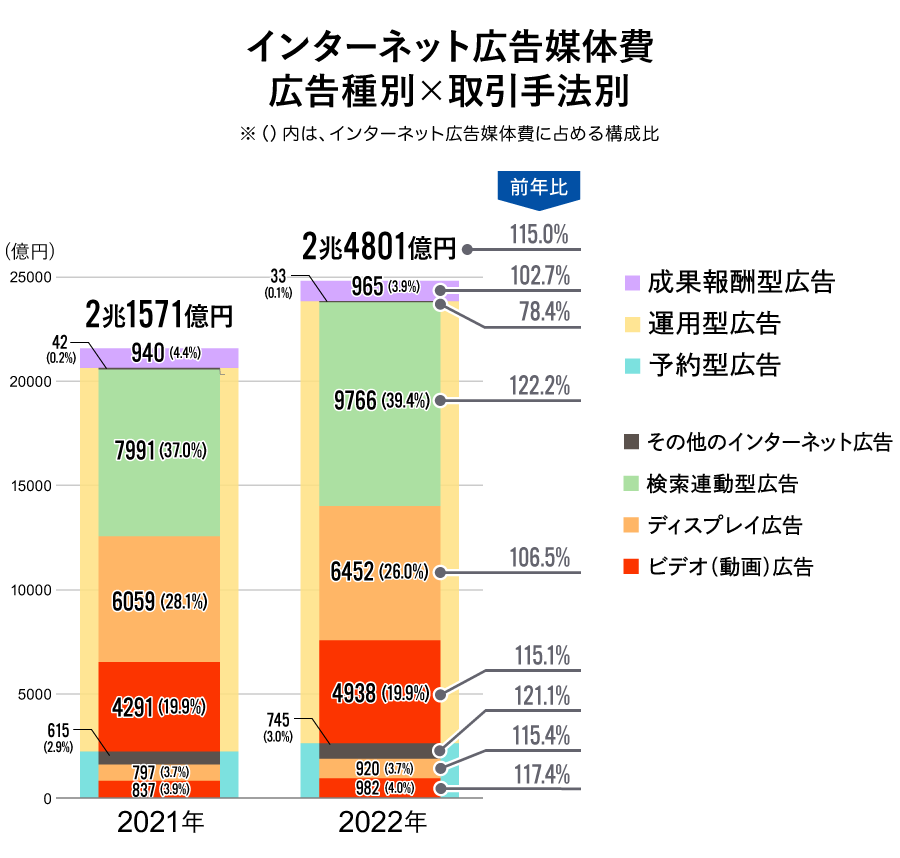
"Search-linked advertising" under "Operational" accounted for 39.4% of total internet advertising media spending, maintaining its position as the largest share, consistent with previous years.
Next were "Display Advertising" (26.0%), which displays text or images in ad spaces on websites and SNS, and "Video Advertising" (19.9%).
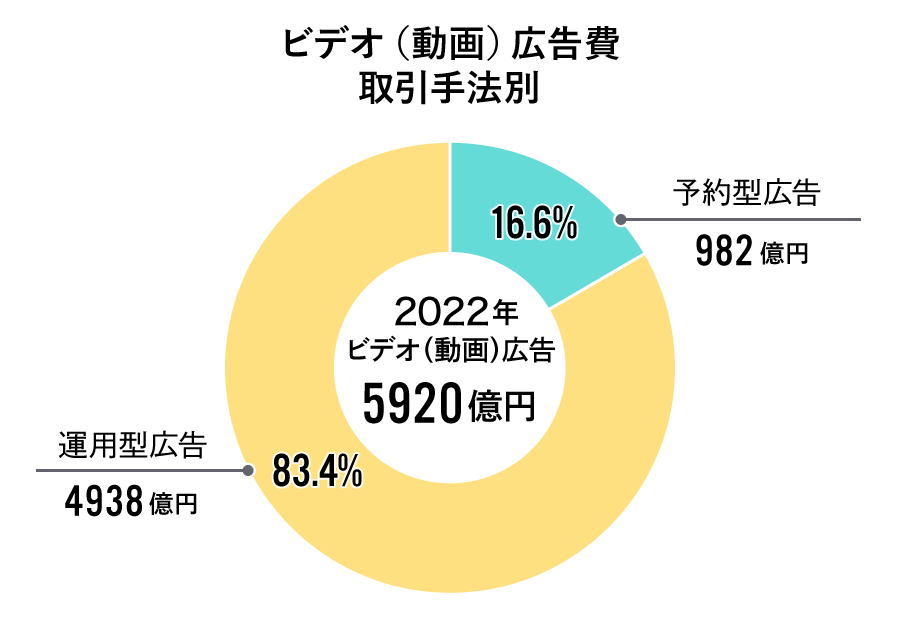
Topic ① Video advertising continues to grow significantly!
Video advertising saw growth in both "reserved-type" (117.4% year-on-year) and "programmatic" (115.1% year-on-year). Programmatic advertising accounted for 83.4% of this category.
 Notable points for video advertising in 2022 include
- Advertising on video-sharing platforms and short-form video platforms saw significant growth.
- and the surge in users on TV program video platforms triggered by major sporting events, which consequently boosted related advertising.
The pandemic-driven stay-at-home trend accelerated video viewing adoption across a wide age range.
Regarding the latter, habits are emerging not only for so-called catch-up streaming but also for watching live broadcasts online in real time, reaffirming their value as advertising platforms. It's also noteworthy that many commercially available TV sets are becoming "connected TVs," increasing the audience for "watching internet videos on TV sets."
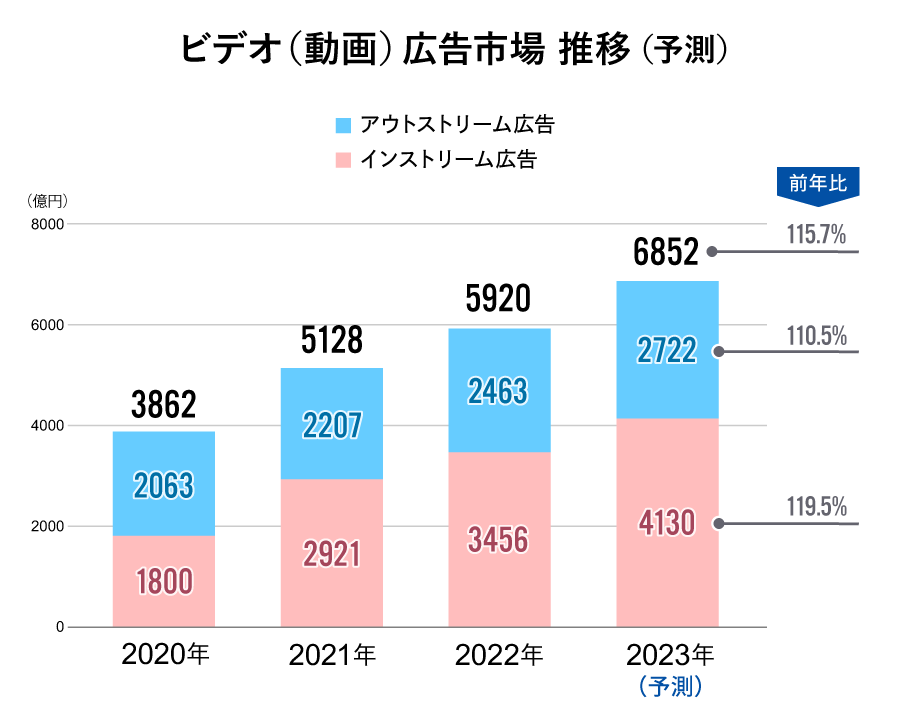
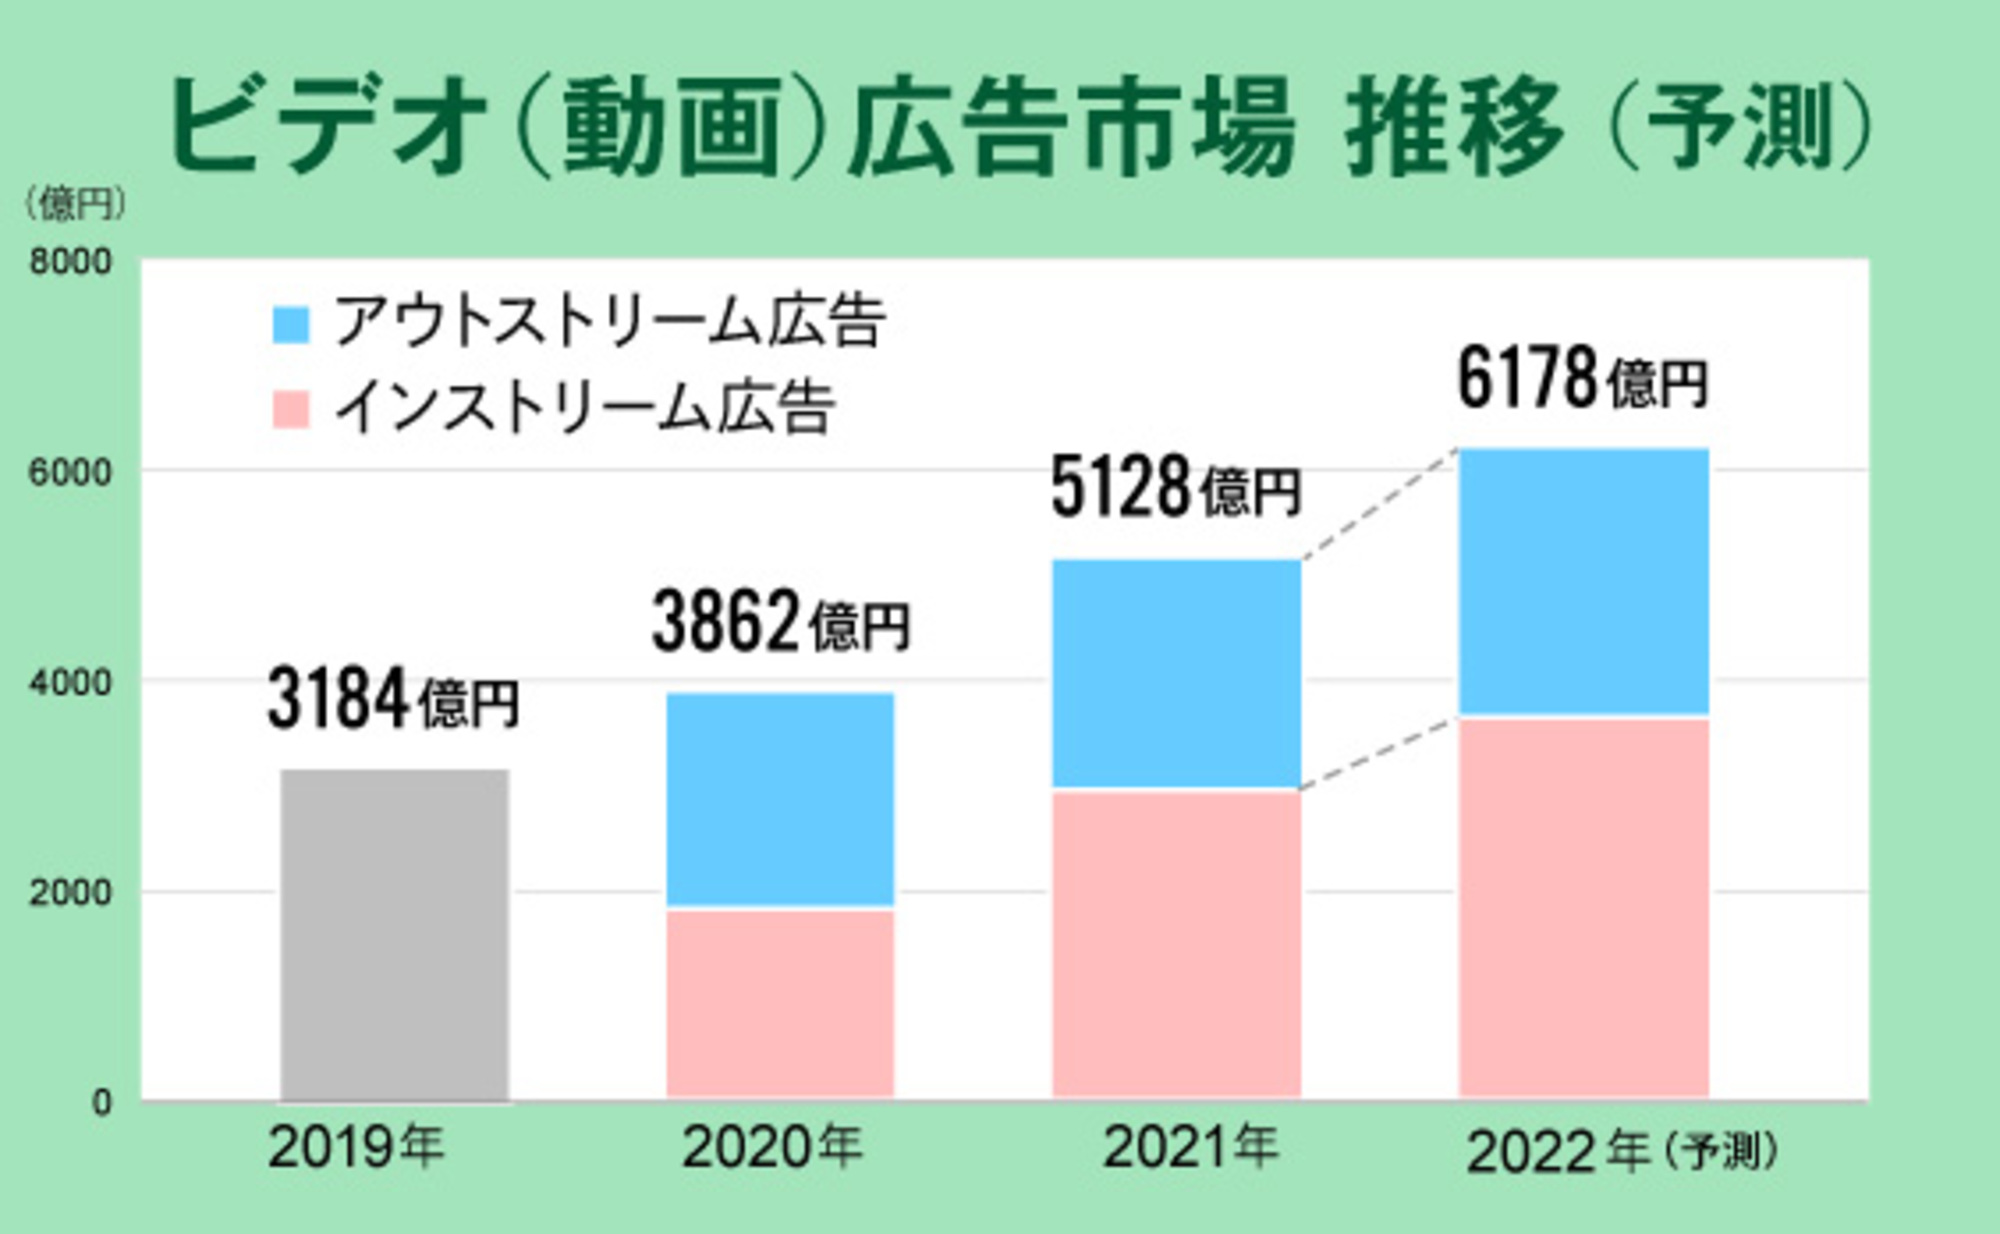
Video advertising is broadly categorized into "in-stream ads" and "out-stream ads."
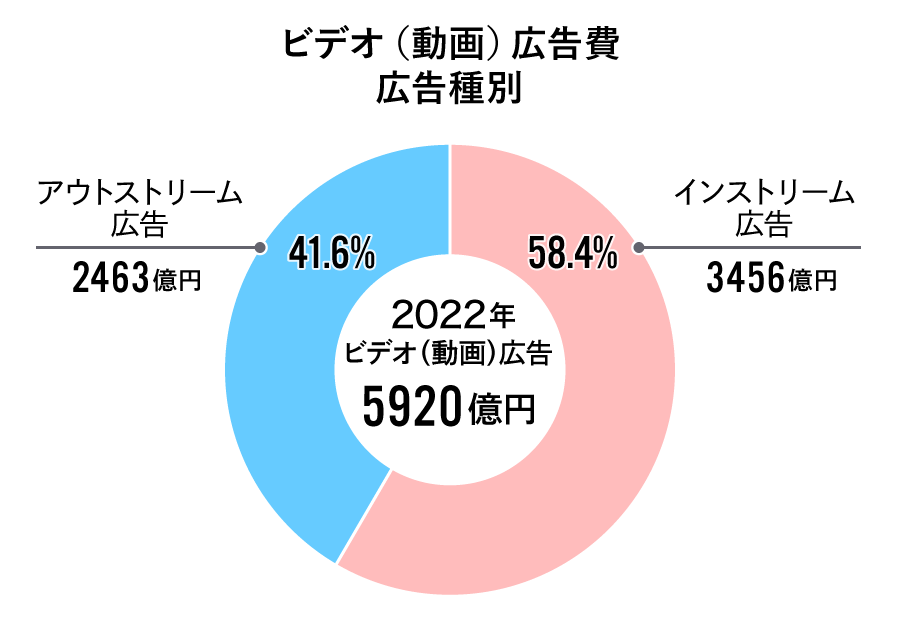
In-stream ads are video ads inserted before, after, or within video content, reaching ¥345.6 billion (58.4% share) in 2022.
On the other hand, "out-stream ads," which are video ads displayed in ad slots or within article content, reached 246.3 billion yen (41.6% of the total).
This trend appears to have been driven by the rise of video-sharing platforms, coupled with the expansion of user bases for television-based media.
While out-stream ads previously held a larger share, in-stream ad spending surpassed it in 2021 and has shown a higher growth rate. Significant future growth is anticipated.
Topic ② Social Advertising Market Divided Between SNS and Video Sharing
Social advertising, which runs on social media services, reached ¥859.5 billion, a 112.5% increase year-on-year, accounting for 34.7% of total internet advertising media spending. 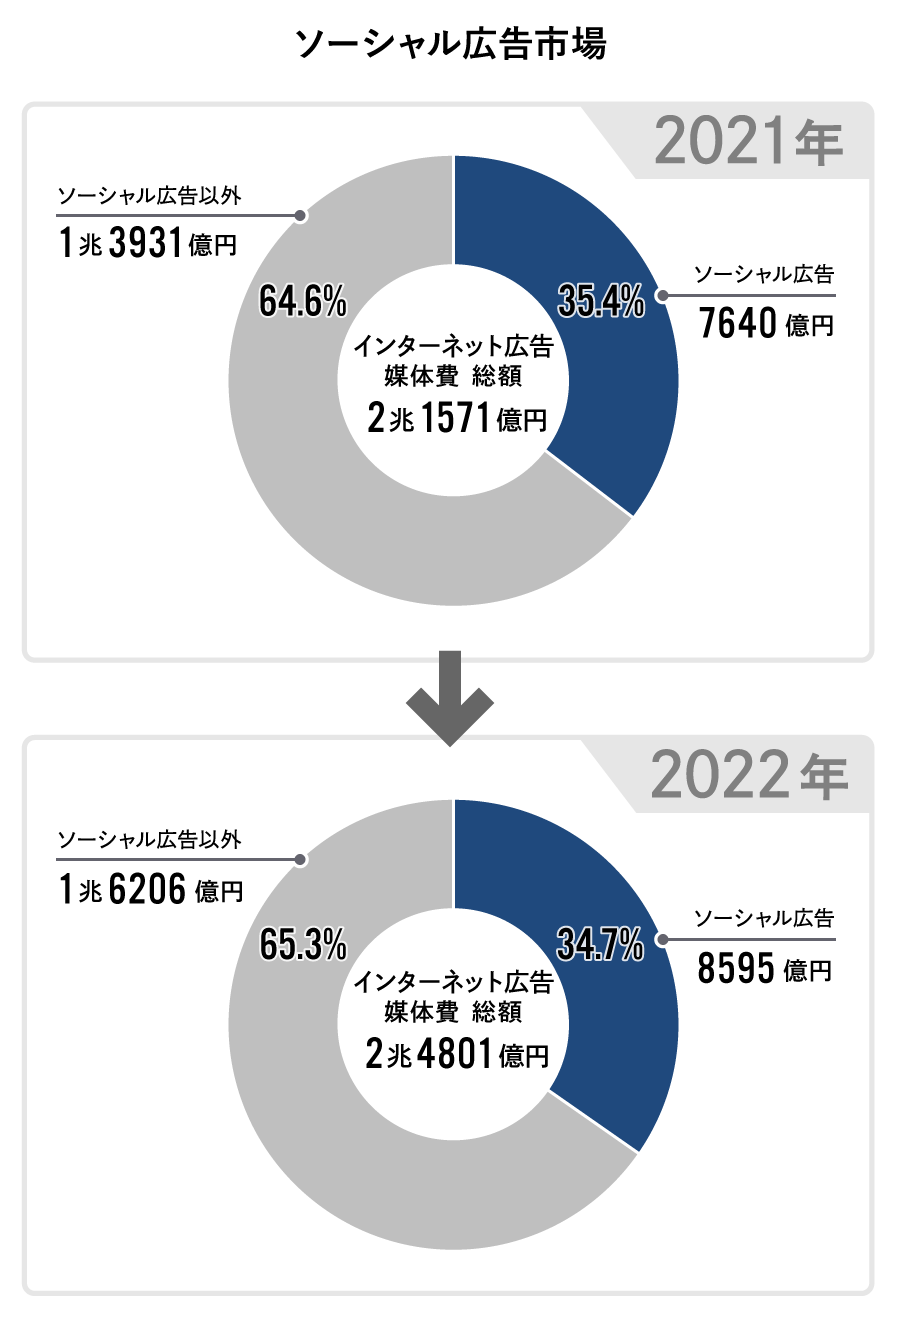 While growth was more moderate compared to the previous year's 134.3% growth rate driven by the pandemic, it continues to expand steadily with double-digit growth. However, the share of social advertising decreased slightly as non-social advertising grew by 116.3% year-on-year.
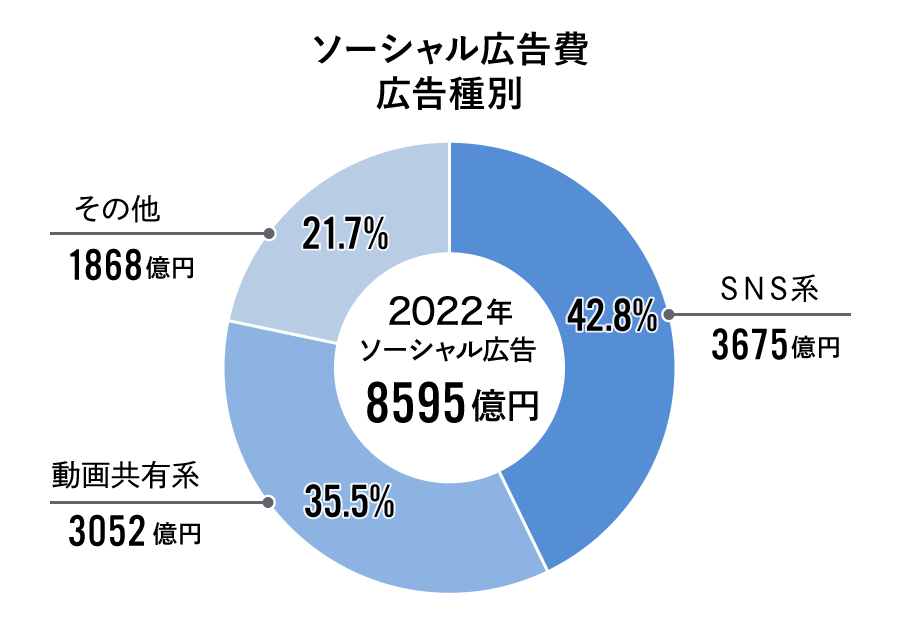
Our detailed analysis categorizes social media into the three groups shown in the figure above.
These are "Video Sharing Platforms" (referring to user-generated video sharing platforms, including short-form videos), "SNS Platforms" (referring to SNS platforms other than video sharing platforms), and "Others" (referring to blogs, electronic bulletin boards, etc.).
Under this classification, SNS platforms accounted for the largest share at ¥367.5 billion (42.8%), followed by video sharing platforms at ¥305.2 billion (35.5%). Both showed growth rates exceeding 116% year-on-year.
Note: What is e-commerce platform advertising?
Although not included in this estimation of "Internet Advertising Media Expenditures," the growth of "Product-Selling E-Commerce Platform Advertising" is noteworthy.
In "Japan's Advertising Expenditures," e-commerce platforms selling goods such as home appliances, sundries, books, clothing, and office supplies are referred to as "retail e-commerce platforms."
The advertising expenditure invested within these platforms by businesses "operating stores" on them is defined as "merchandise-based e-commerce platform advertising expenditure."
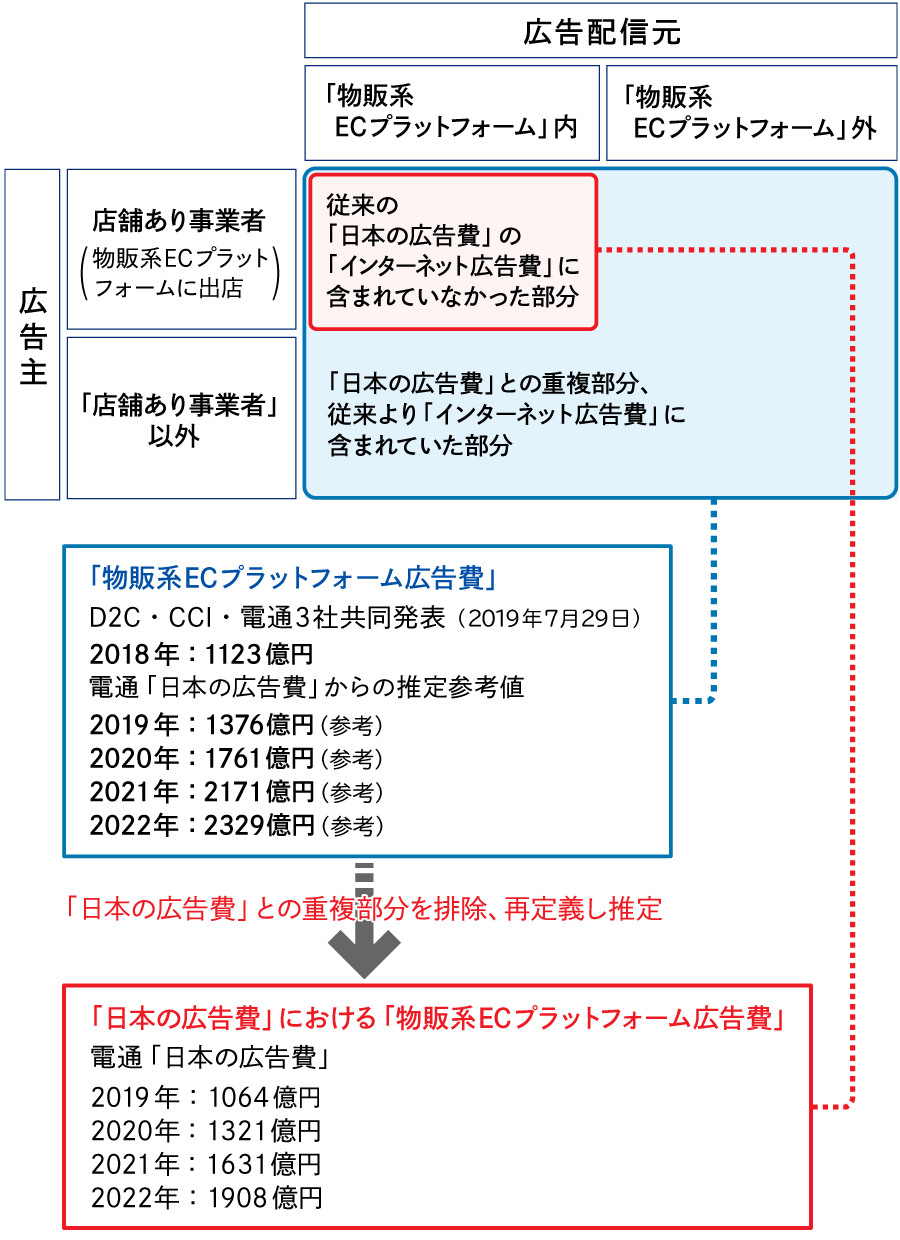
This reached ¥190.8 billion, a 17% increase year-on-year, continuing its steady growth since 2020. This growth stems from increased consumer e-commerce usage due to more time spent at home during the pandemic. This trend is likely to persist even after restrictions on going out are eased.
What will happen to internet advertising spending in 2023?
Internet advertising media spending is projected to continue growing steadily in 2023, expanding to ¥2.7908 trillion, a 112.5% increase year-on-year.
The area to watch is undoubtedly video advertising. In 2023, the video advertising market is projected to grow at a higher rate than overall internet advertising media spending, expanding to ¥685.2 billion, approaching ¥700 billion. Within this, in-stream advertising is expected to reach ¥413 billion, a 119.5% increase year-on-year.
The growth of video advertising is significantly influenced by the expansion of video-sharing media.
While subscription models like monthly fees were the norm for video-sharing platforms, examples are emerging where platforms offer low-cost or free plans by having users watch ads. As user numbers continue to grow, ad spending on these platforms is also expected to increase further.
Meanwhile, TV program video platforms, which traditionally relied on a free + advertising model, are seeing increased adoption due to major sporting events. The growing number of users accessing these platforms via connected TVs, which offer large-screen viewing, also points to an expected growth trend.
The free + ad model for subscription-based media is also being introduced for audio content, not just video. This is another area to watch closely for future developments.
While this discussion focused primarily on media costs, internet advertising production costs are also continuing to grow. Video advertising, especially since in-stream ads surpassed out-stream ads, is a particular area of interest.
Based on interviews with creative professionals, recent video ads increasingly involve producing rich visual content "for the web," similar to traditional TV commercials. Conversely, there's also a growing trend of using automated tools to create large volumes of short ads within limited budgets, then optimizing them through repeated A/B testing. This suggests a growing polarization in approaches.
Moving forward, we may see more cases where creative is designed primarily for video ads on video-sharing SNS and connected TV, then expanded to traditional mass media.
Finally, as the cookie-less world expands, analyzing paths and other aspects within internet advertising is becoming more difficult. Consequently, I believe there is a growing need to measure everything, including offline media (such as the four major mass media), using the same metrics.
According to CCI's 2022 report on internet advertising market trends, "integrated metrics for offline and digital media" ranked as the most sought-after content in analytics and reporting. This underscores the growing importance of a unified perspective across offline and digital channels.
Moving forward, I believe MMM (Marketing Mix Modeling) centered around internet metrics will gain traction. Advertising will increasingly demand planning that leverages all data and measurement across online and offline channels.

Was this article helpful?
Share this article
Newsletter registration is here
We select and publish important news every day
For inquiries about this article
Back Numbers
Author

Kumiko Tanimoto
CARTA COMMUNICATIONS, Inc.
Corporate Strategy Office
Joined Cyber Communications (now CARTA COMMUNICATIONS). After working as a dedicated agency sales representative, was seconded to Dentsu Inc. where he handled internet media. Upon returning, engaged in internal company duties before being seconded again to Dentsu Inc., where he worked in a department focused on business efficiency improvements (including RPA) and workplace reform. After returning, has been engaged in overall corporate planning duties since 2021.