Note: This website was automatically translated, so some terms or nuances may not be completely accurate.
"Over 60% Cashless" Reaches About 80%! Clarifying Usage Frequency Reveals the True State of Payment Practices
How can we further promote cashless usage in Japan?
The Dentsu Inc. Cashless Project, a project team at Dentsu Inc. providing marketing strategy support in the payment sector, conducted its sixth "Cashless Awareness Survey" online in November 2023 to clarify the circumstances surrounding cashless payments and the challenges in promoting their adoption. ( Survey overview here ).
This survey defined cashless usage more strictly than the previous 2022 survey. By quantifying cashless usage frequency, we aimed to understand the reality of those we call "Full-fledged Cashless Users."
The "True Cashless Adopters" segment is defined as those who use cashless payment for over 60% of their transactions at locations accepting cashless options.
Japan's cashless ratio stood at around 40% at the time of the survey. To determine what Japan must resolve to become a cashless advanced nation, we examine their actual behavior and explore the core challenges.
<Table of Contents>
▼ Clarifying Cashless Usage Patterns with 6 Categories Based on "Usage Frequency"
▼ Over 78% of the Population Use Cashless for 60% or More of Daily Transactions
▼ Over 60% of Hardcore Cashless Users Increased Their Cashless Usage Frequency in the Past Year
▼ Higher Cashless Usage Frequency Correlates with Higher Household Income
Clarifying cashless usage patterns through 6 classifications based on "usage frequency"
This survey quantifies cashless payment frequency, refining the previous survey's five categories into six. The breakdown of the six categories is shown below.
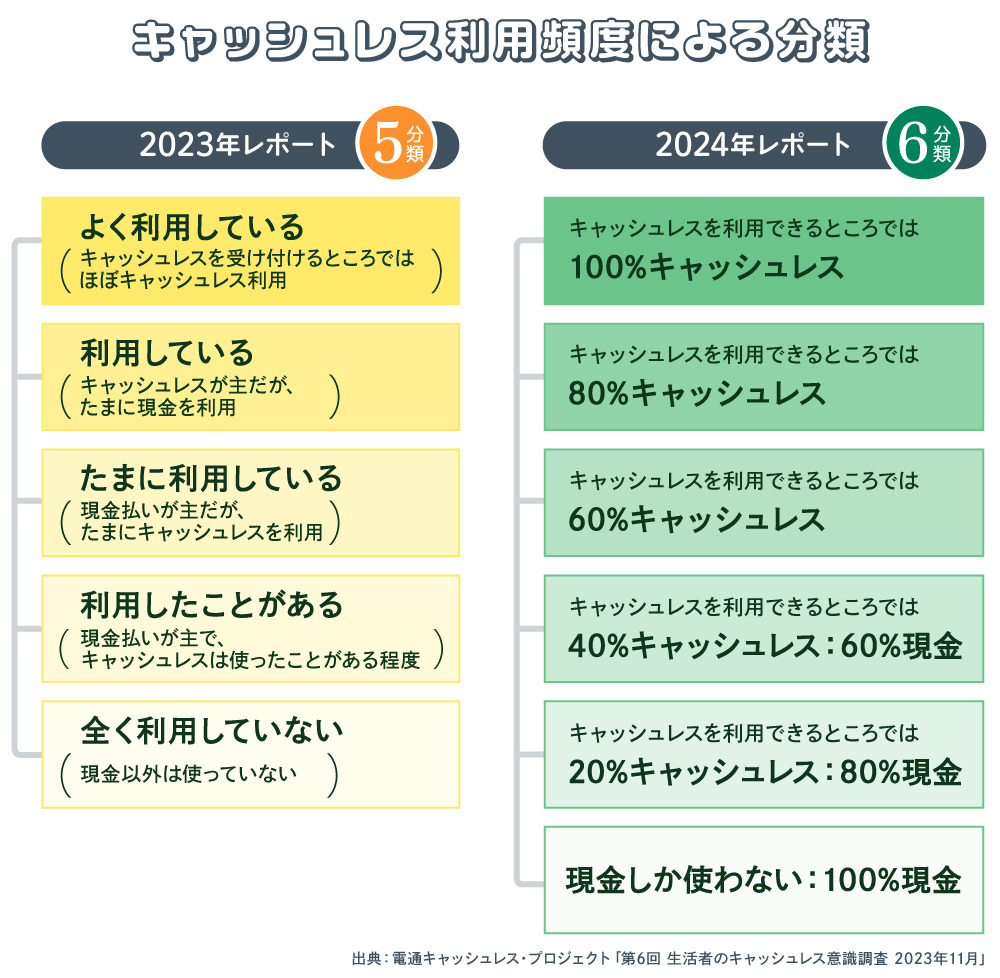
Quantifying frequency eliminated the subjective expressions "frequently (used)" and "occasionally (used)" used in the previous survey's classification, which could introduce error. We believed this would clearly show the percentage of people who are 100% cashless.
Simultaneously, we defined the segment where cashless payments exceed 60% as "Full Cashless Users" and those using cash more frequently (under 40% cashless) as "Cash Users." This quantitative distinction enables us to verify actual usage patterns.
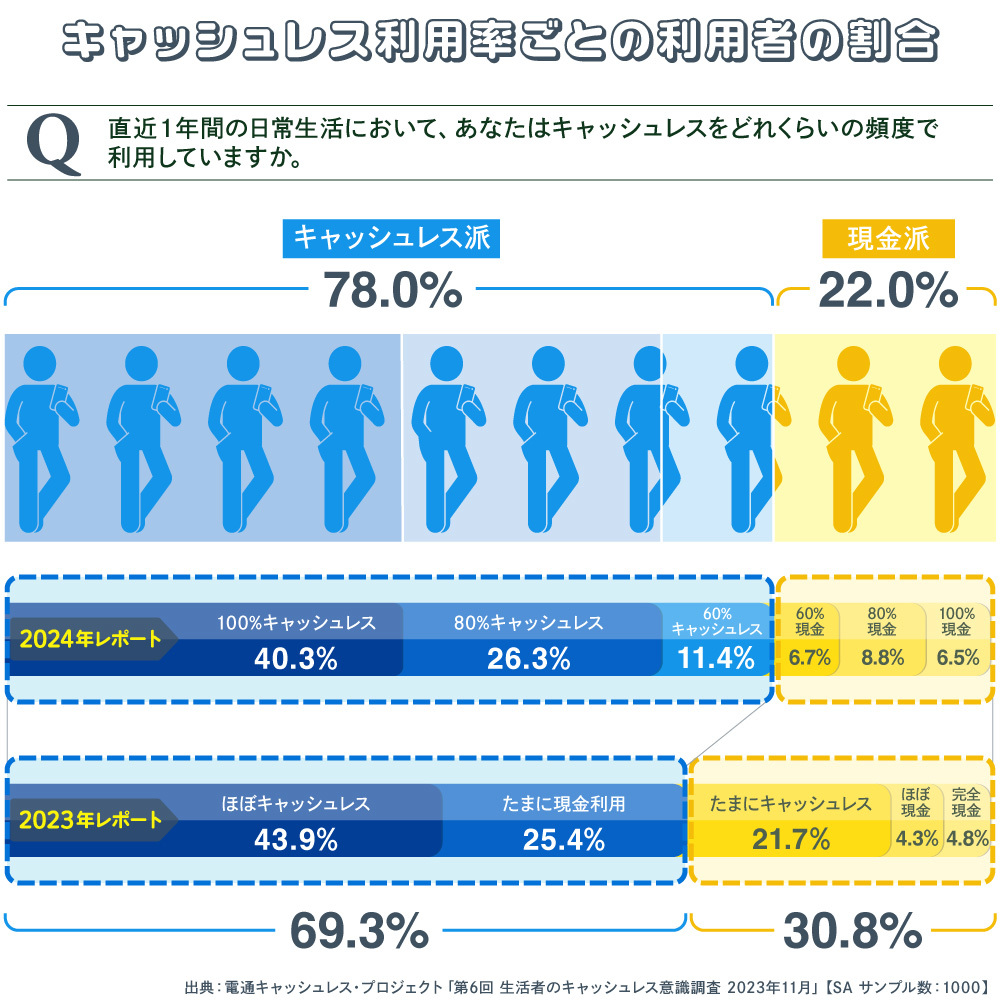
In daily life, 78% of the population uses cashless payments 60% or more of the time
The six-category breakdown revealed that 40.3% of respondents use "100% cashless" wherever possible—equivalent to 4 out of 10 Japanese adults. Next were "80% cashless" at 26.3% and "60% cashless" at 11.4%. Combined, these true cashless adopters total 78.0%.
In the previous survey, "nearly cashless" users were 43.9% and "occasional cash users" were 25.4%. The total cashless users then were 69.3%, showing an increase of about 9 percentage points.
Conversely, the cash-only group decreased from 30.8% in the previous survey to 22.0% this time. The breakdown of this survey's results was: "40% cashless (60% cash)" at 6.7%, "20% cashless (80% cash)" at 8.8%, and "cash only (100% cash)" at 6.5%.
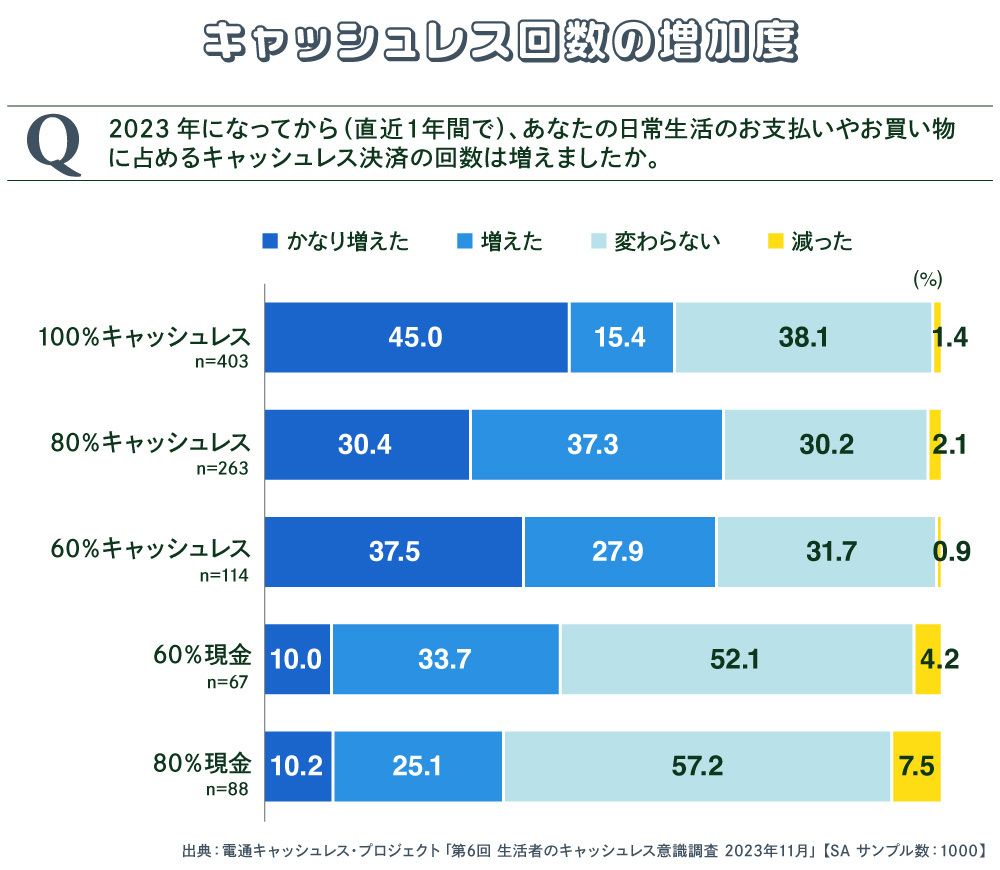
Over 60% of dedicated cashless users increased their cashless transaction frequency in the past year
When considering the promotion of cashless usage, what matters more than the population composition ratio of cashless users is whether the actual number of cashless payments has increased in real payment situations.
According to this survey, 34.2% responded "significantly increased," 25.3% "increased," 37.9% "remained unchanged," 1.1% "decreased," and 1.5% "significantly decreased" over the past year, with approximately 60% (59.5%) reporting an increase.
So, which segment saw the most increase in payment frequency? The highest combined rate for "significantly increased" and "increased" was among the "80% cashless" group at 67.7%. This was followed by "60% cashless" at 65.4% and "100% cashless" at 60.4%. The increase was most noticeable among the fully cashless group.
Conversely, the increase rate among cash users remains low. The increase rate for "40% cashless: 60% cash" was 43.7%, and for "20% cashless: 80% cash" it was 35.3%. The difference between the full cashless group and the cash group is particularly large in the number of respondents who answered "significantly increased." While only 10% of the cash group reported this, over 30% of the full cashless group did, with 45.0% of the "100% cashless" group answering "significantly increased."
This suggests a tendency for those with cashless payment ratios exceeding 60% to relatively increase their usage frequency.
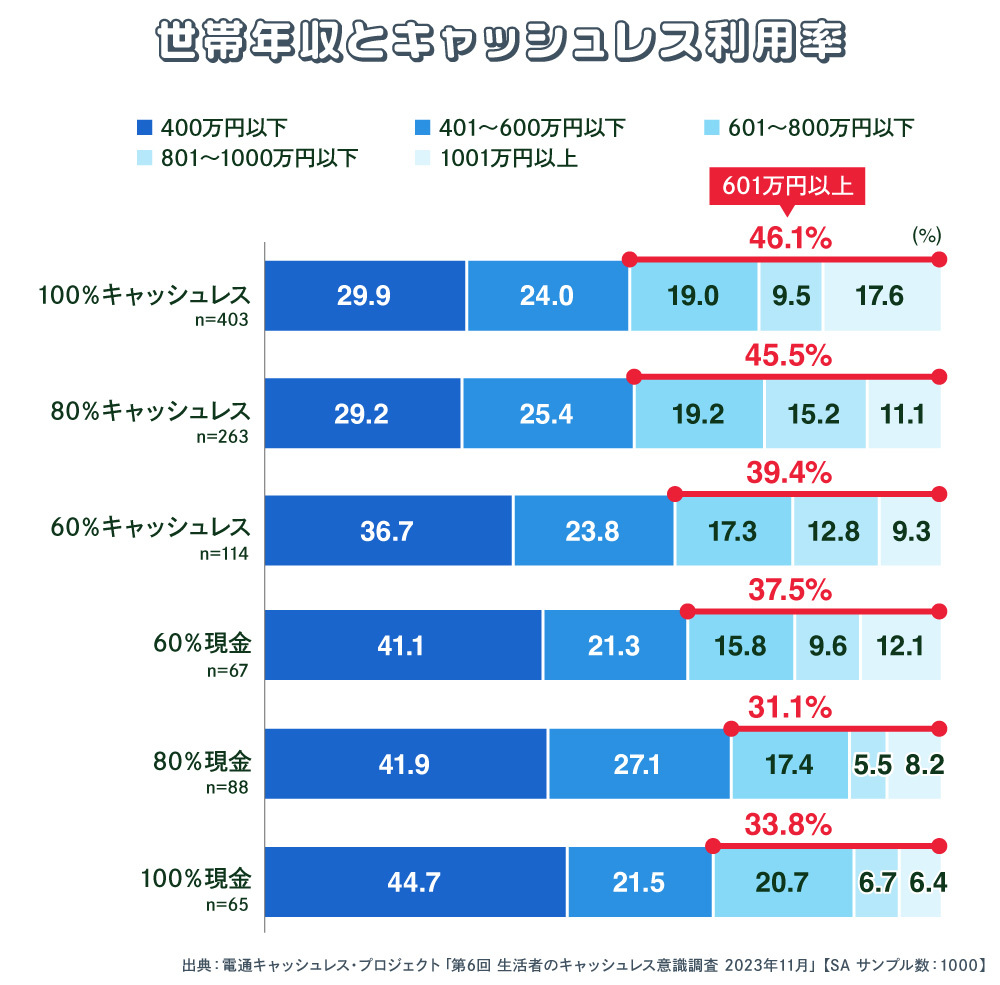
A characteristic of those with higher cashless usage frequency is higher household income.
What characteristics do full-fledged cashless users possess? Looking first at age groups, the common perception is that "100% cashless" users are more prevalent among younger generations and decrease with age.
Indeed, the survey results show that the highest proportion of "100% cashless" users was among those in their 20s (44.1%). However, the second-highest proportion was among those in their 50s (44.0%), with those in their 30s (43.1%) ranking third. Furthermore, the group with the lowest percentage of "100% cashless" users was not those in their 60s (39.0%), but those in their 40s (32.5%). This was surprising even to the author, who has been involved in these surveys.
Furthermore, while those who are full-fledged cashless users (60% or more cashless) were again most prevalent among those in their 20s (81%), there was little difference across age groups. Gender differences were most pronounced among younger age groups. For "100% cashless," 50% of men in their 20s were cashless compared to 38% of women, a 12-point gap. Among those in their 30s, men were 49% and women 37%, showing a similar gap. For those in their 40s and 60s, there appeared to be no gender difference.
Within this demographic landscape, household income revealed significant disparities. Among those earning ¥10 million or more annually, the highest proportion favored "100% cashless" (17.6%). "80% cashless" was 11.1%, "60% cashless" was 9.3%, and "60% cash" increased slightly to 12.1%. Conversely, "80% cash" was 8.2% and "100% cash" was 6.4%, showing a gradual decrease.
Even among those earning ¥6.01 million or more annually, the proportion of frequent cashless users tends to be higher. In other words, a correlation can be observed: the higher the frequency of cashless use, the higher the household income.
While the "occasional users" segment was key in last year's survey, these results from the current survey suggest that the core target for promoting cashless payments in Japan going forward should be the high-involvement cashless users with high usage frequency.
So, what are the savings, point awareness, and investment interests of each segment, including the high-engagement cashless group?
Next time, we will examine the relationship between cashless payments and investment/asset management, in addition to cashless usage by store type and business format, to explore hints for future cashless payment promotion.
[Survey Overview]
Title: 6th Survey on Cashless Awareness Among Consumers
Survey Method: Internet survey
Survey Period: November 17-20, 2023
Survey Area: Nationwide
Survey Participants: 1,000 men and women aged 20–69 (weighted based on population composition)
Survey Sponsor: Dentsu Inc., Dentsu Cashless Project
Survey Company: Rakuten Insight

Was this article helpful?
Share this article
Newsletter registration is here
We select and publish important news every day
For inquiries about this article
Author
Yoshitomi Sairyo
Dentsu Inc.
BX Creative Center, Experience Design Department
Senior Planning Director
Head of the Dentsu Cashless Project. Joined Dentsu Inc. after working at a U.S.-based consulting firm and a European investment bank. Engaged in new business development, marketing and brand strategy, and PR for clients in finance (banks, securities, insurance, etc.), telecommunications, automotive, beverages, toiletries, and pharmaceuticals. Contributions include "Corporate Reputation" (Advertising) and "CSR and Corporate Reputation" (Nikkei Branding). Certified Member of the Securities Analysts Association of Japan.

