Note: This website was automatically translated, so some terms or nuances may not be completely accurate.
As mobile payments become more integrated into daily life, how will Japan's cashless society change?
From plastic cards to mobile.
"The primary payment method has changed."
Results from our December 2024 cashless survey (survey overview available at here ).
The "Dentsu Inc. Cashless Project" conducts its annual "Cashless Awareness Survey of Consumers," now in its seventh year. This year's theme was "Understanding the Actual Use of Mobile Payments."
Structural changes are occurring in Japan's cashless payments, and mobile payments will become the mainstay going forward—
we examined: Are there changes in consumers' perceptions of cashless payments?
What payment method do cashless users utilize most frequently?
Is there a relationship between mobile payments and the use of financial services such as peer-to-peer transfers, investments, loans, and insurance?
These questions were posed and investigated.
Japan's cashless payments, long driven by cards, seem to be at a major turning point.
In "Cashless Insight 2025," Dentsu Inc.'s Saio Yoshitomi examines Japan's cashless payments from both the consumer and merchant perspectives across two parts.
<Table of Contents>
▼ Sharpening the Focus on Japan's Cashless Orientation
▼ Over 80% are cashless users. No sign of the rumored "age gap"
▼ The leading role in cashless payments shifts from cards to mobile
▼ Mobile payments are the most frequently used cashless payment method
▼ Mobile payment penetration has surged in just two years
▼ What payment providers expect as a new revenue source
▼ Boosting Customer Engagement with "Combined Use" Financial Services
Japan's Cashless Trend Becomes More Pronounced
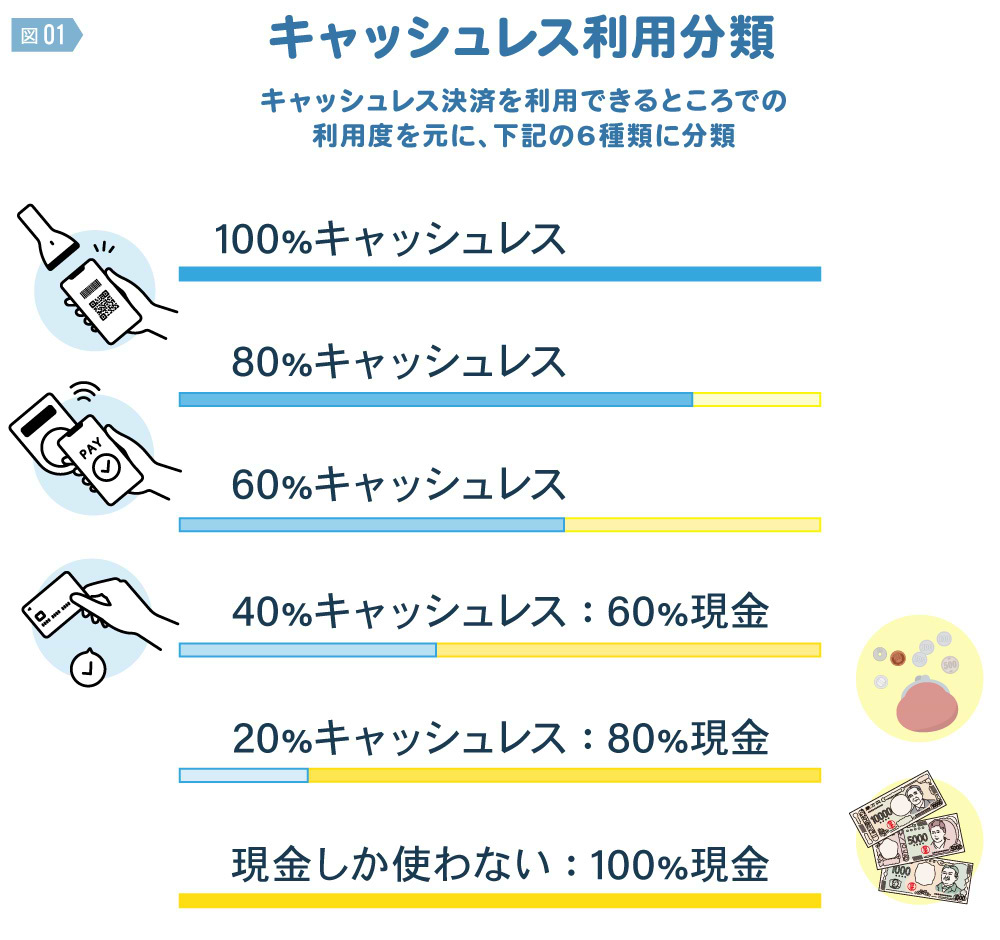
Japanese consumers' cashless orientation is strengthening. This survey revealed results supporting that perception. How often do people use cashless payments in their daily lives over the past year, in places where cashless payment is available?
Respondents were asked to choose from six categories: "100% cashless," "80% cashless: 20% cash," "60% cashless: 40% cash," "40% cashless: 60% cash," "20% cashless: 80% cash," and "Only cash: 100% cash."
These categories broadly divide users into cashless advocates and cash advocates. "100% cashless," "80% cashless," and "60% cashless" users are classified as cashless users. "40% cashless: 60% cash," "20% cashless: 80% cash," and "only uses cash: 100% cash" users can be considered cash users.
Cashless users exceed 80%. No sign of the rumored "age gap"
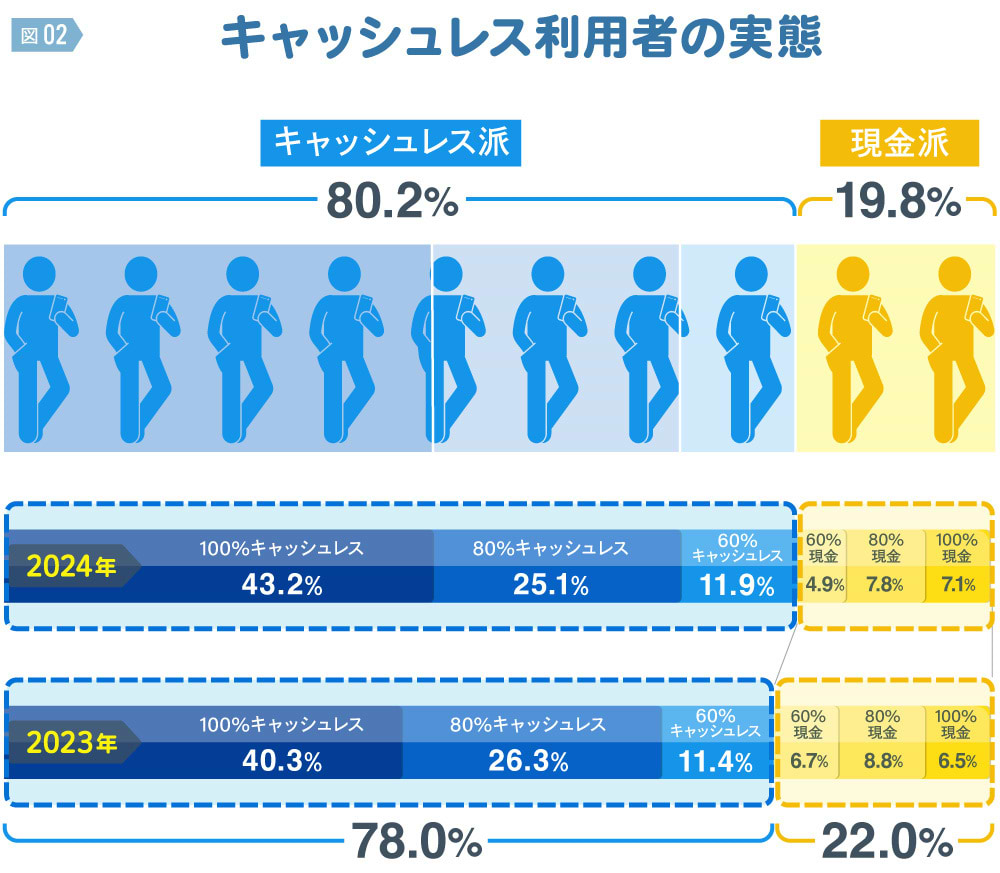
According to this survey, 80.2% of respondents use cashless payment methods for over half of their daily transactions, making them cashless users. The breakdown is: "100% cashless" at 43.2%, "80% cashless" at 25.1%, and "60% cashless" at 11.9%.
In the previous survey (November 2023), cashless users accounted for 78.0%. This represents an increase of 2.2 percentage points over the past year. With cashless users exceeding 80%, we can see a gradual shift in consumers' payment habits towards cashless usage.
What about the cash users? In this survey, they decreased from 22% last time to 19.8%, falling below 20%. It appears that some of the "60% cash" and "80% cash" users, who were previously cash users but also used cashless to some extent, are gradually shifting towards the cashless camp.
Incidentally, according to the Cashless Promotion Council*, Japan's cashless payment ratio (the percentage of daily spending made via cashless methods) was reported to be 39.3% as of 2023. Why is the cashless ratio so low, despite cashless users exceeding 80% and "100% cashless" users—who could be called fully cashless—surpassing 40%?
The reason is likely that many small and medium-sized stores still do not accept cashless payments. We plan to address this point in the second installment, "The Barriers to Cashless Adoption for Small and Medium-Sized Stores," focusing on the store side of accepting cashless payments.
※: Cashless Promotion Council " Cashless Roadmap 2024 " (December 2024)
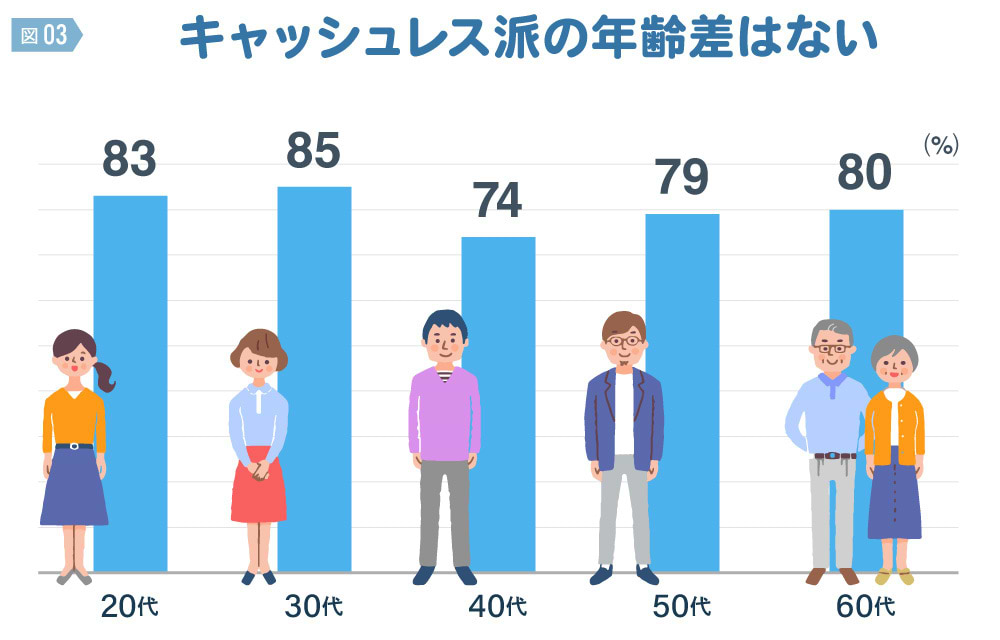
Additionally, there's an urban legend-like notion that "cashless payment usage decreases and cash users increase as age rises." However, this survey found that cashless users were 83% among those in their 20s, 85% in their 30s, 74% in their 40s, 79% in their 50s, and 80% in their 60s, showing little age-based disparity in cashless adoption.
The Main Role in Cashless Payments Shifts from Cards to Mobile
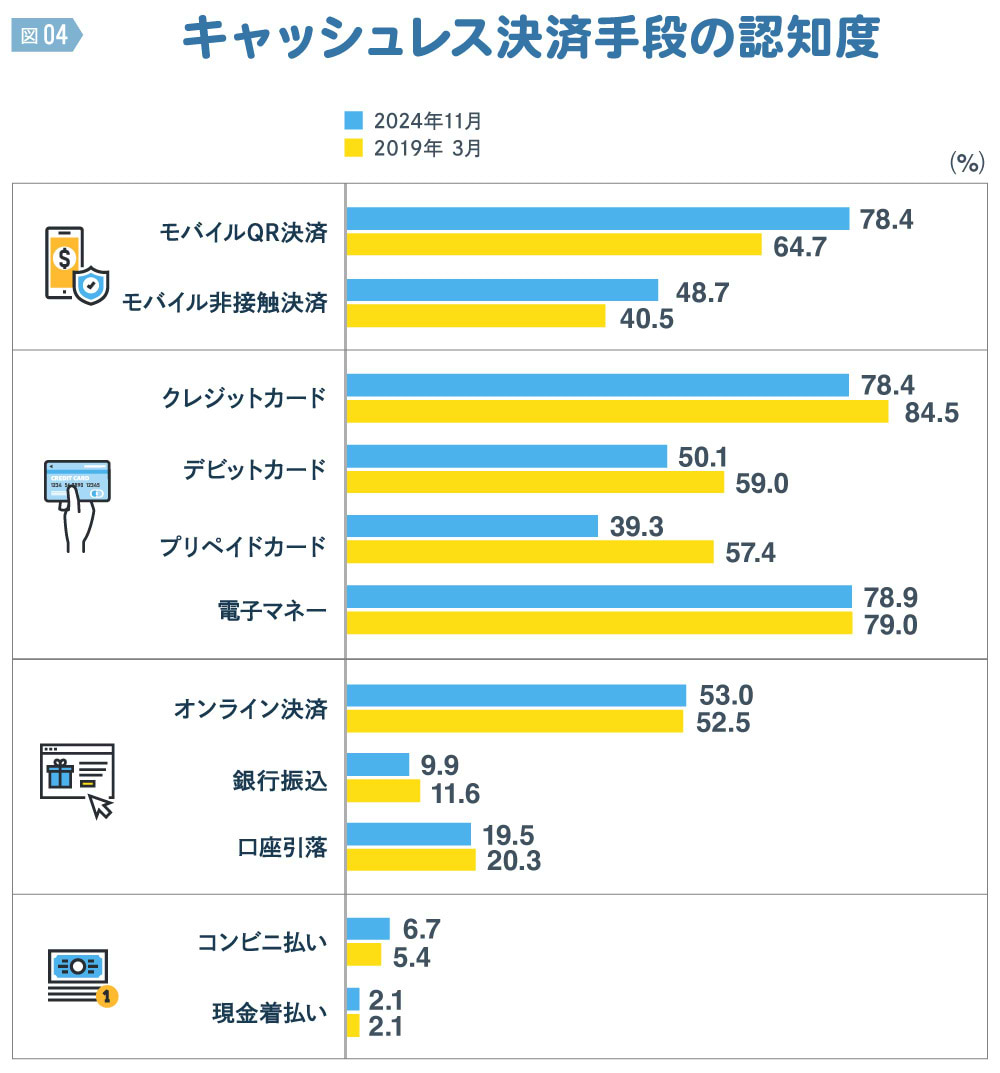
Chart 4 compares the results of the survey conducted five years ago in March 2019 with the December 2024 survey. It shows that only awareness of mobile payments has increased over the five-year period. Conversely, awareness of cards has declined. Awareness of online payments and cash payments has remained largely unchanged. Let's look at the specifics.
March 2019 was approximately six months after PayPay's launch in October 2018. At that time, awareness that mobile QR payments constituted cashless payments stood at 64.7%. Even then, this was undoubtedly an astonishing figure in terms of rapid awareness growth over such a short period.
A PayPay craze swept across Japan, with media outlets featuring cashless payments daily. By December 2024, awareness had increased by 13.7 points to 78.4%. Mobile QR payment recognition had risen to nearly the same level as credit cards and electronic money systems like transit cards (Suica, PASMO, etc.) and retail cards (WAON, nanaco, etc.) as cashless payment methods.
Furthermore, "mobile contactless payments"—where users simply tap their card or device on a dedicated terminal—grew by 8.2 percentage points from 40.5% in 2019 to 48.7%, ranking sixth in awareness. Over these five years, only mobile QR payments and mobile contactless payments saw significant growth. This likely reflects mobile payments gaining recognition as a cashless payment method.
Conversely, cards saw a significant decline in recognition rates. Credit cards dropped 6.1 percentage points from 84.5% in 2019 to 78.4%. Debit cards fell 8.9 points from 59.0% to 50.1%. Prepaid cards saw an even larger drop of 18.1 percentage points, falling from 57.4% to 39.3%. This may indicate that cards are no longer the primary method for cashless payments.
Mobile payments are now the most commonly used cashless payment method
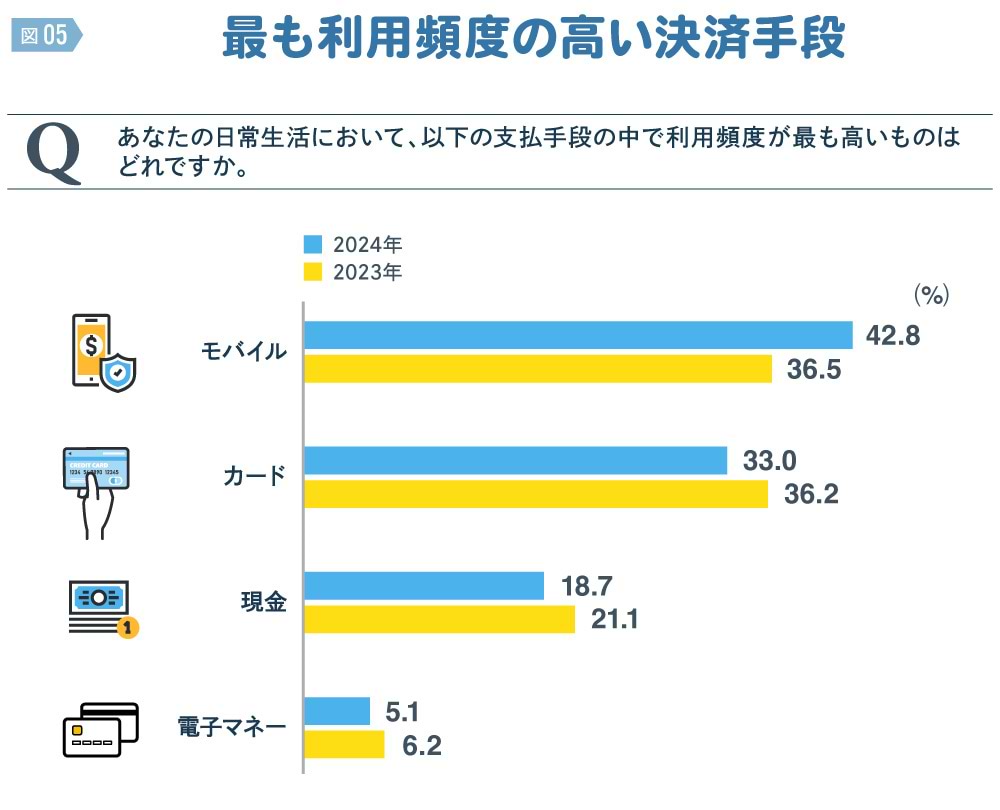
Now, let's look at usage frequency. We asked which payment method is used most frequently in daily life.
The results showed that 42.8% of respondents use mobile payments (combining QR and contactless payments) as their primary payment method, the highest percentage. This represents a 6.3-point increase from the previous survey's 36.5%, meaning that if there were five people, slightly more than two would use mobile payments as their primary method.
Meanwhile, cards (credit, debit, and prepaid combined) dropped 3.2 percentage points from the previous survey to 33.0%. Cash decreased 2.4 percentage points year-on-year to 18.7%. E-money fell 1.1 percentage points from the previous survey to 5.1%.
Mobile payments were the only method to increase in this survey, indicating that the decline in cards, cash, and electronic money was largely replaced by mobile payments.
In the previous survey, mobile payments were at 36.5% and cards at 36.2%, with mobile payments leading by a mere 0.3%. However, this time, mobile payments reached 42.8% and cards 33.0%, widening the gap to a significant 9.8 percentage points. It's fair to say the leading player in cashless payments has changed.
Looking at age groups, the percentage of younger people using mobile payments as their primary payment method is higher. Among those in their 20s, it's 49.0%, and among those in their 30s, it's 49.6%. Among younger generations, a full half are mobile payment advocates.
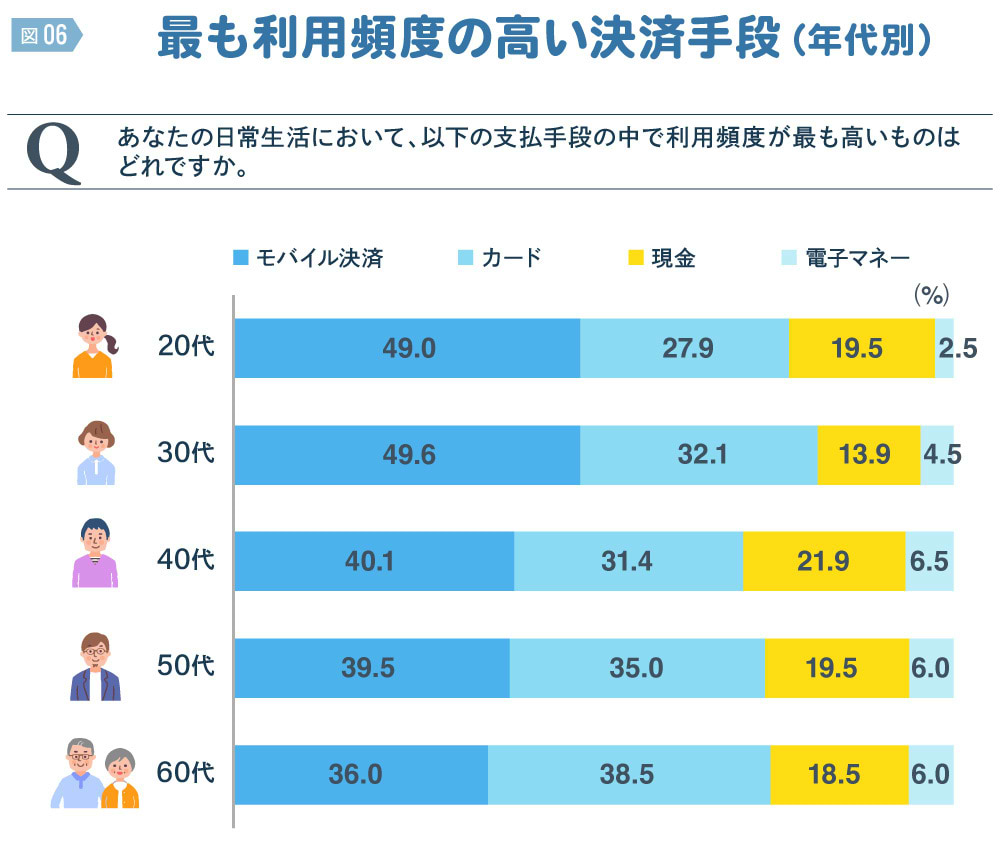
As discussed later, they represent promising users likely to continue using cashless payments for a long time. The percentage drops to 40.1% for those in their 40s, 39.5% for those in their 50s, and falls to 36.0% for those in their 60s. Notably, those in their 60s were the only age group where the percentage of people using cards as their primary payment method (38.5%) was higher.
Mobile payment penetration has increased over two years
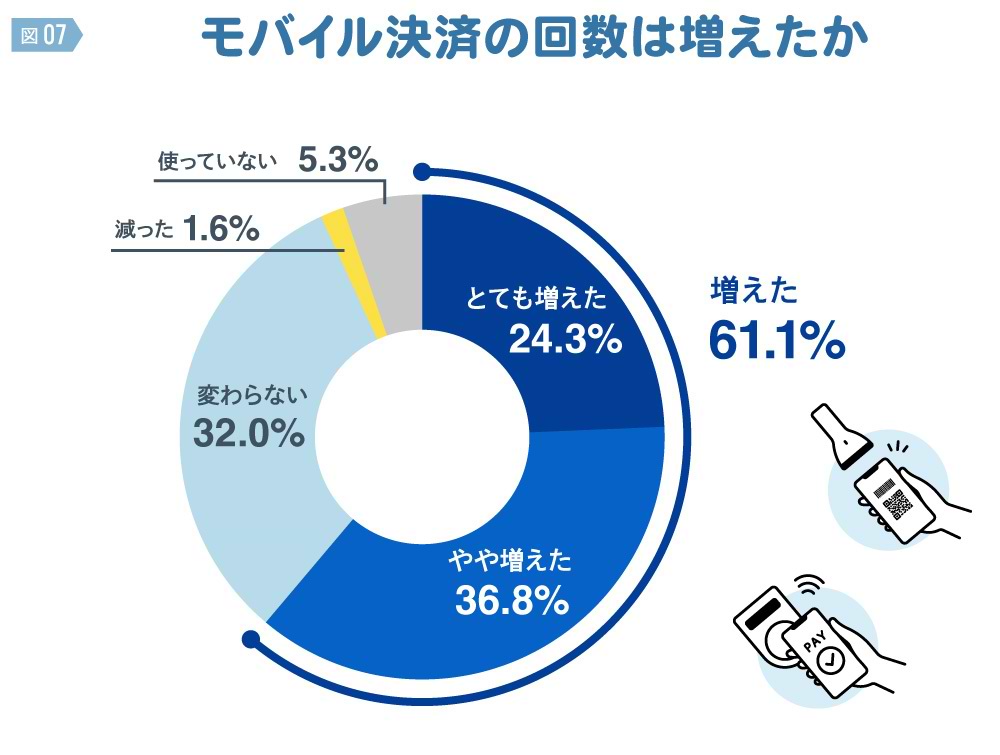
When did mobile payments start gaining traction? According to this survey, 61.1% of cashless payment users reported that "the frequency of their mobile payments has increased since the start of 2024." One in four (24.3%) said it increased significantly, while one in three (36.8%) said it increased somewhat. This data suggests mobile payments offer greater convenience compared to cards, e-money, or cash.
So, where are mobile payments increasing the most? Convenience stores topped the list (51.8%), followed by supermarkets/malls (45.2%) and drugstores (41.0%). These top three locations are all places where checkout lines tend to get crowded.
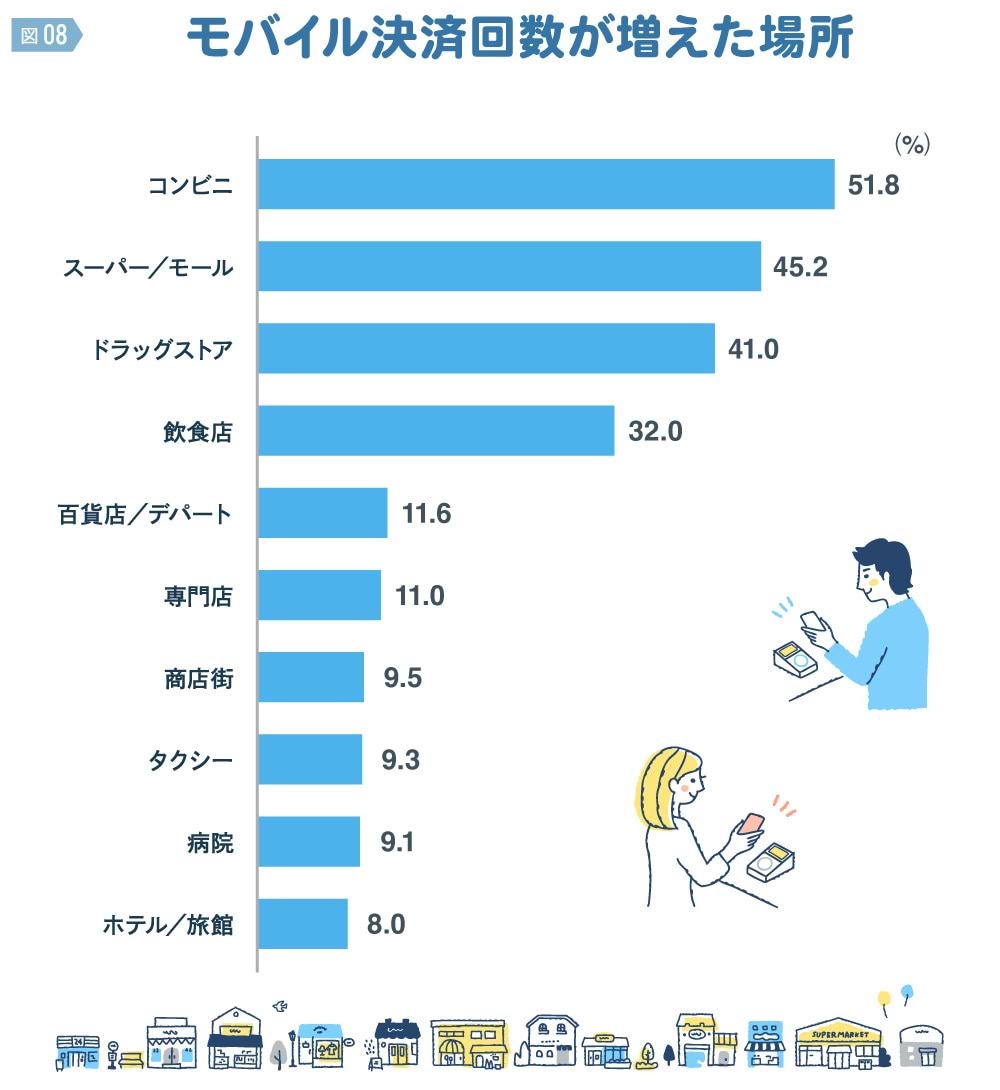
Mobile QR payments in these locations use Consumer Presented Mode (CPM). Users simply show the QR code displayed on their smartphone, eliminating the hassle of inserting cards into payment terminals or entering PINs.
Although not shown in the graph, examining payment method frequency by location reveals mobile payments lead at convenience stores (62.6%), used twice as often as credit cards (31.2%) or cash (33.4%). Mobile payments also top the list at drugstores at 56.8%. In 2021, cash (49.2%) was the top method, with mobile payments (39.5%) in second place, but mobile payments have since surged by 17.3 percentage points.
At supermarkets/malls, credit cards (60.0%) are the most common, but mobile payments (54.9%) are second. In 2021, mobile payments were third at 36.3%, with cards and cash having higher usage rates.
In just the last two years, the penetration of mobile payments has significantly increased, drastically changing the landscape of cashless payments in Japan.
What are the new revenue sources payment providers are expecting?
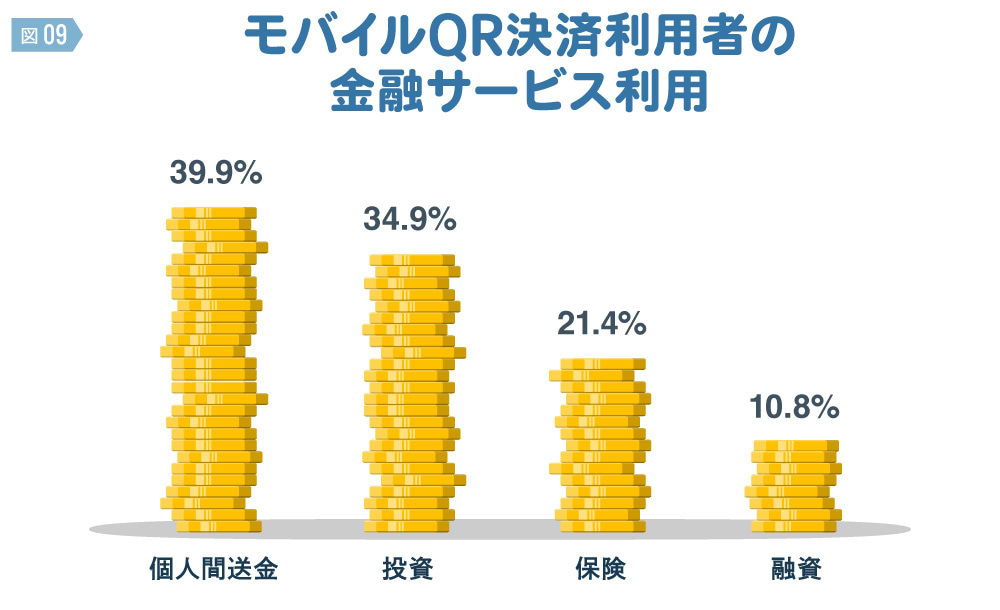
While mobile payments gain traction, mobile payment providers are steadily securing new revenue streams by promoting cross-selling of financial services—something difficult with cards. Specifically, they aim to offer financial services like peer-to-peer transfers, investments, insurance, and loans within a single app (digital wallet).
For peer-to-peer transfers, 39.9% of mobile QR payment users utilize this feature. While transfer fees are free, meaning no direct revenue, recipients may use those funds for shopping within the payment app's ecosystem, creating potential for fee income. Even if fee rates decrease, increased transaction volume drives top-line growth.
The cross-usage rate between mobile QR payments and investments is also high at 34.9%. NISA has strengthened the link between payments and investments more than ever before. Many mobile QR payment providers offer investment services tied to their payment platforms. From small-scale investments to NISA-based regular savings investments, the annual settlement volume becomes substantial, generating corresponding investment fees. Funds increased through investments may eventually flow back into payments, potentially converting into fee income.
Enhancing customer engagement with "combined-use" financial services
Among mobile QR payment users, 21.4% also use insurance. Popular are easily accessible short-term, low-premium insurance products like heatstroke and influenza benefits, bicycle insurance, and golf insurance. While premiums are small, accumulated income becomes a stable revenue source.
10.8% of users utilize loans. Interest income can be expected from these loans. Mobile carrier loan services are growing due to brand strength and convenience. Securing revenue from consumers is crucial as merchant fee income slows.
Among mobile QR payment users, 40.6% use only QR payments. This means roughly 60% of users cross-use some financial service. It also demonstrates that mobile QR payments function as digital wallet apps.
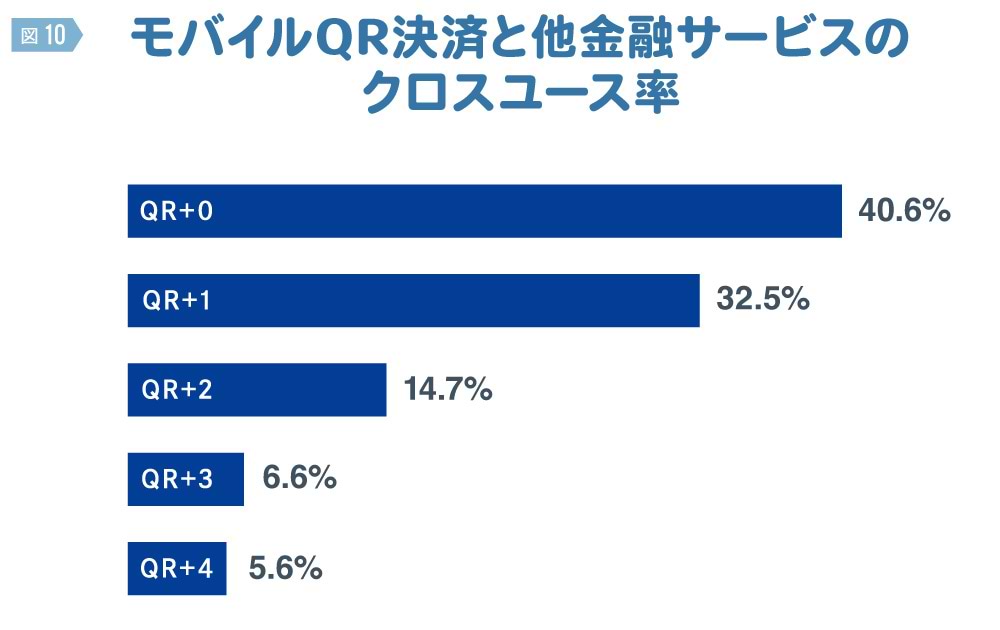
32.5% of users utilized one additional service alongside mobile QR payments. Those using two additional services accounted for 14.7%, three additional services for 6.6%, and four additional services for 5.6%. A digital wallet can integrate any number of financial services within it.
The more cross-usage progresses, the higher customer engagement becomes, enabling continuous revenue growth. Furthermore, a high cross-usage rate between mobile QR payments and other services can be seen as evidence of benefits for users, such as enhanced convenience. Mobile payments may increasingly become a gateway to financial service usage in the future.
Next time, we will examine changes on the merchant side for cashless payment providers.
[Survey Overview]
7th Survey on Cashless Awareness Among Consumers
・Purpose: To understand changes in consumers' payment methods
・Target Area: Nationwide, Japan
・Respondent Criteria: Men and women aged 20–69
・Sample Size: 1,000 ※
・Survey Method: Online survey
・Survey Period: December 1, 2024 - December 3, 2024
・Survey Agency: Rakuten Insight Inc.
* The 1,000 respondents were weighted to match the sex and age distribution of the population (based on the 2022 National Census). "%" and "n" represent the weighted scores and sample sizes, respectively.
The information published at this time is as follows.
Was this article helpful?
Share this article
Newsletter registration is here
We select and publish important news every day
For inquiries about this article
Author

Yoshitomi Sairyo
Dentsu Inc.
BX Creative Center, Experience Design Department
Senior Planning Director
Head of the Dentsu Cashless Project. Joined Dentsu Inc. after working at a U.S.-based consulting firm and a European investment bank. Engaged in new business development, marketing and brand strategy, and PR for clients in finance (banks, securities, insurance, etc.), telecommunications, automotive, beverages, toiletries, and pharmaceuticals. Contributions include "Corporate Reputation" (Advertising) and "CSR and Corporate Reputation" (Nikkei Branding). Certified Member of the Securities Analysts Association of Japan.

