Note: This website was automatically translated, so some terms or nuances may not be completely accurate.
In an era where nearly half have a "favorite," what perspectives are essential for advertising and marketing?
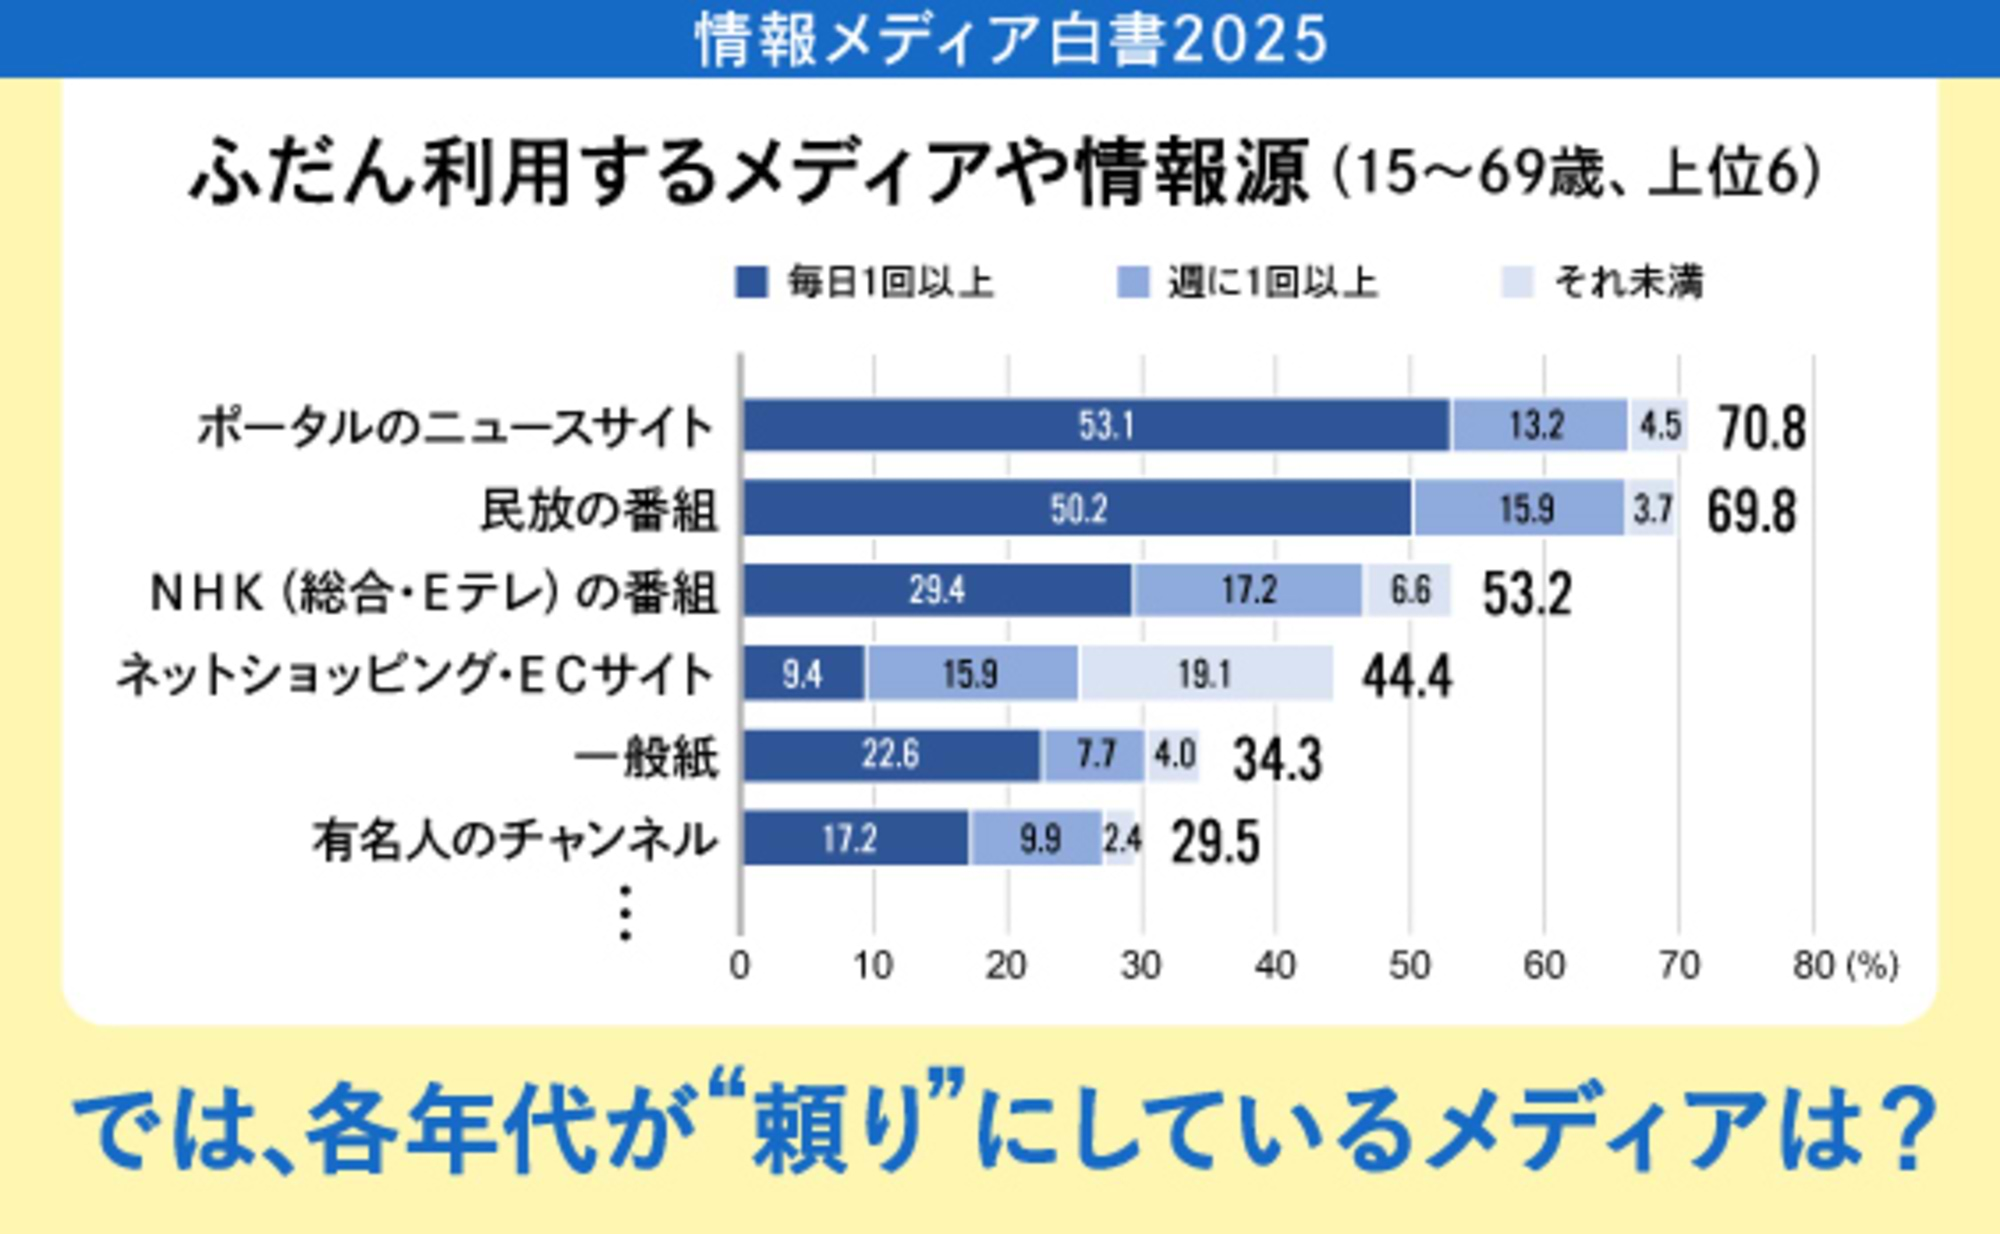
The "Information Media White Paper 2025" (edited by Dentsu Inc. Media Innovation Lab, published by Diamond Inc.) was released on April 23. This marks the 32nd year of publication for this white paper, compiled as a data book revealing the full landscape of the information media industry.
The opening feature, "A Period of Great Transformation in Media: New Horizons in Communication Shaping the Future," explains trends in the information media market and people's behaviors. This series introduces part of the content from this opening feature.
This article explains the findings and implications from a survey conducted by Dentsu Inc. in September 2024 regarding "supporting favorite idols" (oshi-katsu) and media usage. It explores the impact of having a favorite idol on media exposure, as well as its influence on overall consumption and well-being.
Furthermore, it examines the effectiveness of marketing communications, such as advertising, that incorporate "oshi-katsu," and explores differences based on the genre of these "oshi." Sō Hasegawa from Dentsu Inc. Media Innovation Lab explains data likely to be effective across broad planning domains including media, creative, and promotion.
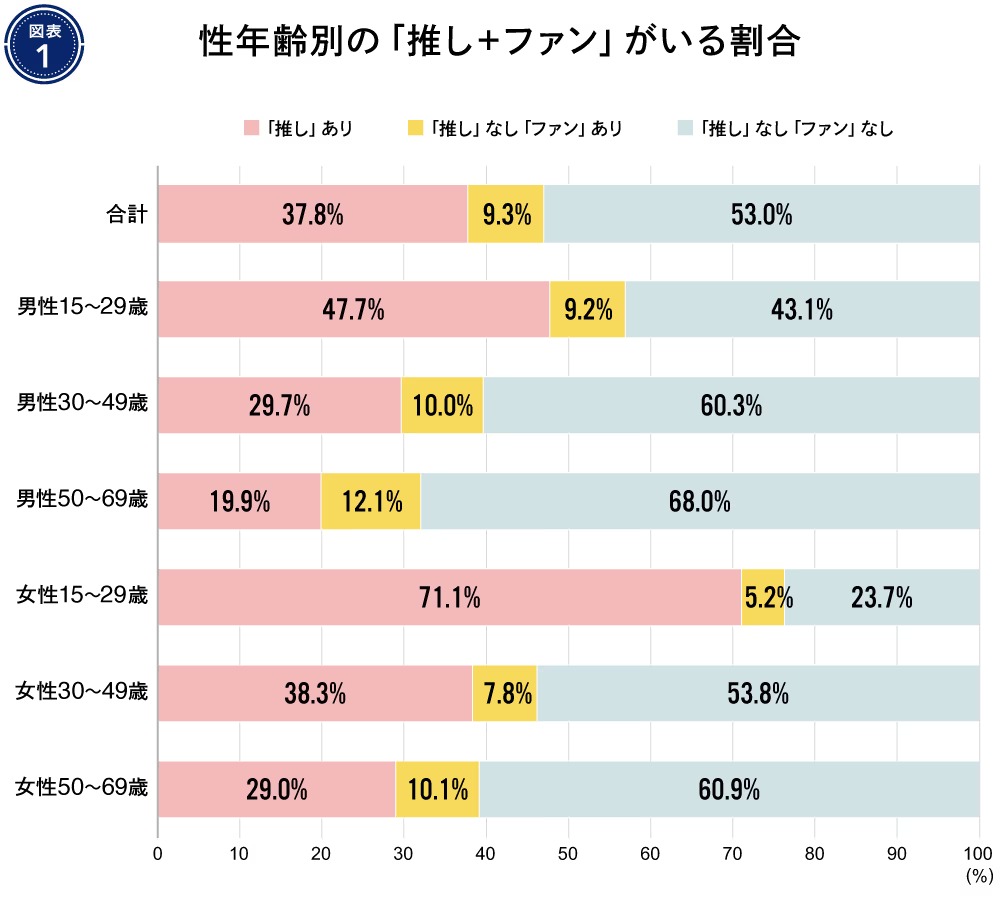
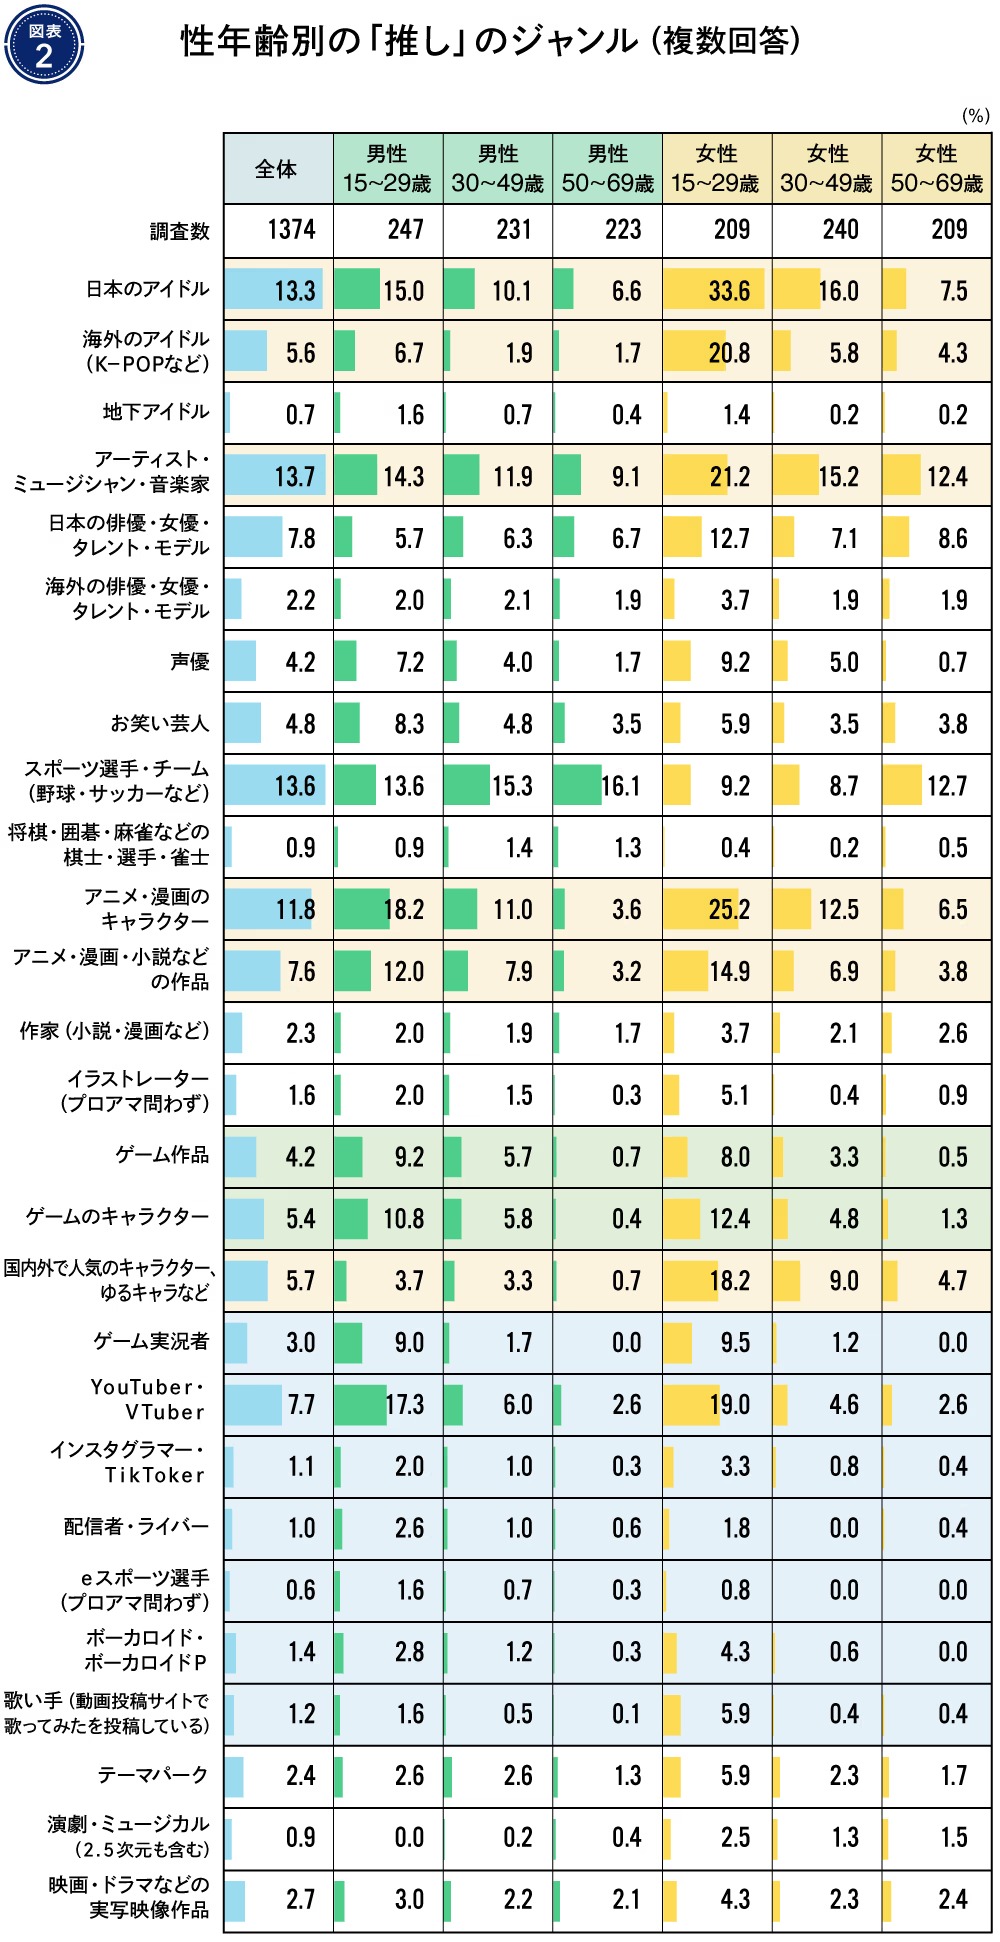
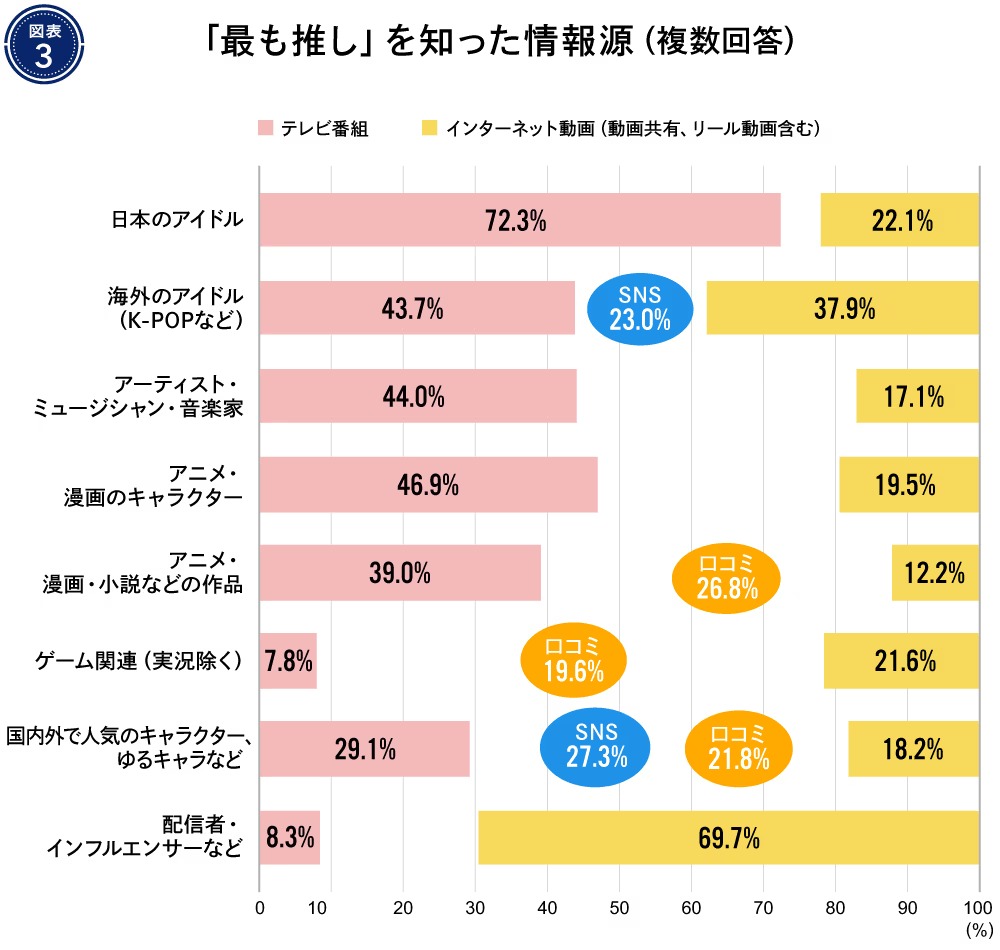
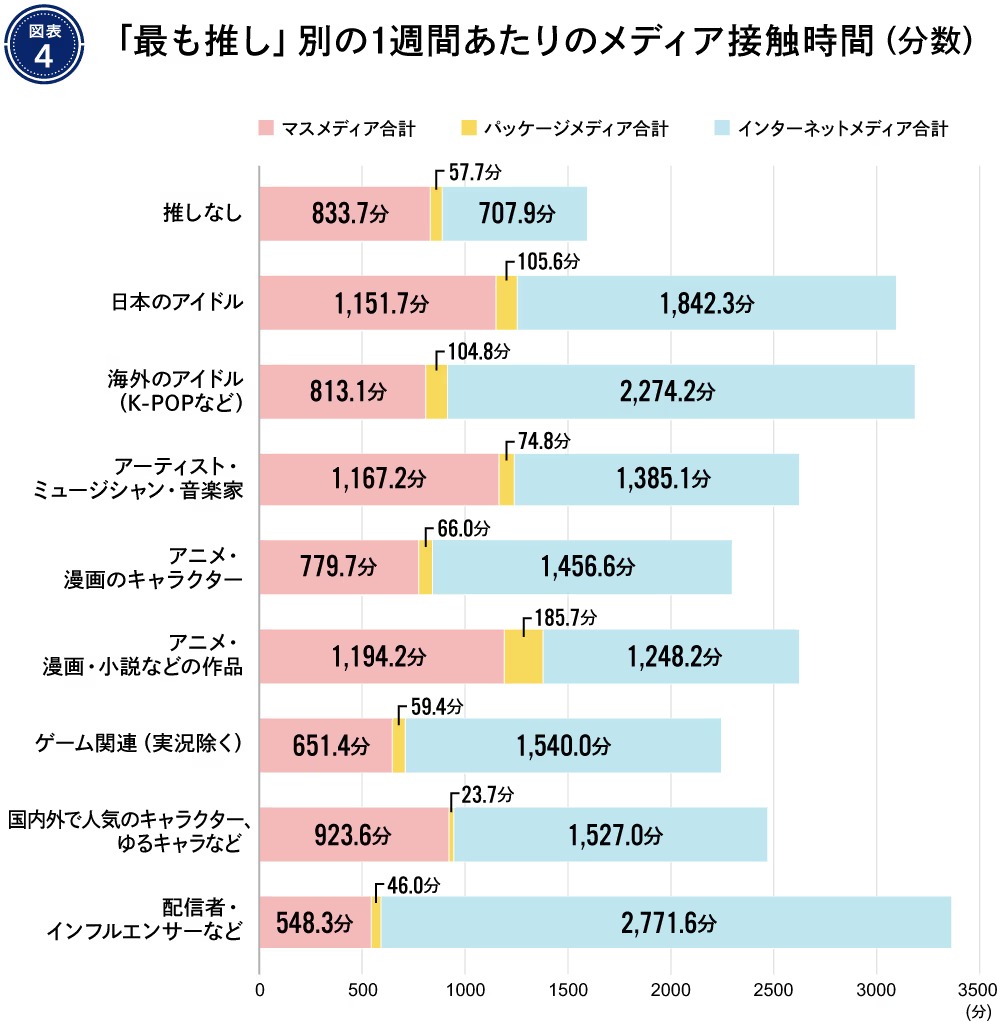
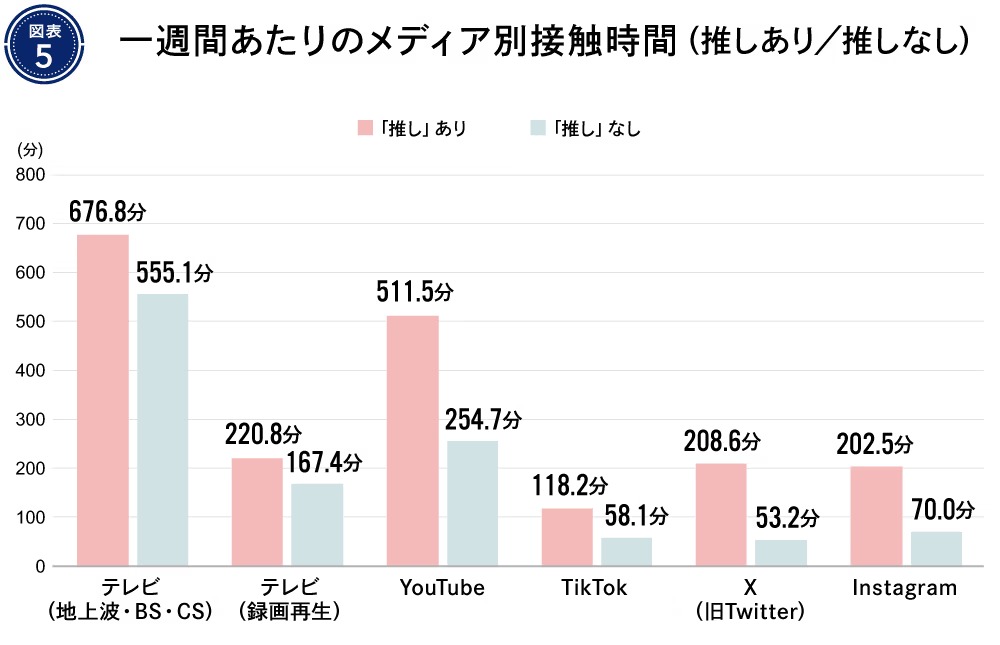
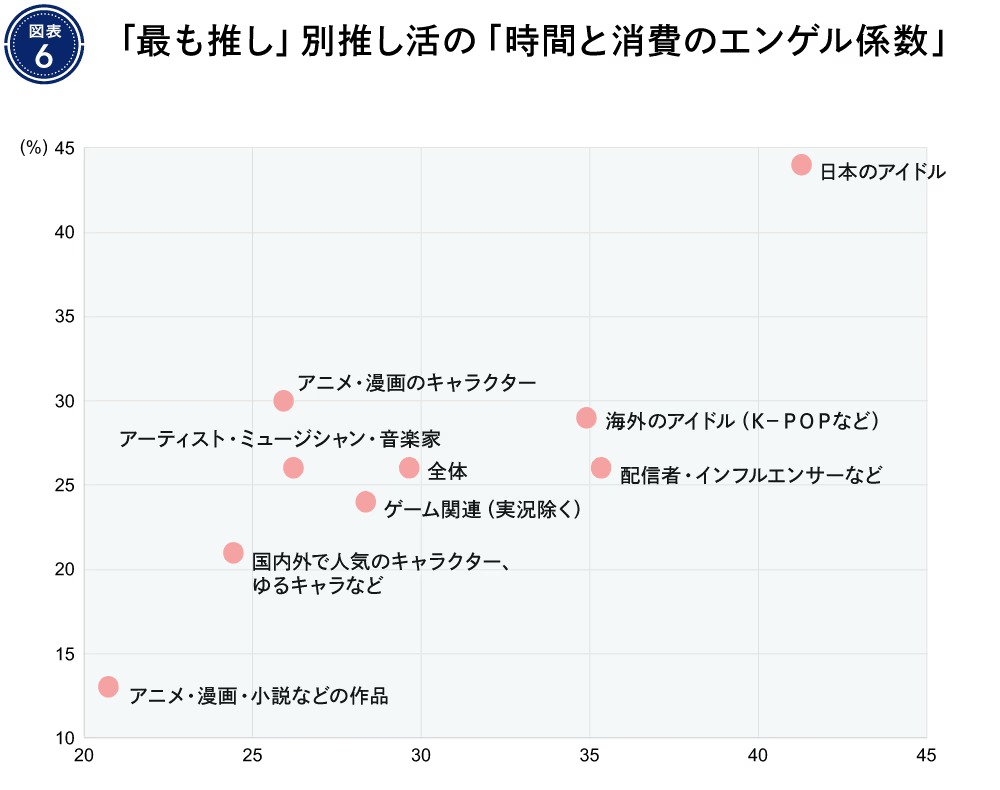
"Idol fandom activities" have gained significant attention in recent years. Lately, it seems increasingly discussed not only from the perspective of content or character business, but also from marketing angles aiming to leverage the fervor of fandom activities to expand consumption, or from a well-being perspective. One frequently cited factor behind the spread of "idol fandom" is the changing media landscape, including the proliferation of video streaming/sharing services and social media. Many video platforms allow users to watch content matching their preferences anytime, anywhere. Social media enables daily updates on core information about their "favorite idol," serving as a space for self-expression and fostering community among fans of the same idol. Thus, changes in the media environment are closely intertwined with "oshi-katsu." Understanding the reality of "oshi-katsu" is becoming increasingly important, particularly for deepening our understanding of young people's media usage behaviors. In this survey, we first asked respondents whether they had a "favorite." Those who answered no were then asked if they had any "fans or things they support." We provided a broad range of examples, including artists, idols, athletes or sports teams, comedians, celebrities, actors, YouTubers, influencers, VTubers, authors, video works, manga, and novels. The results showed that 37.8% of respondents indicated they had a "favorite." Furthermore, when adding respondents who stated they did not have a "favorite" but did have "someone or something they are a fan of or support" (hereafter referred to as "fans"), the total reached 47.0%. This indicates that "favorites + fans" account for approximately half of all respondents. Figure 1 shows the presence of "favorites" and "fans" by gender and age group. Looking at Figure 1, both "favorite" and "favorite + fan" are more prevalent among women than men, and among younger age groups than middle-aged and older groups. Notably, over three-quarters of women aged 15-29 reported having a "favorite + fan," while even the lowest group, men aged 50-69, reported having nearly one-third. The terms "favorite" and "favorite activities" themselves appear to be more prevalent among younger demographics. As mentioned earlier, this likely correlates closely with their media consumption habits, such as video streaming services and social media. Figure 2 summarizes the genres of "favorites" (multiple answers allowed) by gender and age group. (Hereafter, "favorite + fan" is combined and referred to as "favorite".) Overall, the three genres with the highest response rates were "Artists/Musicians/Musicians," "Athletes/Teams (Baseball, Soccer, etc.)," and "Japanese Idols." All three exceeded 13% with multiple responses allowed. (Each also exceeded 7% as the single "most favorite" response.) Following these were: "Anime/Manga Characters," "Japanese Actors, Actresses, Talents/Models," "YouTubers/VTubers," "Anime/Manga/Novels and Other Works," "Popular Characters Domestically and Abroad, Mascots, etc.," and "Overseas Idols (K-POP, etc.)." When asked to freely name their favorite, the top 10 included five Japanese idols, three sports players/teams (baseball, soccer, etc.), one overseas idol (K-POP, etc.), and one character. Among these, responses for "Sports Athletes/Teams (Baseball, Soccer, etc.)" and "Japanese Idols" tended to concentrate on specific teams or groups, while responses for "Artists/Musicians/Musicians" showed a tendency to be widely dispersed. The top three were: 1st place - Professional baseball player Shohei Ohtani, 2nd place - Hanshin Tigers, 3rd place - Snow Man. Looking more closely at gender and age groups, women aged 15-29 showed higher "favorite" response rates across many categories. Additionally, categories like "Anime/Manga Characters," "Game Characters," "Game Streamers," and "YouTubers/VTubers" were particularly high among younger age groups and lower among middle-aged and older groups, clearly showing age-based differences in trends. Meanwhile, among men and women aged 50-69, "athletes/teams (baseball, soccer, etc.)" and "artists/musicians/musicians" are higher. Thus, age-based differences became more pronounced than gender-based differences. Following this, we will extract and explain eight "favorite" genres that particularly garnered support from women aged 15 to 29.The analysis results shown in Figure 2 include the six genres shaded in light yellow, plus two combined genres added to ensure sufficient sample size: "Game-related (excluding live commentary)" (two categories, light green) and "Streamers/influencers, etc." (seven categories, light blue). Figure 3 shows the results of asking about the media (information source) where respondents first learned about these "favorites" (based on single-answer responses for "most favorite"). "TV programs" were the most common source. Comparing the eight genres, "Japanese idols" showed the highest percentage of fans who learned about their favorite through TV programs. While the high exposure on TV programs likely strongly influenced this, multiple other genres also had the highest number of respondents who learned about their favorite through TV programs. This shows TV programs hold significant influence as a gateway to discovering favorites. Conversely, for "Game-related (excluding live commentary)" and "Streamers/Influencers, etc.", internet videos significantly surpass television programs. Similarly, "Overseas idols (K-POP, etc.)" also show higher internet video usage. Differences in media exposure by age group for each genre, as revealed in Figure 2, and the volume of content distribution via that media, likely influence the difference in the initial media through which people first learn about their favorite. For genres like "Popular Domestic and International Characters, Mascots, etc.," SNS (timelines and trends) and word-of-mouth (introductions from family, friends, acquaintances) are increasingly prominent. On SNS, exposure can occur through trends, follower posts, or recommended content. It's also likely that many discover their favorite through so-called "memes"—imitations of their favorite's catchphrases, dances, etc. Furthermore, genres that pair well with physical products like books, DVDs, and merchandise tend to come up more easily in conversation, suggesting many fans discover them through word-of-mouth in real-world settings. This data can provide valuable insights not only for content businesses but also for planning campaigns that utilize "favorite idols." Figure 4 summarizes data by genre showing how media exposure time differs based on having a favorite idol. The categories are: "Total Mass Media," "Total Packaged Media" (including DVDs, Blu-rays, and books/photobooks), and "Total Internet Media" (including music streaming, video sharing, video streaming, and SNS). These three categories show the average weekly media exposure time. For comparison, the media exposure time of respondents without a favorite is also shown. For all eight genres shown in Figure 4, media contact time was higher than for those without a favorite. As the graph shows, most of the increase in contact time comes from internet media.Although not shown in the chart, this trend holds true regardless of genre when comparing differences by age group based on having a "favorite." For example, among women aged 15-29, where the difference is most pronounced, total media exposure time is 3,487 minutes for those with a "favorite" versus 1,188 minutes for those without. Total internet media exposure time is 2,693 minutes versus 775 minutes, respectively. This trend holds true even beyond the eight genres presented here. It's likely that many people, even when outside the home, can access their favorite idol's videos or social media anytime via smartphone. This leads to longer internet exposure time, which in turn increases their overall media exposure time. For total mass media, those who support "anime, manga, novels, and other works," "artists, musicians, and music creators," and "Japanese idols" showed higher contact times. This result lends credibility to the hypothesis that even in genres with relatively higher proportions of younger audiences who are somewhat distant from TV viewing, the presence of a "favorite" encourages TV program viewing. Meanwhile, for total internet media, "streamers/influencers" and "overseas idols (K-POP, etc.)" saw increased time. This likely stems from the prevalence of live streaming, longer content durations, and the wide variety of video content available. For total packaged media, as widely expected, "anime, manga, novels, and other works" had the highest contact time. So, which specific media saw increased contact time? Figure 5 shows the weekly contact time for major media, categorized by whether respondents had a "favorite" across all genres. Regardless of having a favorite, television (terrestrial, BS, CS) had the longest exposure time, followed by YouTube. However, when examining exposure time growth based on having a favorite, X (formerly Twitter) showed the highest growth rate, nearly quadrupling. Although not shown in this chart, individual analyses of the eight genres covered in Figure 4 also revealed that X (formerly Twitter) contact time exceeded double the growth rate of the "no favorite" category for all genres. This result is unique among the media and validating the hypothesis stated at the beginning of this paper. X (formerly Twitter) appears to play a significant role as a key platform for daily core information updates and community building. This survey also examined the proportion of freely available time and money invested in "idol fandom activities." Figure 6 plots these results by the "most favored" idol category. The X (horizontal) axis represents time, and the Y (vertical) axis represents money. As is immediately apparent, "Japanese idols" overwhelmingly dominate, with the highest investment ratio for both time and money. Analyzing this result, the following factors are thought to contribute to the exceptionally high time ratio: ・A vast amount of content across various media Regarding consumption, beyond participation fees for concerts and events, purchases of packaged media and various merchandise are also significant. As a mature business, its base is broad, likely contributing to the high monetary investment ratio. For genres showing a time ratio advantage (plotted in the lower right of the graph), "Streamers/Influencers, etc." and "Overseas Idols (K-POP, etc.)" were identified. As mentioned in the previous section, this is likely due to the significant time spent engaging with internet media. Meanwhile, genres with a monetary ratio advantage (upper left of the graph) included "Anime/Manga Characters." This is likely influenced by the broad base of merchandising, which handles various goods like figures, acrylic stands, clear files, pin badges, and plush toys. Genres dominated by time ratio tend to be driven by strong feelings like "wanting to share the same space and time as my favorite idol," "unforgettable moments of excitement," and "desiring a sense of unity among fans." This can be called "flow-type fandom activities." Conversely, genres dominated by monetary investment tend to be driven by desires like "filling one's favorite space with the idol" or "finding joy in growing collections," representing what could be called "stock-based idol fandom." Furthermore, the desire to "feel connected to my favorite idol anytime" can be fulfilled through time-based consumption, such as watching internet videos, or through monetary consumption, like can be satisfied through time-consuming activities like watching online videos, or through monetary consumption like purchasing goods to keep close at hand. Figure 7 shows responses to the question about how fans feel about a product or service when their favorite idol is featured in its advertisement. Across all categories, including those beyond the eight genres, scores were high for recognition and interest-inducing responses such as "watching/listening to the entire advertisement," "becoming more aware of the product/service, noticing it more," and "developing interest/curiosity in the product/service." This clearly demonstrates an advertising effect. "Japanese idols" demonstrate broad appeal among fans and are confirmed to be effective in driving ad viewing and attention. Meanwhile, "anime, manga, novels, and other works" scored particularly high not only on "wanting to research the product/service in detail or inquire about it" but also on "wanting to purchase or use the product/service." Given the prevalence of corporate tie-up campaigns with anime works today, this confirms their solid effectiveness in prompting actions like wanting to research or buy. Furthermore, character-related genres rank highly across many categories. Japan has long had a deep-rooted character culture, with characters—including "mascots" used by local governments—utilized in numerous contexts. This suggests they also offer broad effectiveness in advertising and marketing. This survey asked respondents to freely describe memorable campaigns or advertisements featuring their "favorite" character, along with their reasons. Naturally, favorability toward products or services featuring their "favorite" character was high. Among the passionate responses, several expressed gratitude toward companies themselves for not discontinuing their favorite character's advertising role even when controversies arose. On social media, posts from individuals and companies appear on the same timeline. Corporate sponsorships can be viewed similarly to "oshi-katsu" (promoting one's favorite), and companies that promote one's "oshi" can be perceived as "comrades" or "fellow fans." As consumer interests and media become increasingly fragmented, and many products commoditized, the era of pursuing reach alone in marketing communications is becoming a thing of the past. One solution to this situation could be for companies themselves to adopt the "fandom activity" perspective. This means updating the approach of simply featuring someone in an ad and instead planning with the mindset of the company actively participating in "fandom activity." If this participation is sustained rather than one-off, it could spark empathy towards the company, which might then spread positively through social media and other channels. As mentioned at the outset, 47.0% of respondents indicated they have a "favorite" or "fan." Furthermore, 65.5% stated that having a favorite makes their daily life feel more enjoyable and fulfilling. This means one-third of consumers experience a positive impact on their lives through their favorite. One reason we focused on "favorites" this time was a hypothesis: amid a trend where advertising is increasingly disliked by some, "favorite activities" might play a role in rebuilding a "happy relationship with media, content, and advertising." While still in the process of verification, we hope the data presented here can serve as a planning hint for marketing communications, content business, and other fields. we hope it can serve as a planning reference for marketing communications, content business, and related fields. [Survey Overview] Sample Size for Each Genre ("Most Favorite") in Analysis The information published at this time is as follows. Was this article helpful? Share this article Newsletter registration is here We select and publish important news every day For inquiries about this article Dentsu Inc. Dentsu Inc. Media Innovation Lab Director of Media Innovation Research After working in the development and operation of information media services at a domestic telecommunications carrier, he joined Dentsu Inc. Following roles primarily in media planning and digital marketing, he assumed his current position. His interests include information behavior, media business, advertising medium development, and local media. He holds a Master’s degree in Interdisciplinary Information Studies and is a Marketing Meister certified by the Japan Marketing Association. Dentsu Inc. Launched in October 2017, leveraging Dentsu Inc.'s longstanding media and audience research expertise. Conducts research and disseminates insights to capture shifts in people's diverse information behaviors and understand the broader media landscape. Provides proposals and consulting on the communication approaches companies need within this context.
▼Nearly Half Have a "Favorite"! The Reality of "Favorite-Related Activities"
▼Top "Favorite Genres" Include Artists, Sports, and Japanese Idols. Trends Vary by Age Group
▼"TV Programs" Are the Most Common Way to "Meet Your Favorite." "Oshi-katsu" and Media Usage
▼Significant Differences in Media Consumption Time Between "Fans" and "Non-Fans"
▼Fans of "Japanese Idols" Show Overwhelmingly Higher Consumption Rates of Time and Money
▼What impact does their favorite's advertising appearances have on fans?Nearly half have a "favorite"! The reality of the spread of "favorite activities"
Top "favorite categories" are artists, sports-related, and Japanese idols. Trends also vary by age group.
The most common way to "meet your favorite" is through "TV programs." "Supporting your favorite" and media usage
Significant differences in media exposure time between those with and without a favorite
Fans who support "Japanese idols" show overwhelmingly high consumption rates of both time and money
・A wide range of event options, such as concerts and handshake eventsWhat is the actual impact of using "favorites" in advertising on fans?

Survey Period: September 2024
Survey Method: Web-based survey
Survey Area: Nationwide
Sample Size: 4,925 (SC Survey), 1,374 (Main Survey: "Favorite" present), 720 ("Favorite" absent)
Respondent Attributes: Men and women aged 15–69
Japanese idols: 232
Overseas Idols (K-POP, etc.): 88
Artists/Musicians/Musicians: 216
Anime/Manga Characters: 113
Works (Anime, Manga, Novels, etc.): 41
Game-Related (excluding live commentary): 51
Popular characters and mascots (domestic and international): 55
Streamers, Influencers, etc.: 109![]()
![]()
![]()
![]()
Back Numbers
Author

Hasegawa So
![]() Special Discussion: "Japan's Advertising Expenditures"
Special Discussion: "Japan's Advertising Expenditures"![]() Information Media White Paper 2023: What You Need to Know Now—The Past, Present, and Future of Media and Society
Information Media White Paper 2023: What You Need to Know Now—The Past, Present, and Future of Media and Society![]() Information Media White Paper 2024: The Rapidly Changing Media Environment and Consumers
Information Media White Paper 2024: The Rapidly Changing Media Environment and Consumers![]() 100 years since its birth. Radio, today...
100 years since its birth. Radio, today...![]() Information Media White Paper 2025: New Horizons in Communication Shaping the Future
Information Media White Paper 2025: New Horizons in Communication Shaping the Future![]() Information Media White Paper Special Report 2026: “The Current State of Evolving Information Trends”
Information Media White Paper Special Report 2026: “The Current State of Evolving Information Trends”
dentsu Media Innovation Lab
![]() Insight Memo
Insight Memo![]() Special Discussion: "Japan's Advertising Expenditures"
Special Discussion: "Japan's Advertising Expenditures"![]() Explore the Amazing World of YouTube Creators with UUUM
Explore the Amazing World of YouTube Creators with UUUM![]() Information Media White Paper 2024: The Rapidly Changing Media Environment and Consumers
Information Media White Paper 2024: The Rapidly Changing Media Environment and Consumers![]() 100 years since its birth. Radio, today...
100 years since its birth. Radio, today...![]() College Students and the Future of Media, Communication, and Advertising in Ten Years
College Students and the Future of Media, Communication, and Advertising in Ten Years![]() Information Media White Paper 2025: New Horizons in Communication Shaping the Future
Information Media White Paper 2025: New Horizons in Communication Shaping the Future![]() Information Media White Paper Special Report 2026: “The Current State of Evolving Information Trends”
Information Media White Paper Special Report 2026: “The Current State of Evolving Information Trends”Also read