Note: This website was automatically translated, so some terms or nuances may not be completely accurate.
We aim to advance the field where technology and science intersect.
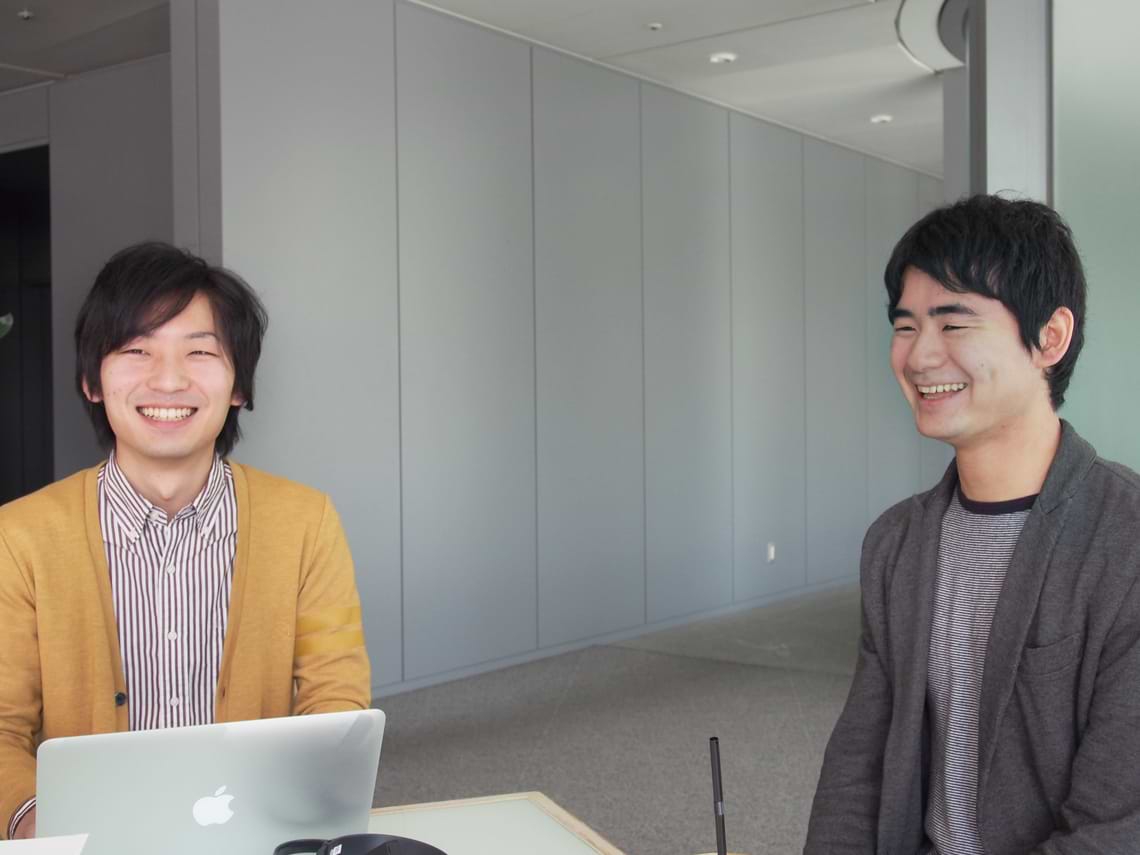
Yuta Takeuchi
Dentsu Inc.
Ogino Mikito
Dentsu ScienceJam Inc.
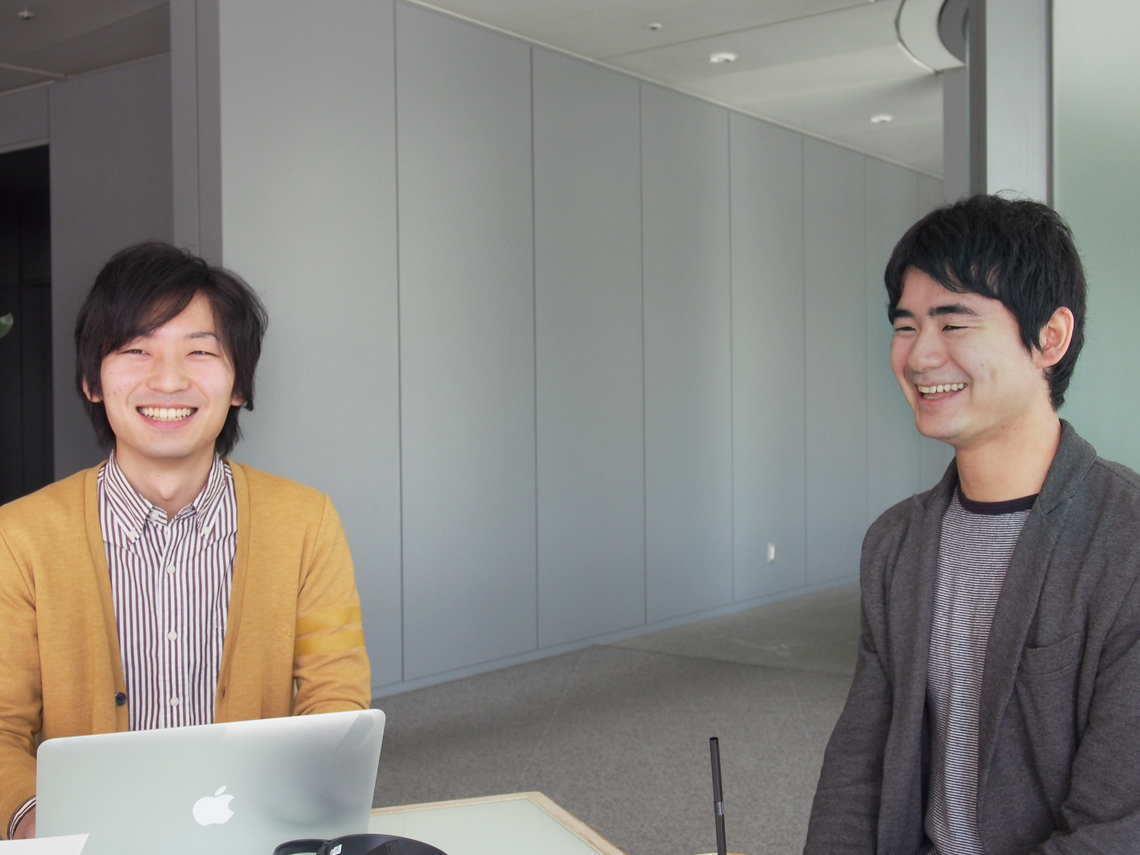
This time, we spoke with Yuta Takeuchi, who handled prototyping and technical direction for neurocam, and Mikito Ogino, a researcher at Keio University's Mitsukura Laboratory and an engineer at Dentsu ScienceJam Inc., about the "Sensitivity Analyzer" released by Dentsu ScienceJam Inc.
Real-time Brainwave Display on Smart Devices
──First, what exactly is the Sensibility Analyzer?
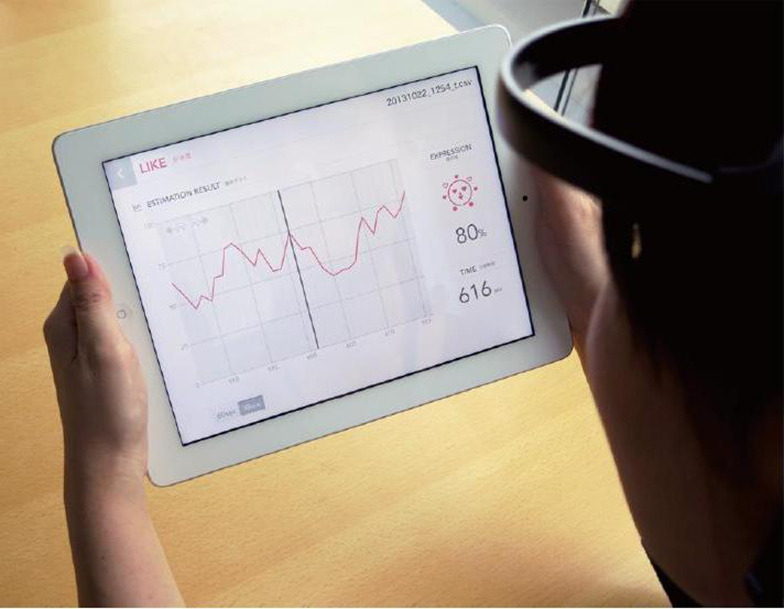
Takeuchi: It's a device that simplifies the analysis and visualization of raw biological signals measured via a headset, displaying them in real time on a tablet device.
──What kinds of emotions can it measure?
Takeuchi: "Liking," "Interest," "Stress," "Sleepiness," and "Concentration," expressed on a scale from 0 to 100. Mr. Ogino ported the algorithm for use on tablet devices.
Ogino: Originally, Professor Mitsukura's lab at Keio University had a visualizer that ran on PCs, but it was very basic—monochrome, displaying only text and values. This Sensitivity Analyzer is a renewal of that visualizer, redesigned for tablet devices.
──Why did you rebuild it for smart devices?
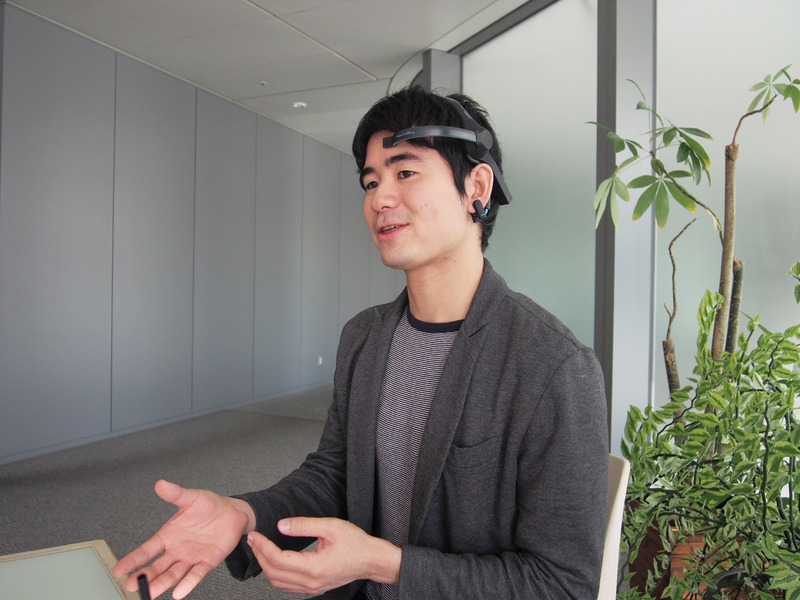
Ogino: For example, when analyzing brainwaves outdoors, it's more convenient to carry a smartphone in your pocket than to lug around a laptop.
──Was there demand for that?
Ogino: Yes, companies expressed a need for it to allow subjects to undergo measurements in a more natural way.
──Did you handle the design, Mr. Takeuchi?
Takeuchi: I organized the design and usability aspects. Even for business applications, appearance and ease of use are crucial. Dentsu Inc. has expertise in user interfaces and design, so I worked closely with Ogino on this.
──What were the challenges in development?
Takeuchi: It was quite challenging to create a design that felt "easy to implement" while maintaining trustworthiness, including ease of use and readability. If users thought "this looks hard to operate," they wouldn't use it.
Ogino: In programming, even a single character error in the code could mess up the measurement results. But with biosignals, you can't really "check the answers" – it's hard to tell if the results are wrong just by looking at them. So we worked very carefully.
Brainwaves vary greatly between individuals. For example, some people maintain high concentration levels all the time.
Takeuchi: Shall we try measuring now?
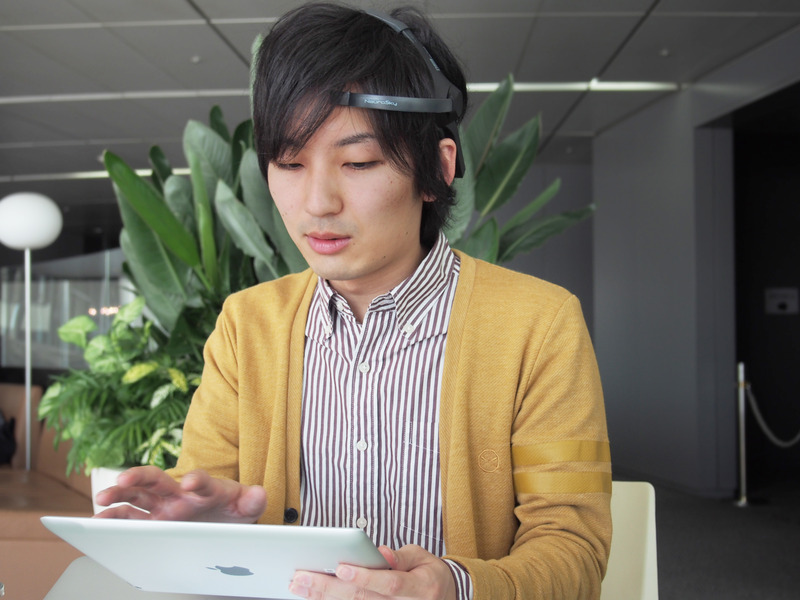
Takeuchi: We can measure in real time. For example, right now, since you're being photographed, your stress level might be a bit high (laughs).
Ogino: Stress levels are related to fatigue levels too. Maybe I'm a bit tired right now.
──When displayed on a scale of 0 to 100, is there an average value for each algorithm?
Takeuchi: There's quite a lot of individual variation. For example, some people maintain consistently high concentration levels, while I'm the type who tends to have consistently low concentration.
──How low?
Takeuchi: Like 10, or something like that. In my case, my interest level and enjoyment level are all low, and I sometimes wonder what kind of person I am (laughs).
──Do you ever see extreme values like 0 or 100?
Takeuchi: Yes. Sleepiness is a good example—0 means you're fully awake, while 100 means you're asleep.
──Like, could "liking" something hit 100?
Takeuchi: Absolutely. Like when you're hungry and see food, it can jump way up.
It can even measure stress levels during sleep.
──The Sensibility Analyzer was released alongside neurocam. How did it go at events like "Human SENSing 2013" and the opening event for "DG717" in San Francisco?
Takeuchi: A huge number of people got to experience it. While we positioned it as a research tool at the events, we also received many requests like, "We want to use this for advertising or campaigns." Seeing everyone's reactions made it clear this tool has versatile applications.
──For example, how might it be used in a campaign?
Takeuchi: Well, for the food and beverage industry, it could visualize "deliciousness."
──But the algorithm doesn't measure "deliciousness," right?
Takeuchi: We might be able to adapt the "liking" score from eating and drinking experiences to some extent. Alternatively, we could develop a separate algorithm focused specifically on the "taste" experience.
──I see. What kind of reactions did you get in research contexts?
Takeuchi: We heard interest in using it for usability studies. For website testing, you could determine button placement based on focus or preference levels to make them more clickable.
──That's pretty impressive. It could change the theory of usability testing.
Ogino: I think it will enable more accurate research. Plus, since it analyzes in real-time, it's strong for time-series studies. For example, in TV commercial surveys, if you take a questionnaire after watching the ad, people forget the finer details of their impressions. But with the Sensory Analyzer, you can record responses over time. Combining it with other qualitative research methods increases accuracy.
Takeuchi: Other applications include menu development in the food service industry, or store design incorporating customer flow patterns. An interesting use case is even investigating sleep comfort.
──Meaning measurements are taken while the subject is asleep?
Takeuchi: If you wear a headset while sleeping, we can measure stress levels during sleep. Of course, we need to ensure the headset stays in place. Being able to collect sleep comfort data over time is unique to biosignals.
We also have urban development applications. For example, combining cityscape data with GPS allows us to analyze where people show interest in what.
──I see. Do you also propose survey methods?
Takeuchi: Yes, we can propose survey methods as our expertise grows. Professor Mitsukura may also supervise some projects. If developing from the algorithm stage, we can collaborate with Mr. Ogino, myself, and partner companies to provide applications or systems incorporating that algorithm.
We want to keep using new methods to improve measurement accuracy.
──Could you tell us about future developments?
Takeuchi: While we get many requests for research tools, since biosignals are a hot topic right now, I think using them for campaigns or promotions could be interesting too. I'd also like to explore more entertainment-oriented applications, like games.
Ogino: Personally, I want to expand the types of algorithms we offer, including emotion estimation. Also, since technology advances daily, I want to keep using new methods to improve measurement accuracy.
Takeuchi: Beyond just biosignals, we want to use Dentsu ScienceJam Inc. as a hub to collaborate with various partners, planning and executing advertising campaigns that connect to our core business. Starting with tools like the Sensibility Analyzer and neurocam, we hope to contribute, even in a small way, to the development of this overlapping domain where technology, science, and creativity converge.
Was this article helpful?
Share this article
Newsletter registration is here
We select and publish important news every day
For inquiries about this article
Back Numbers
Author
Yuta Takeuchi
Dentsu Inc.
zero/Dentsu Lab Tokyo Part 1
Planner / Producer / Creative Technologist
Drives projects from planning and conceptualization through experience design, service design, and business development support. With a background as a technical director, excels at designing experiences while considering technical constraints.
Ogino Mikito
Dentsu ScienceJam Inc.
Since 2012, I have been engaged in research on estimating emotions from biological signals at the Mitsukura Laboratory, Faculty of Science and Technology, Keio University, where I was responsible for developing the algorithms and libraries for "mico," "neurocam," and the "Sensitivity Analyzer." Currently, I am a Researcher at the Graduate School of Science and Technology, Keio University, and a Researcher/Engineer at Dentsu ScienceJam Inc.