Note: This website was automatically translated, so some terms or nuances may not be completely accurate.
Savings and Points Activities Are Their Strong Suits! The High Awareness and Action of "Cashless Rich"
What is the actual state of cashless usage in Japan?
Dentsu Inc.'s Cashless Project, a team supporting marketing strategy in the payment domain, conducted an online "Cashless Awareness Survey of Consumers" in December 2022. The survey examined how consumers used cashless payments in their daily lives over the preceding year. ( Survey overview here )
This series explores insights for promoting cashless payments in Japan based on the survey results.
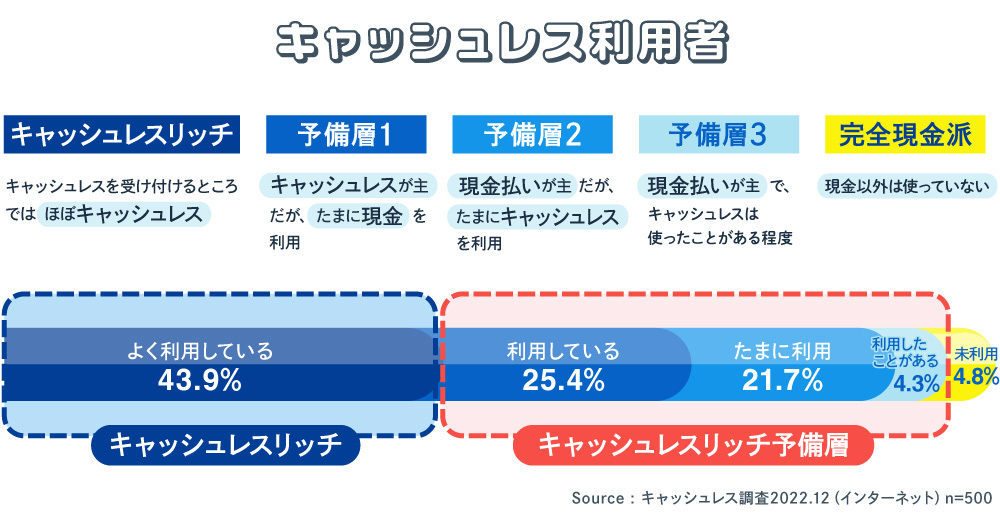
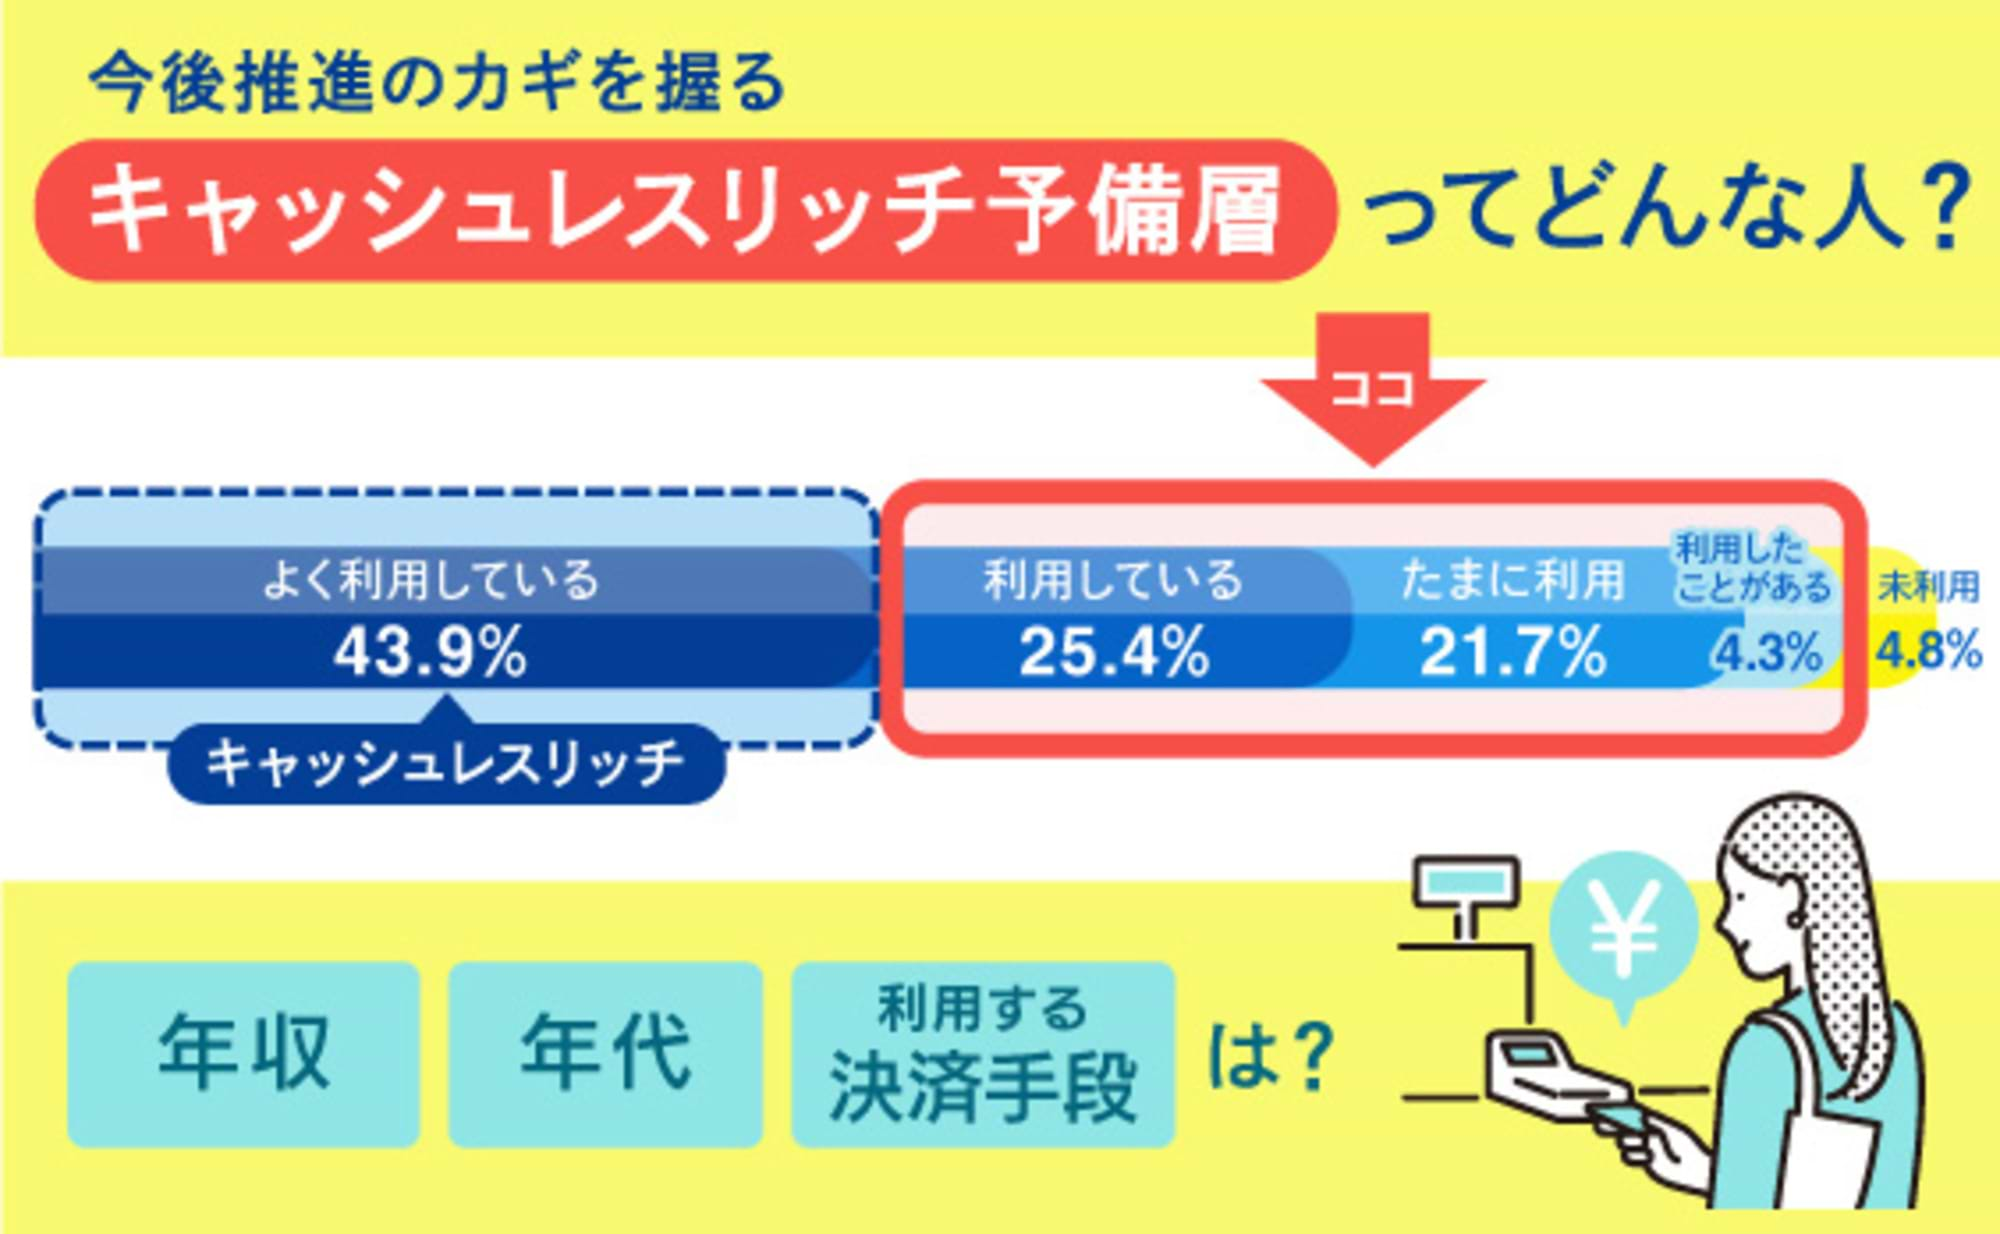
The survey classified cashless users into five distinct segments (types) based on the clear difference between their cashless and cash usage, then tracked their usage patterns.
The results highlighted a significant gap between "frequent users (cashless-rich)" and other users within the cashless user base ( see previous article ). This installment focuses on trends among the "frequent users," specifically examining the segment introduced previously.
Reference Series: Cashless Japan Survey 2021: DX Driven by Cashless
<Table of Contents>
▼ Do High-Engagement Cashless Users Have Higher My Number Card Ownership Rates?
▼ Cashless Rich Are Also Active in Point Activities
▼ Interest in Point Investing Presents Opportunities for Payment Providers
▼ Are Cashless Rich Good Savers!?
▼ Does Higher Payment Literacy Lead to Higher Financial Literacy!?
▼How is "digital salary payment" being received?
▼Over half of "occasional users" intend to increase cashless spending
▼Cashless Rich show high awareness and action
Do high-engagement cashless users have higher My Number card ownership rates?
Since September 2020, the Japanese government has implemented the "My Number Points" program to promote My Number Card and cashless adoption. Since then, the relationship between My Number Cards and cashless payments has deepened. As of September 1, 2020, the issuance rate of My Number Cards relative to the population was 19.4% on average nationwide. This has since increased to 69.8% as of April 30, 2023 ( both figures released by the Ministry of Internal Affairs and Communications ).
In the December 2022 survey conducted this time, the average My Number Card ownership rate was 71.9%. How does this break down by segment?
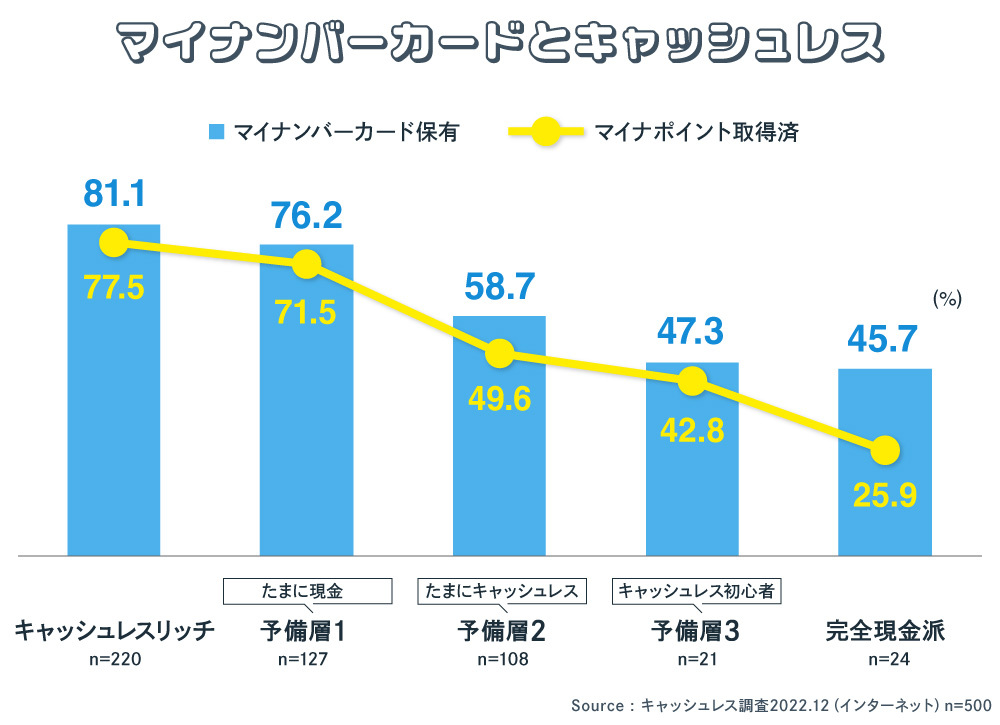
We found that My Number Card ownership rates increase with the level of cashless involvement. The ownership rate among Cashless Rich users was 81.1%, and among Reserve Group 1 (occasional cash users) it was 76.2%, both exceeding the average of 71.9%.
Conversely, the rate was below average for the Pre-cash Group 2 (occasional cashless users) at 58.7%, the Pre-cash Group 3 (cashless beginners) at 47.3%, and the Cash-only Group at 45.7%.
Furthermore, the percentage of users who have already obtained My Number Points ( ) also tends to increase with higher cashless involvement, indicating sensitivity to point incentives.
Cashless Rich are also active in point activities
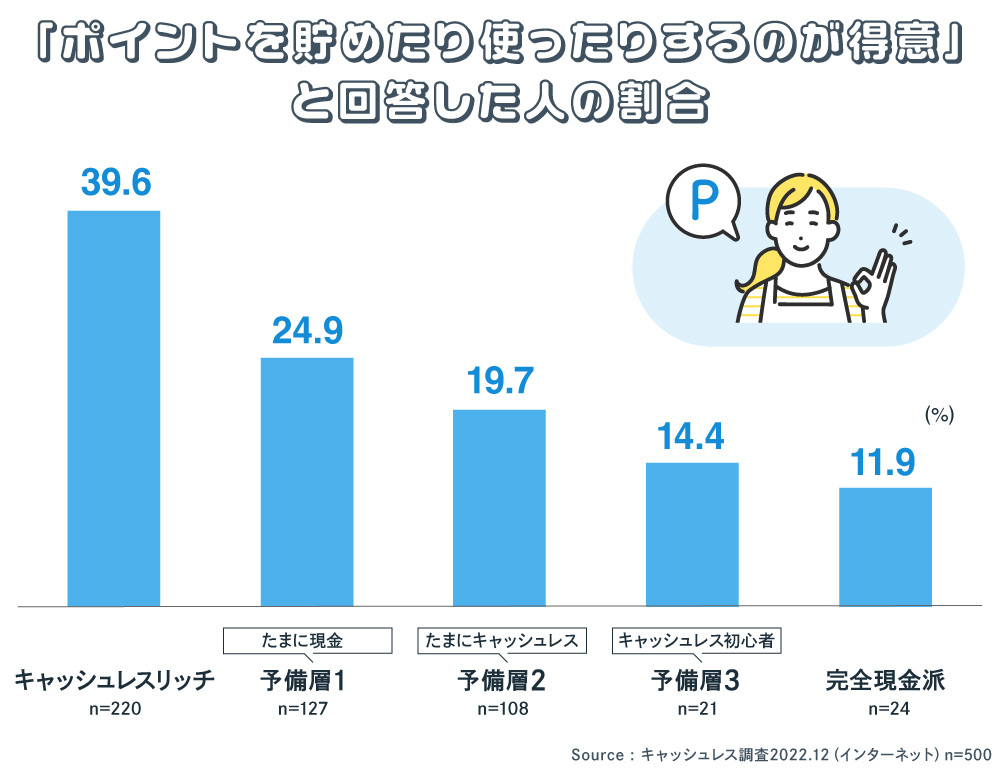
We also investigated which group is most adept at accumulating and using general points beyond My Number Points. First, the percentage of people who feel they are "good at accumulating and using points" yielded the following results.
As the term "point-hunting" suggests, various points exist in society, ranging from health points earned just by walking to points for child-rearing.
While some points are earned through cash spending, our survey found that 32.4% of all respondents cited "point rewards" as their top priority for cashless payments. This means one in three cashless users prioritizes point benefits, choosing payment methods that make points easier to earn and use.
Furthermore, the proportion of people who answered "I am good at accumulating and using points" is higher among the Cashless Rich segment than among the pure cash users. Among the Cashless Rich, two out of five (39.6%) answered "I am good at accumulating and using points." This suggests a tendency among the Cashless Rich to be skilled at supplementing their living expenses by effectively accumulating and using points.
Interest in point investing also presents opportunities for payment providers
One way to use points is through point investment. This service allows accumulated points to be invested in mutual funds or fractional shares.
In recent years, the Japanese government has promoted its "Asset Income Doubling Plan," aiming to shift personal assets from savings to investment. Let's classify this segment based on point investment/management experience or usage intent.
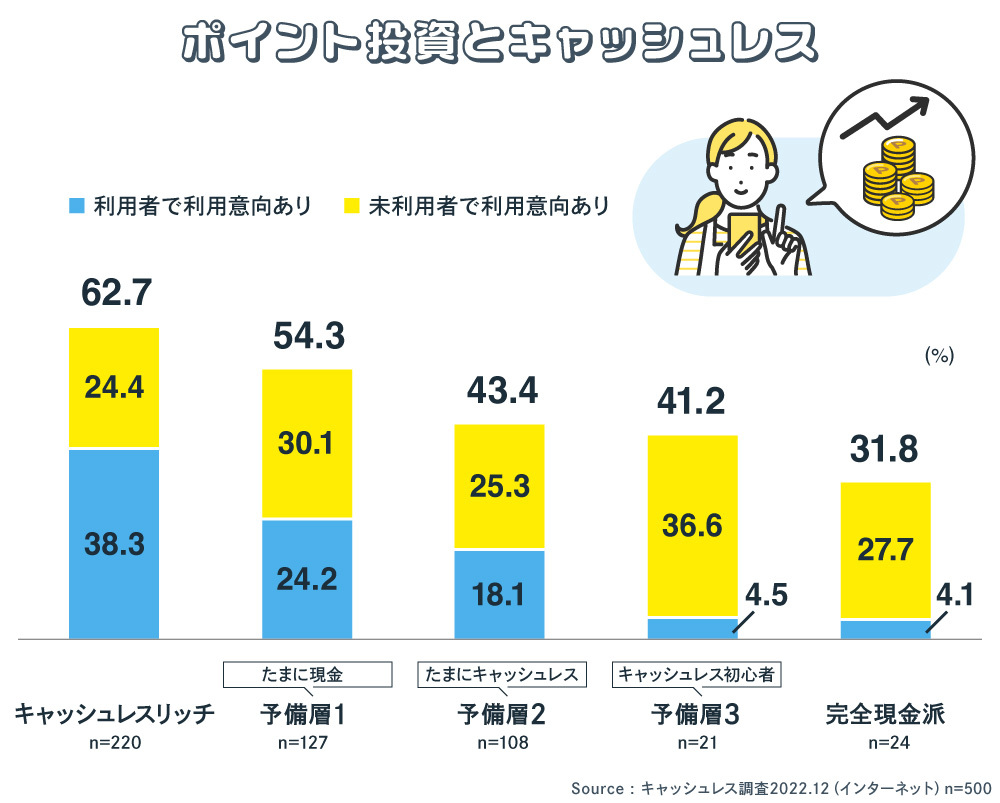
The group most likely to already use point investing and intend to continue doing so was Cashless Rich (38.3%). Next were Reserve Group 1 (occasional cash users) at 24.2% and Reserve Group 2 (occasional cashless users) at 18.1%.
The figure drops significantly to 4.5% for Reserve Group 3 (Cashless Beginners). The Pure Cash Group accounted for 4.1%. These results suggest a correlation between point investing and cashless usage.
Approximately 30% of respondents across all groups currently not using point investment expressed interest in trying it in the future. Using cashless payments makes it easier to accumulate points. A significant number of consumers likely believe that investing these points could potentially yield higher returns than bank deposits. This also presents an opportunity for payment service providers.
Offering point investment as a service could promote cashless adoption. For investment novices, committing spare cash to investments requires courage. However, using accumulated points might make it easier to accept any potential point loss. This creates a pathway: start practicing with point investment, and as you gain familiarity, gradually transition to full-scale investing.
Are Cashless Rich People Good Savers!?
What's the relationship between the ability to save money and cashless payments?
We asked whether people are good or bad at saving money.
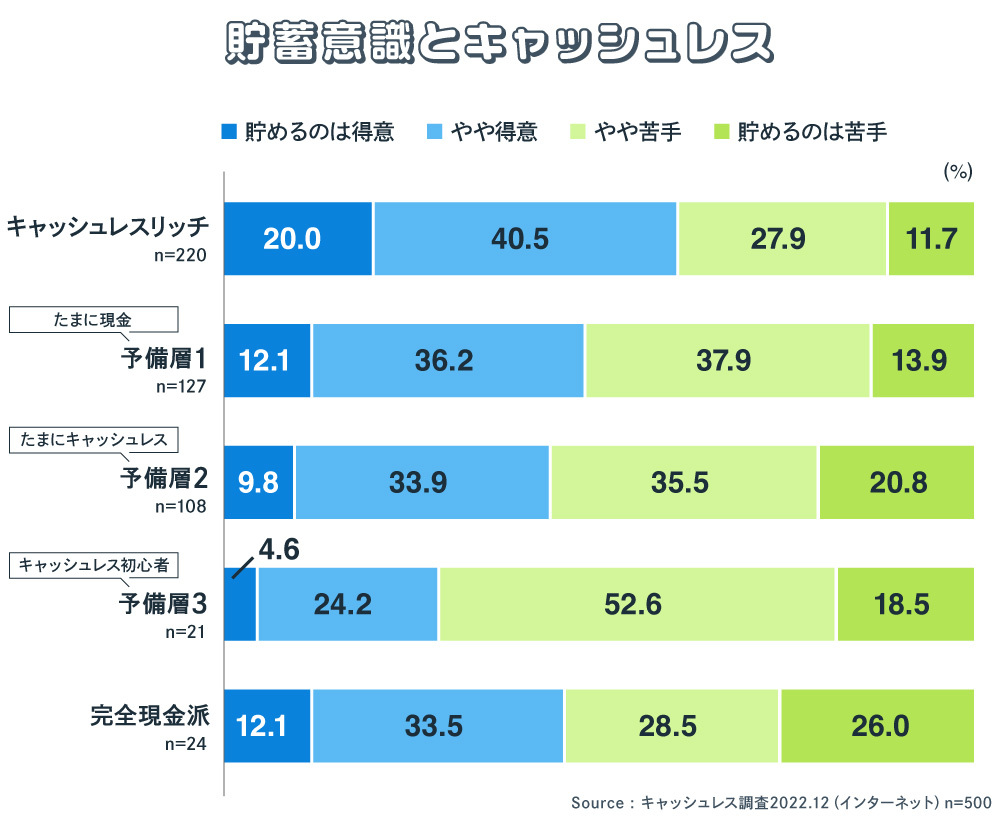
Looking at all respondents, 14.7% said they were good at saving money, while 36.9% said they were somewhat good at it. Combined, this group totals 51.6%. Those who were somewhat bad at saving accounted for 33.2%, and those who were bad at it accounted for 15.2%. This shows that the "good" group is slightly larger than the "bad" group.
Looking at the results by segment, the Cashless Rich group had the highest percentage (20.0%) of respondents who felt they were good at saving money. This perception tends to decrease in line with the order of the reserve groups.
Preparatory Group 1 (Occasional Cash Users) is closer to Cashless Rich, while Preparatory Group 2 (Occasional Cashless Users) and Preparatory Group 3 (Cashless Beginners) show a stronger tendency to be not good at saving. Among Pure Cash Users, 12.1% responded they are good at saving, but 26.0% (the highest proportion) responded they are not good at it. Adding those who are somewhat not good (28.5%), the "not good" group exceeds half.
Before conducting the survey, we had anticipated that the all-cash group would have a higher proportion of savers, as suggested by . This result was somewhat surprising. It may indicate that holding cash can sometimes lead to unexpected spending.
Does higher payment literacy lead to higher financial literacy!?
Recently, various platform providers offer mobile financial apps such as household budget software, internet banking services, investment, and lending. How many services does each user utilize, and which services are used most frequently?
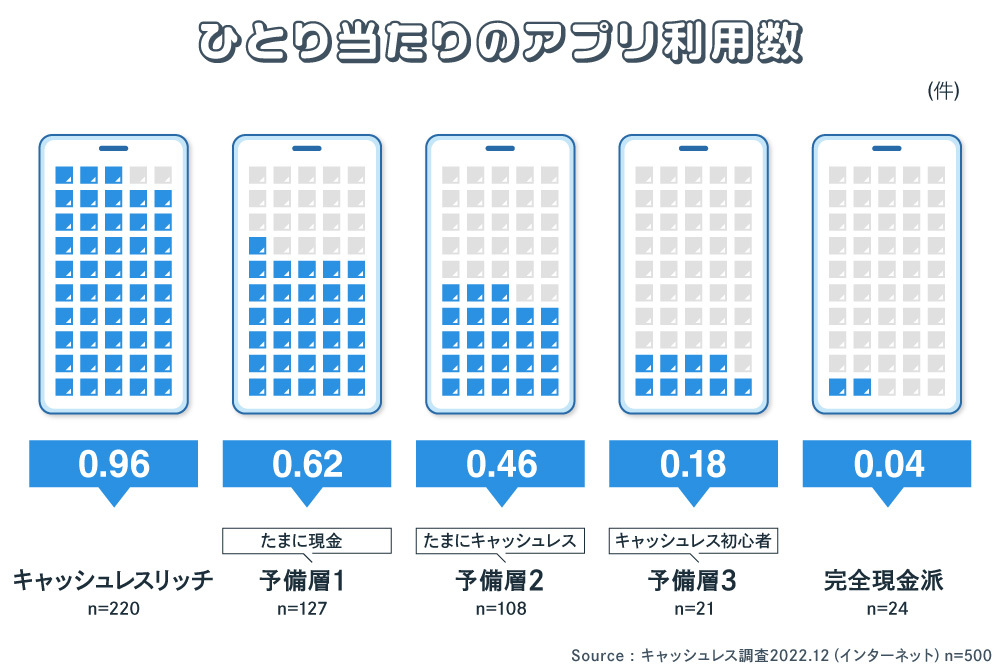
The average number of services used per person, including those who use "0" services, was 0.69. The most frequently used services were internet banking, followed by investment, household budgeting, loans, and insurance.
By segment, Cashless Rich users averaged the highest at 0.96 services per person. Pre-cash users (occasional cash) averaged 0.62, Pre-cash users 2 (occasional cashless) averaged 0.46, Pre-cash users 3 (cashless beginners) averaged 0.18, and Pure Cash users averaged 0.04.
It is evident that the higher the level of cashless involvement, the greater the number of mobile financial apps used per person.
How is "digital payroll" perceived?
In April 2023, regulations were lifted allowing payment of wages to accounts held with money transfer operators. Digital salary payments were introduced as part of institutional reforms aimed at promoting cashless transactions. We investigated general consumer awareness and usage intentions regarding digital salary payments.
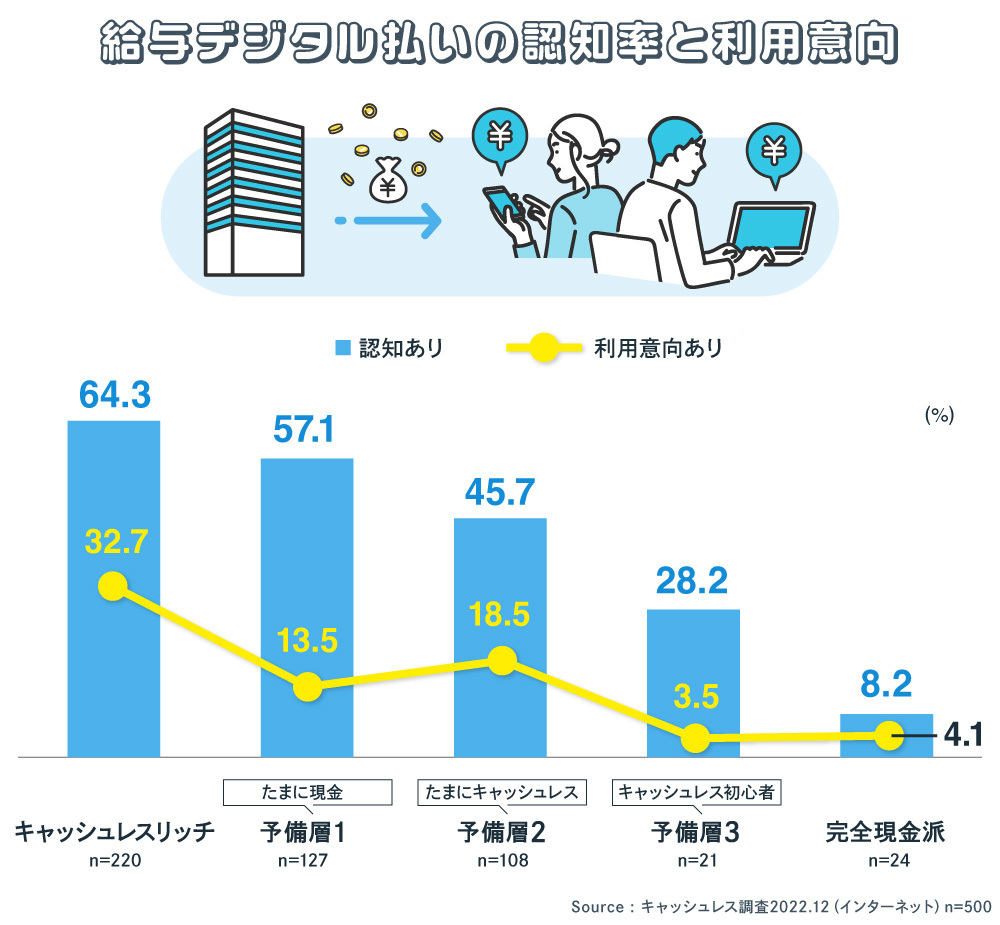
Regarding digital salary payments, awareness (combining those who "know the details" and those who "have heard of it") was found in one out of every two respondents (54.2%). By segment, awareness rates were higher among those more actively engaged with cashless payments. As expected, awareness of the details of digital salary payments was highest among the Cashless Rich, at 17.1%.
So, what about the intention to use digital salary payments? The combined average of those who answered "I definitely want to try it" and "I'd rather try it" was 22.1%.
The highest usage intent was among Cashless Rich users, at one in three (32.7%). Next were Reserve Group 2 (occasional cashless users) at 18.5% and Reserve Group 1 (occasional cash users) at 13.5%, forming a second group. Reserve Group 3 (cashless beginners) showed 3.5% intent, while Cash-Only users registered 4.1%, both indicating low levels of usage intent. The Cashless Rich group also had the highest percentage of respondents who "definitely want to try" (8.2%). In other words, the results show that the higher the level of cashless involvement, the higher both awareness and usage intent.
The progress of digital salary payments ( ) will undoubtedly become a tailwind for Japan's future cashless promotion, heightening attention on future developments.
Over half of the "occasional users" intend to increase cashless payments in the future
We asked respondents whether they plan to increase cashless payments for shopping in the future.
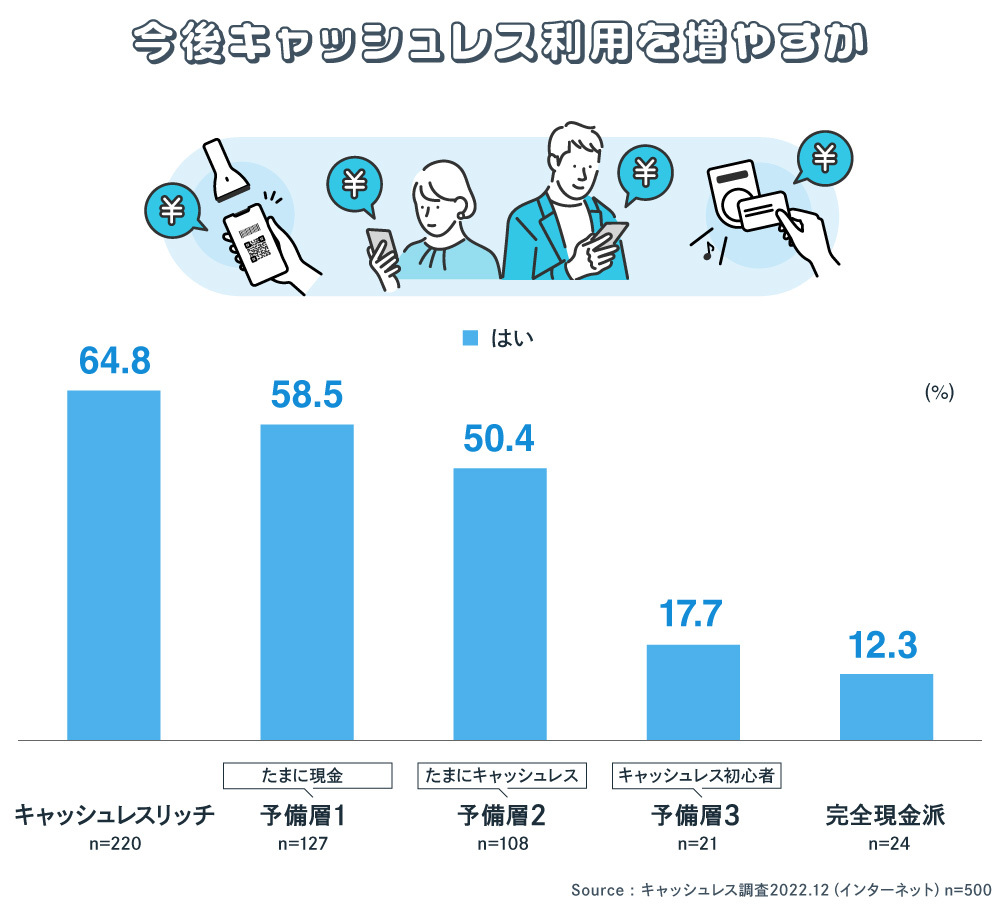
Among all respondents, 21.8% answered "increase significantly" and 33.8% answered "increase somewhat." Combined, 55.6% indicated they would increase their use. "About the same (no change)" was 43.1%, and "decrease" was 1.3%.
Analyzing this by cashless attribute reveals differences in enthusiasm for cashless payments. The highest enthusiasm for increasing cashless payments (combined "significantly increase" and "somewhat increase") was, unsurprisingly, among Cashless Rich (64.8%). Cashless Rich also had by far the highest proportion of respondents answering "significantly increase" compared to any other segment.
The enthusiasm gradually decreases: Pre-adopters 1 (occasional cash users) at 58.5%, and Pre-adopters 2 (occasional cashless users) at 50.4%. However, these two segments are large in number, suggesting potential for cashless adoption promotion. The fact that a majority of them expressed intent to increase cashless use is encouraging and raises expectations from the perspective of cashless promoters.
Preparatory Group 3 (Cashless Beginners) saw enthusiasm drop sharply to 17.7%. However, among the Pure Cash Users, 12.3% responded that they would increase cashless payments going forward, exceeding initial projections. This result indicates that even current Pure Cash Users show interest in moving towards cashless payments.
Cashless Rich: High Awareness and Action
This survey examined cashless usage patterns across five distinct segments. Analyzing the payment methods and services used within these cashless segments revealed clear differences across the five groups, as shown in the figure below.
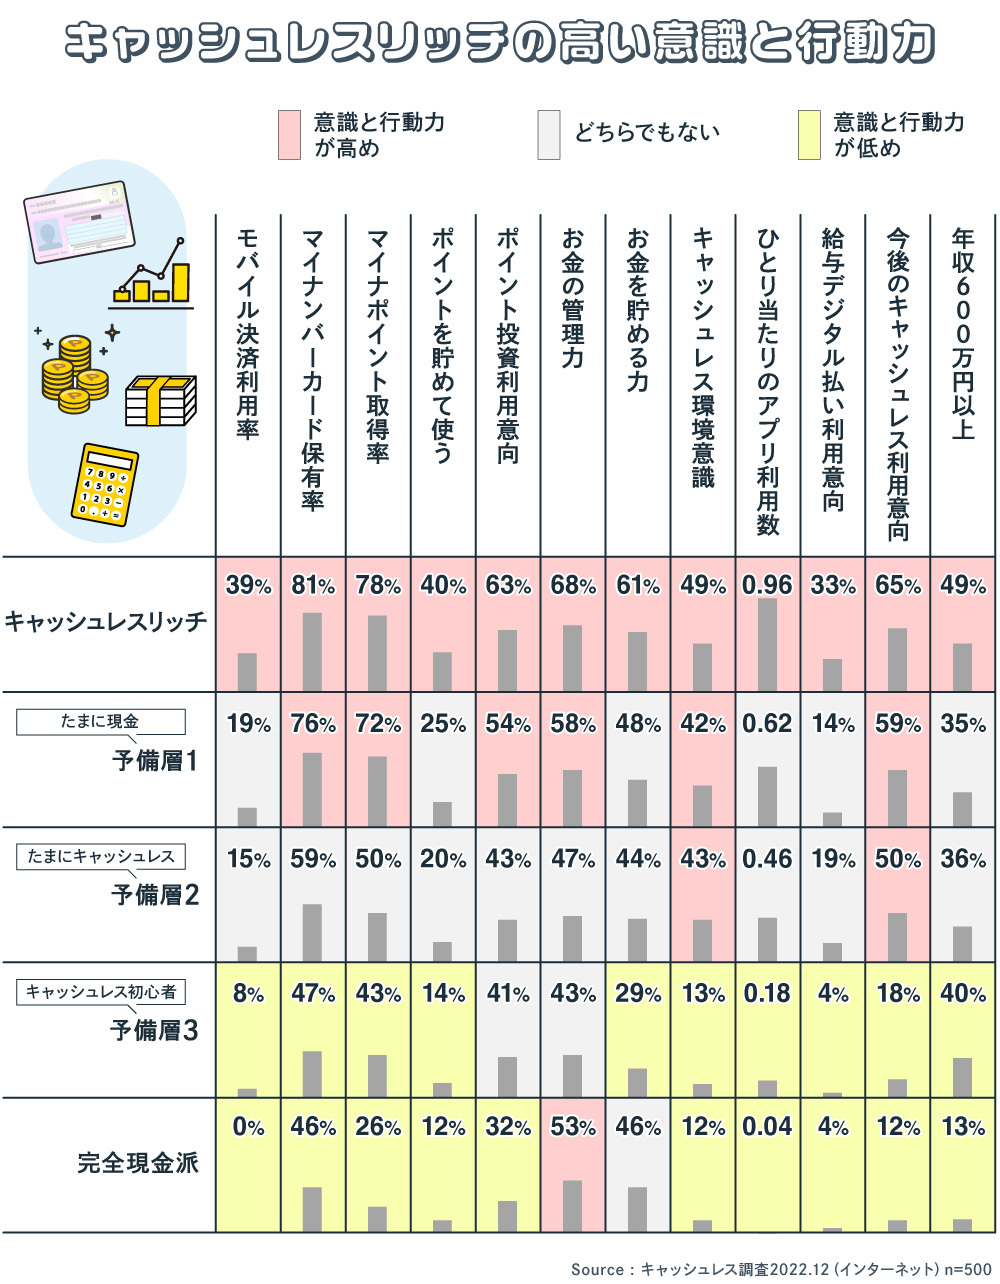
Cashless Rich exhibit relatively high awareness and action across all metrics. Pre-adopters 1 can be seen as a scaled-down version of Cashless Rich, while Pre-adopters 2 are a scaled-down version of Pre-adopters 1. Conversely, Pre-adopters 3 and Cash-Only Users show significantly lower awareness and action compared to these groups.
One notable point is that among the payment methods used, mobile payment usage was highest among Cashless Rich. As cash payment usage increases, mobile payment usage decreases. This suggests that promoting mobile payments is likely a key factor for advancing cashless payments in Japan.
The second item, the My Number Card, is a tool for identity verification. Many cashless payment services require identity verification, and it is mandatory for digital salary payments. Therefore, the target audience for these services remains the Cashless High Engagement group.
Cashless Rich also show higher levels of initiative in accumulating and using points, creating a virtuous cycle: "They combine accumulated points with cashless payments and reinvest the rewards back into points."
Furthermore, Cashless Rich individuals also show higher actual usage and intent to invest using these points. If we could explain how to effectively utilize such points more clearly to those classified as Reserve Group 1 and Reserve Group 2, cashless usage would likely increase.
Cashless Rich individuals also felt they were skilled at managing money and saving. Their high usage rate of financial apps further suggests that heavy cashless users have a strong overall awareness of money matters. It also indicates they are adept at using financial apps effectively. Since they showed strong enthusiasm for digital salary payments, this area presents a major approach point for further promoting cashless payments.
Furthermore, if the characteristics of cashless-rich users revealed in this survey, along with the advantages in savings and point usage, can be effectively communicated to the potential user base, Japan's cashless promotion efforts could accelerate significantly.
Next time, we will share insights on the attitudes of store owners toward cashless payments while also uncovering hints for future cashless payment promotion.
[Survey Overview]
Title: "Cashless Awareness Survey of Consumers"
Survey Method: Online survey
Survey Period: December 12-15, 2022
Survey Area: Nationwide
Survey Participants: 500 men and women aged 20–69 (weighted based on population composition)
Survey Sponsor: Dentsu Inc., Dentsu Cashless Project
Survey Company: Dentsu Macromill Insight, Inc.

Was this article helpful?
Share this article
Newsletter registration is here
We select and publish important news every day
For inquiries about this article
Back Numbers
Author
Yoshitomi Sairyo
Dentsu Inc.
BX Creative Center, Experience Design Department
Senior Planning Director
Head of the Dentsu Cashless Project. Joined Dentsu Inc. after working at a U.S.-based consulting firm and a European investment bank. Engaged in new business development, marketing and brand strategy, and PR for clients in finance (banks, securities, insurance, etc.), telecommunications, automotive, beverages, toiletries, and pharmaceuticals. Contributions include "Corporate Reputation" (Advertising) and "CSR and Corporate Reputation" (Nikkei Branding). Certified Member of the Securities Analysts Association of Japan.

