Note: This website was automatically translated, so some terms or nuances may not be completely accurate.
"Medium-sized," "Shopping district-based," "30s" are the keywords!? What are the challenges for stores in promoting cashless payments?
What is the actual state of cashless usage in Japan?
Dentsu Inc.'s Cashless Project, a team supporting marketing strategies in the payment domain, conducted an online "Cashless Awareness Survey of Consumers" in December 2022. The survey examined how consumers used cashless payments in their daily lives over the preceding year. ( Survey overview here )
This series explores insights for promoting cashless payments in Japan based on the survey results.
This installment examines the characteristics and adoption status of stores accepting cashless payments (hereafter "merchants") while also considering future approaches for stores yet to adopt cashless payment systems.
Reference Series:Cashless Japan Survey 2021: DX Driven by Cashless
<Table of Contents>
▼What is the Current State of Small and Medium-Sized Businesses Accepting Cashless?
▼Slow Progress in Cashless Payment Adoption
▼"Mobile QR Code Payments" Top Payment Methods Chosen by SMBs
▼Top Reasons for Cashless Adoption: "Customer-Oriented"
▼Characteristics of Non-Cashless Stores and Effective Approaches?
What is the current state of SMEs accepting cashless payments?
In previous installments, we examined the realities of cashless users through surveys. So, what exactly is the current situation for merchants accepting cashless payments?
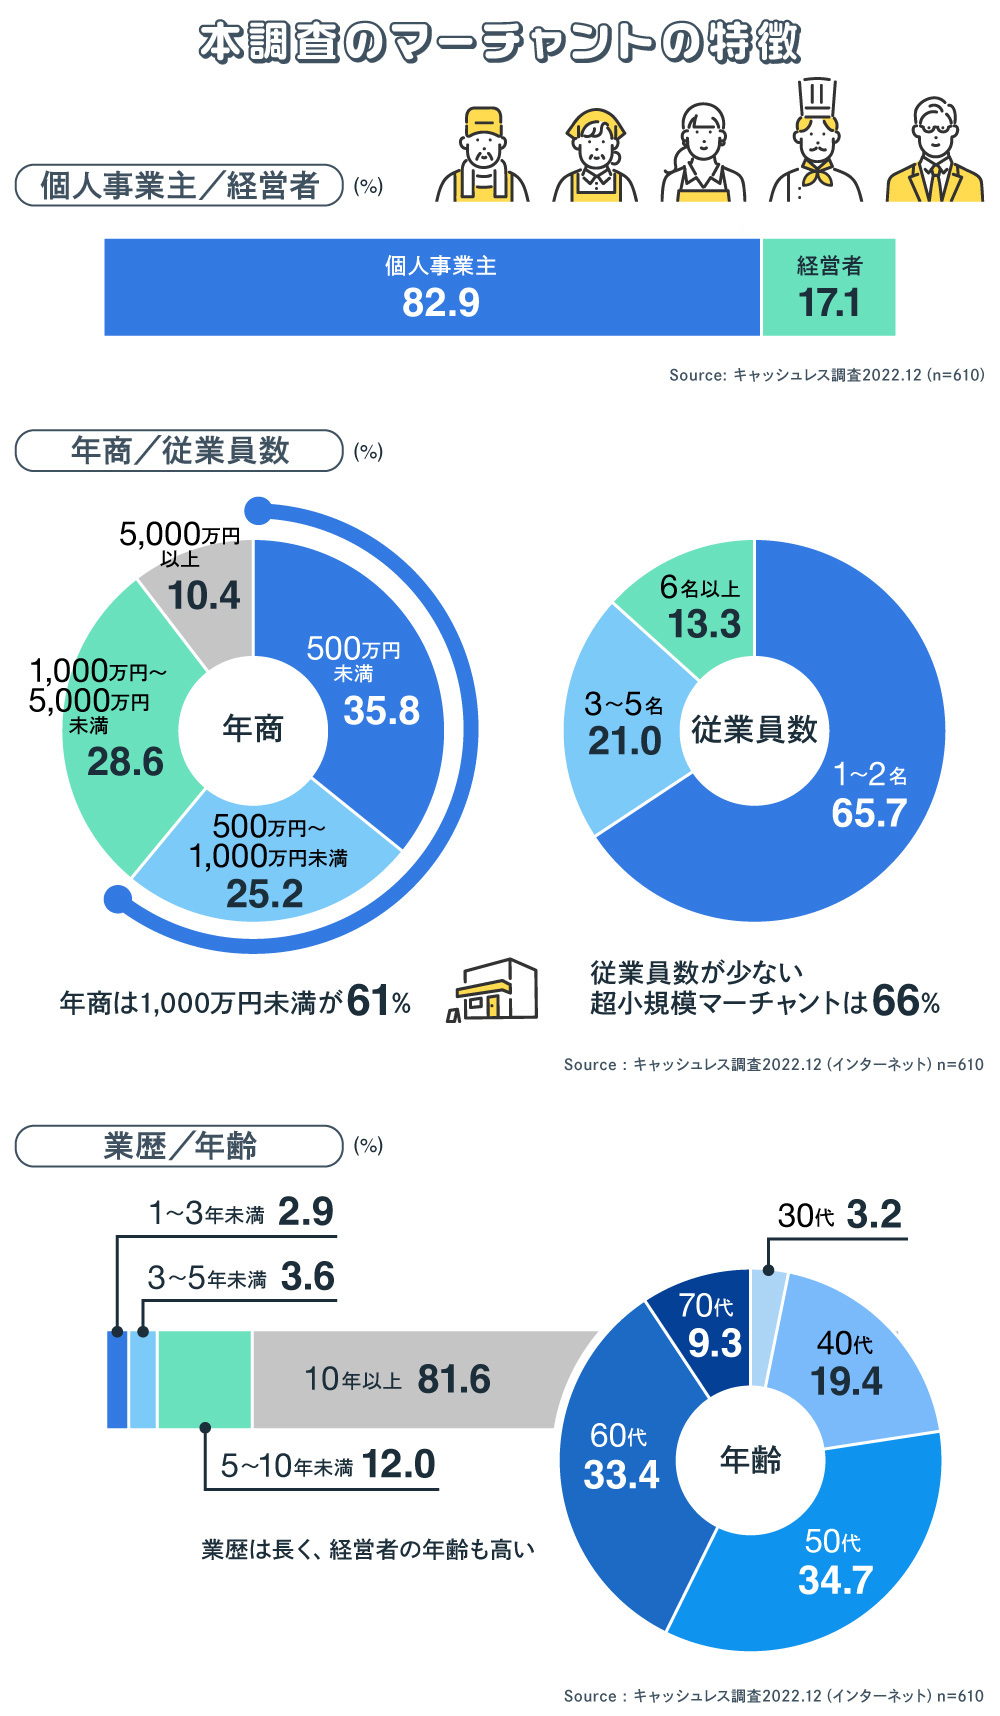
This time, we conducted an online survey targeting 610 merchants. By business type, 250 were retailers and 360 were restaurants. Among these, 82.9% (506) were sole proprietors, while the remaining 17.1% (104) were owners of small and medium-sized businesses.
Classified by annual sales: * Under ¥5 million: 35.8% * ¥5 million to under ¥10 million: 25.2% * ¥10 million to under ¥50 million: 28.6% * ¥50 million or more: 10.4%
Micro-businesses with annual sales under ¥10 million accounted for 61.0%, a situation reflected in employee numbers: 65.7% had "1 to 2 employees," 21.0% had "3 to 5 employees," and 13.3% had "6 or more employees." Plotting annual sales and employee numbers on a pie chart reveals a clear correlation between the two. The most common business tenure was "10 years or more" at 81.6%. This was followed by "5 to less than 10 years" (12.0%), "3 to less than 5 years" (3.6%), and "1 to less than 3 years" (2.9%).
Regarding the age of business owners, 42.7% were in their 60s or older, and 77.4% were in their 50s or older. This indicates an aging trend among merchant business owners.
Slow Progress in Cashless Payment Adoption
So, how has the ratio of stores adopting cashless payments changed?
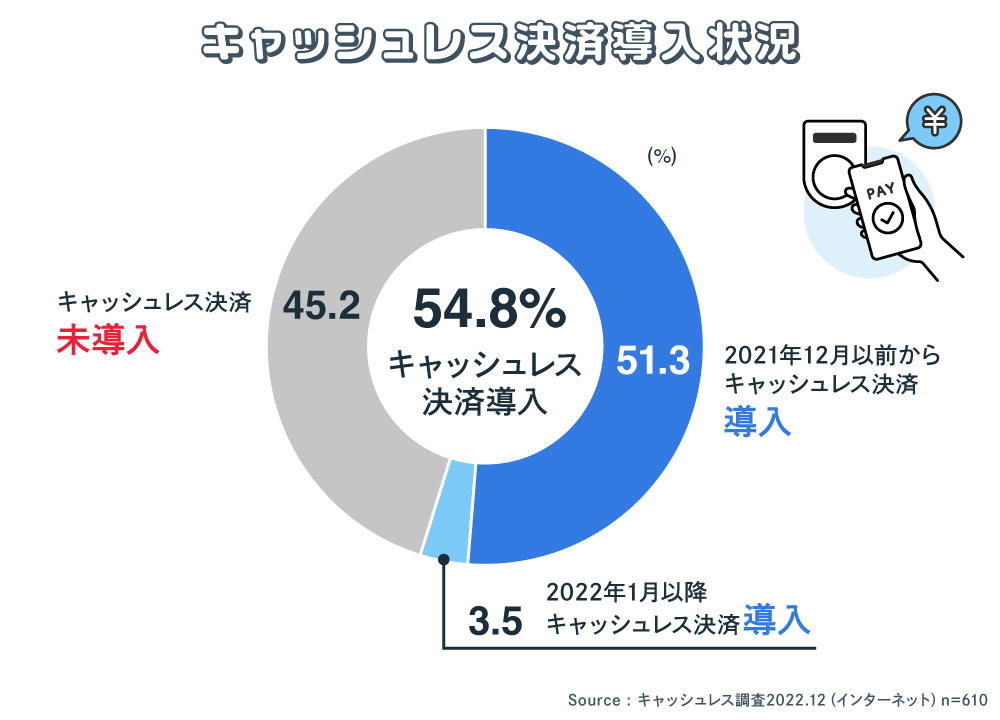
Survey results show that 51.3% of stores had adopted cashless payments before December 2021, while 3.5% adopted them after January 2022.
Overall, 54.8% of stores have adopted cashless payments. However, the increase over the entire year of 2022 was only 3.5%. While cashless payments expanded rapidly in many other countries due to the COVID-19 pandemic, merchants in Japan who have not yet adopted cashless payments still account for 45.2%.
Although the figure has fallen below 50%, why is cashless payment adoption progressing so slowly in Japan? To unravel the reasons, we first examined the adoption status by annual sales volume.
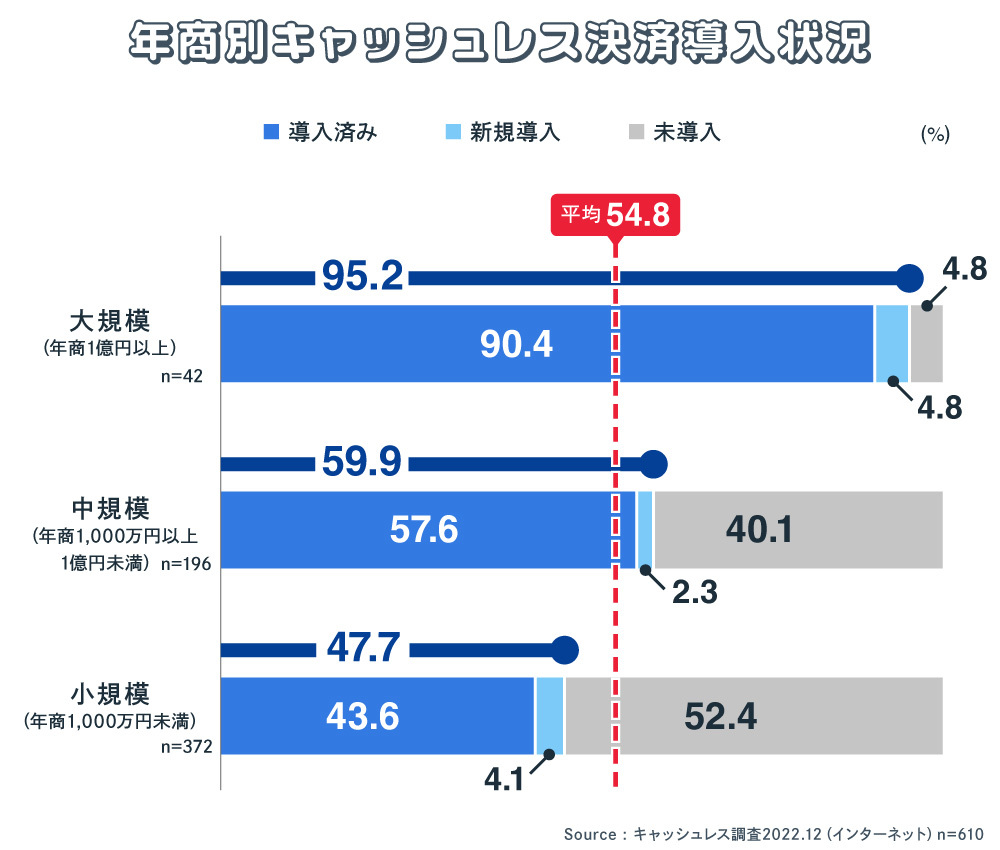
The graph shows that the slowest adopters are currently smaller-scale stores. The cashless payment adoption rate among small businesses with annual sales under ¥10 million was only 47.7%, even including new adopters. This segment makes up a large 61% of the total, significantly dragging down the average.
For medium-sized businesses with annual sales between ¥10 million and ¥100 million, 59.9% have adopted cashless payments. This segment constitutes 32% of the total. Furthermore, 95.2% of large businesses with annual sales exceeding ¥100 million have already adopted cashless payments.
If considering cashless payment adoption approaches based on annual sales, medium-sized businesses might be the logical starting point. While their adoption rate is higher than the overall average, 40% of stores still haven't adopted it. Given they also account for 32% of the total, leveraging cashless payment examples within the same industry could potentially make adoption easier to promote.
Conversely, the adoption gap among small businesses exceeds half, at 52.4%. Currently, more initiatives are promoting cashless payments for small businesses by revitalizing entire shopping districts. Rather than pushing individual stores, creating a sense of "if other stores adopt it, we should too" might make adoption easier for store owners.
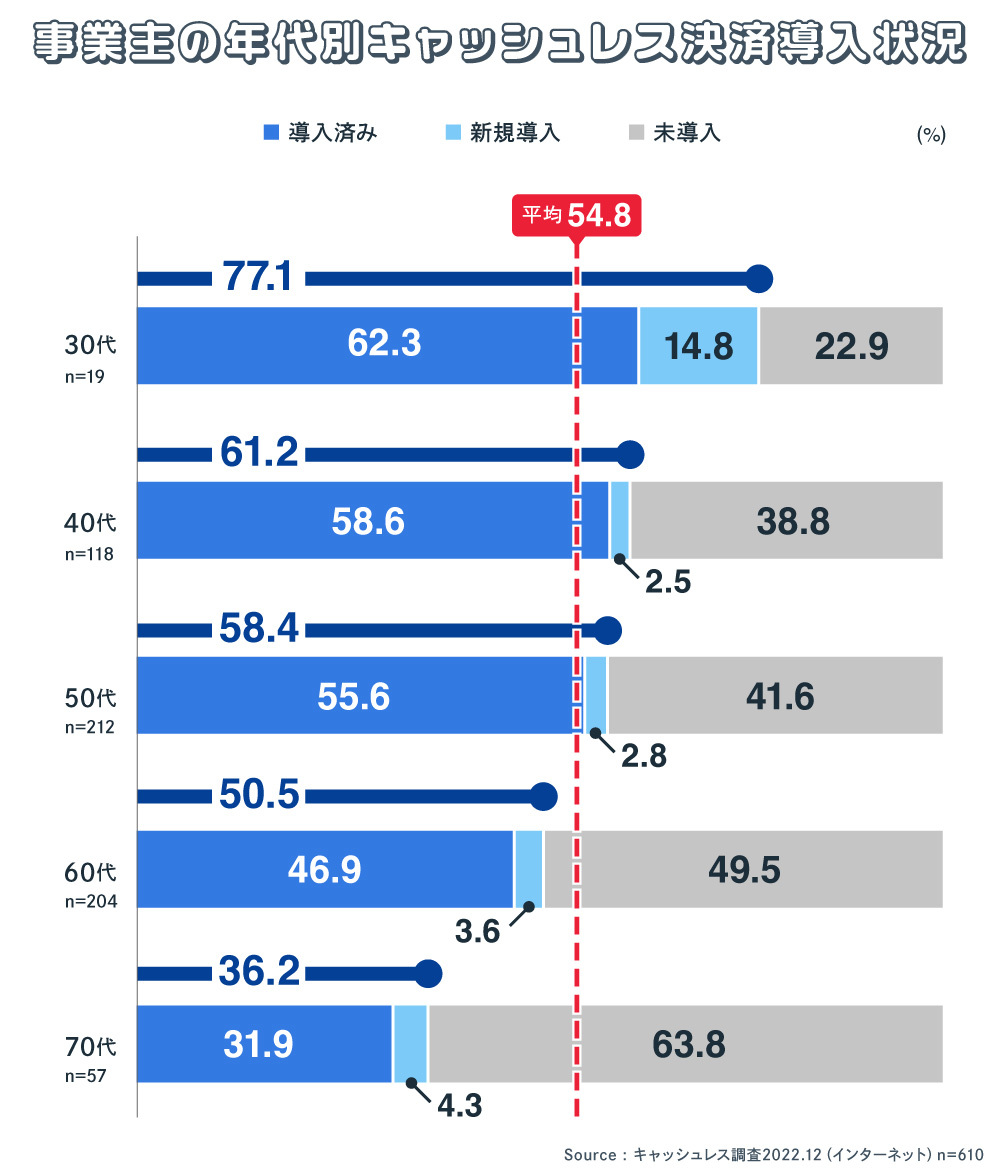
Looking at the adoption rates of cashless payments among individual business owners and shop managers by age group, the adoption rate decreases with age. Among shops managed by those in their 30s, 77.1% have adopted cashless payments. Of these, 14.8% adopted it in 2022.
The adoption rate was 61.2% for those in their 40s, 58.4% for those in their 50s, 50.5% for those in their 60s, and 36.2% for those in their 70s. It seems that the older the business owner, the more difficult it may be to change the long-established habit of conducting business with cash. For older sole proprietors and business owners to shift from cash to cashless payments, the concrete benefits need to be more widely understood and permeate their thinking.
Mobile QR Code Payments Top Small Business Payment Choices
Among merchants already using cashless payments, we surveyed which payment methods they adopted: "Mobile QR Code Payment," "IC Card Payment," "Contactless Credit Card Payment," "Electronic Money," and "Mobile Contactless Payment." For "Mobile QR Code Payment," we asked about six major brands.
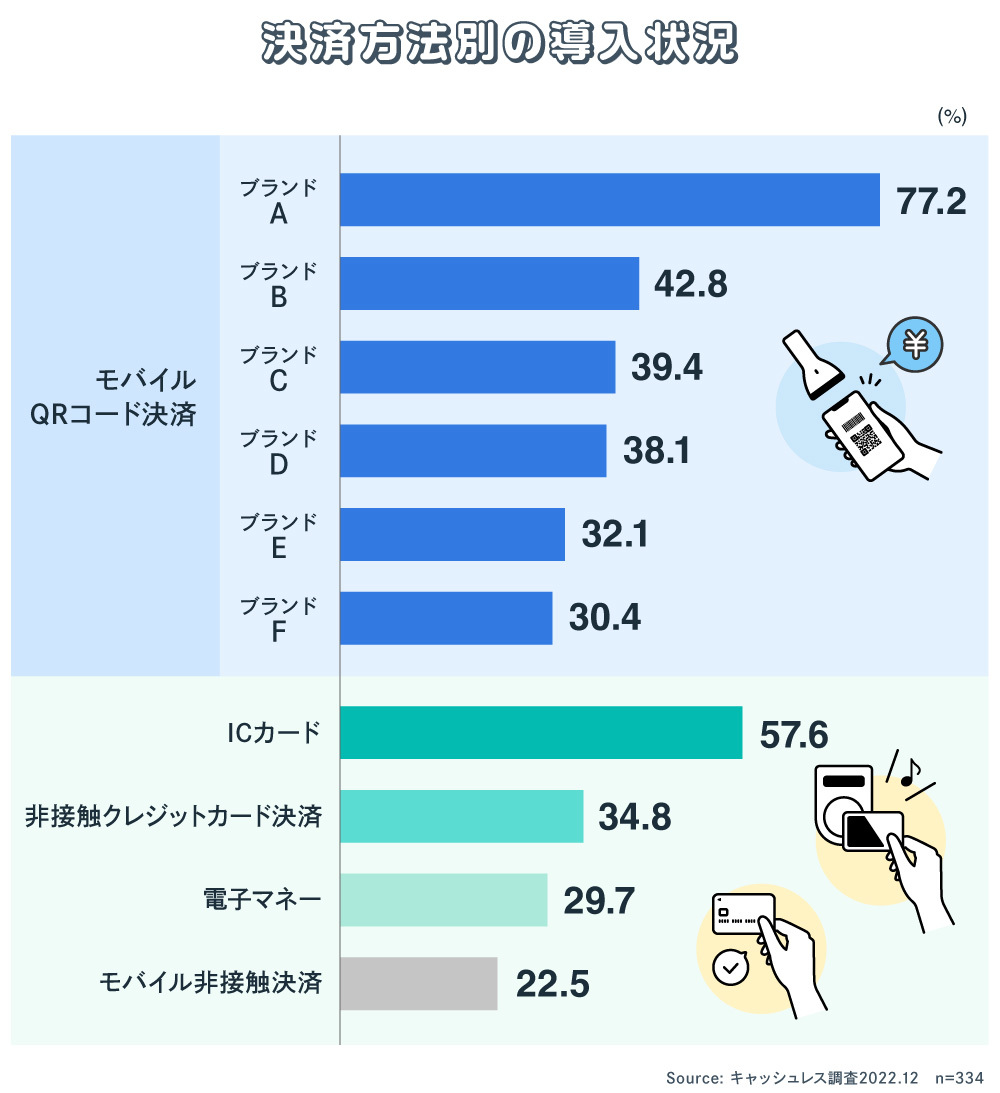
The most widely adopted was Mobile QR Code Payment Brand A (77.2%). Among small and medium-sized merchants, primarily sole proprietors, mobile QR code payments are overwhelmingly favored. IC card payments followed at 57.6%.
The higher adoption rate of mobile QR code payments compared to IC card payments is primarily attributed to ease of implementation. For payment methods where the merchant displays a QR code, initial setup costs are free. Merchants can start simply by placing a QR code sticker next to the register. Additionally, transaction fees are lower than those for card payments.
Regarding other cashless payment adoption rates: contactless credit card payments stand at 34.8%, e-money at 29.7%, and mobile contactless payments at 22.5%. Contactless credit card payments have a higher adoption rate than e-money, reflecting the heightened interest in contactless payments, which became more pronounced during the COVID-19 pandemic.
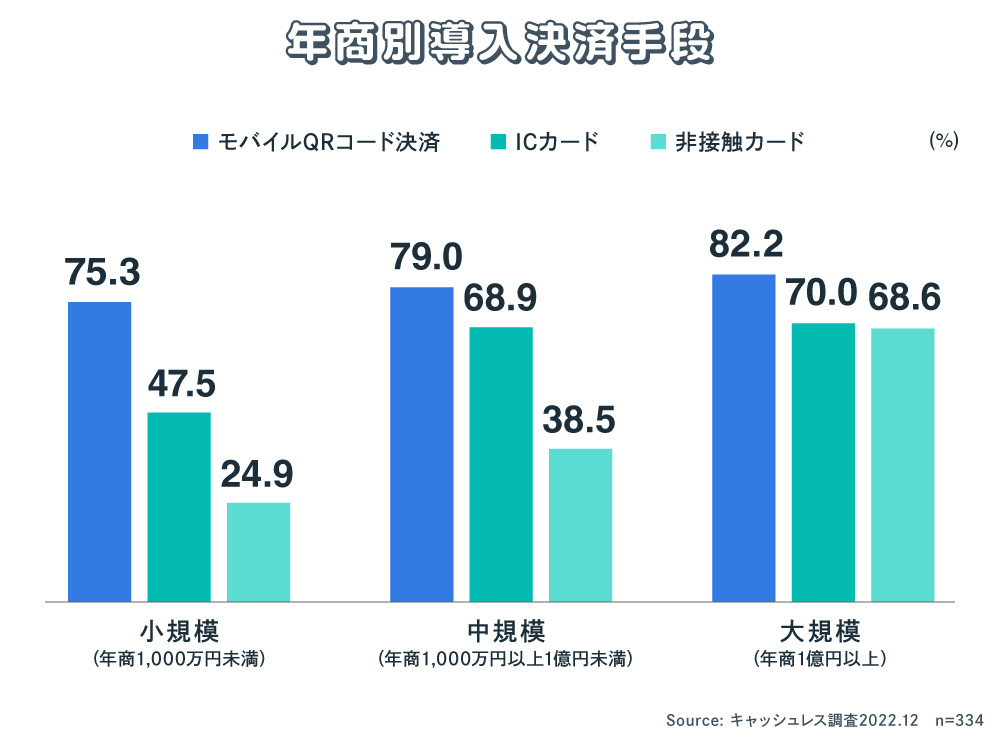
Furthermore, we compared the adoption rates of mobile QR code payments and card payments by annual sales volume. Card payments were calculated separately for IC cards and contactless credit cards.
Small businesses (annual sales under ¥10 million) showed high adoption of mobile QR code payments (75.3%), while IC cards were adopted by less than half (47.5%). Contactless credit cards were adopted by roughly one in four (24.9%).
Medium-sized businesses (annual sales between ¥10 million and ¥100 million) show adoption progressing not only for mobile QR code payments (79.0%) but also for IC cards (68.9%). Contactless credit cards, a relatively new payment method, stood at 38.5%. For large businesses (annual sales of ¥100 million or more), adoption rates are high for all three payment types: mobile QR codes at 82.2%, IC cards at 70.0%, and contactless credit cards at 68.6%.
Mobile QR code payments show a high adoption rate regardless of annual sales size. For small businesses in particular, mobile QR code payments appear to be the first step toward cashless payment adoption due to their low cost.
Top reason for cashless adoption: "Customer-oriented"
Among small and medium-sized businesses, primarily sole proprietors, 54.8% have adopted cashless payments. We asked merchants who introduced cashless payments in 2022 about their reasons for doing so.
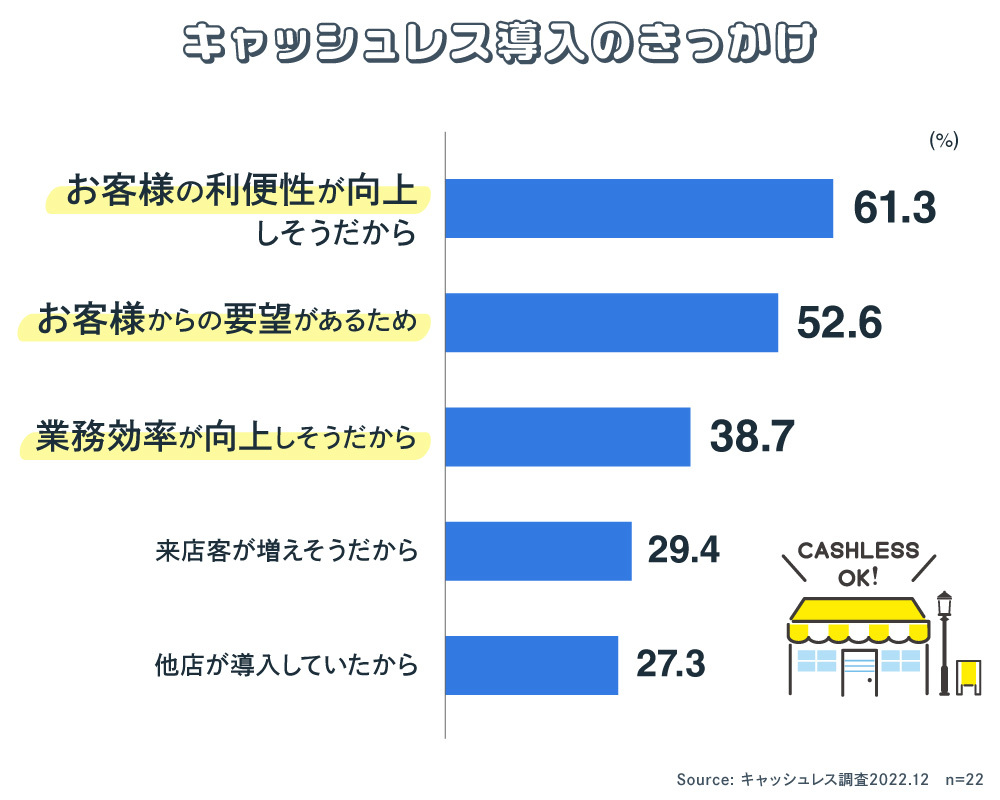
The most common reason was "to improve customer convenience" (61.3%). Second was "due to customer requests" (52.6%). Both indicate customer-driven adoption of cashless payments. If customers consistently voice requests like "Please enable cashless payments," it's clear that merchants will likely take action. Customer requests to merchants may be the most effective driver for cashless adoption.
Characteristics of Cashless-Unadopted Stores and Effective Approaches?
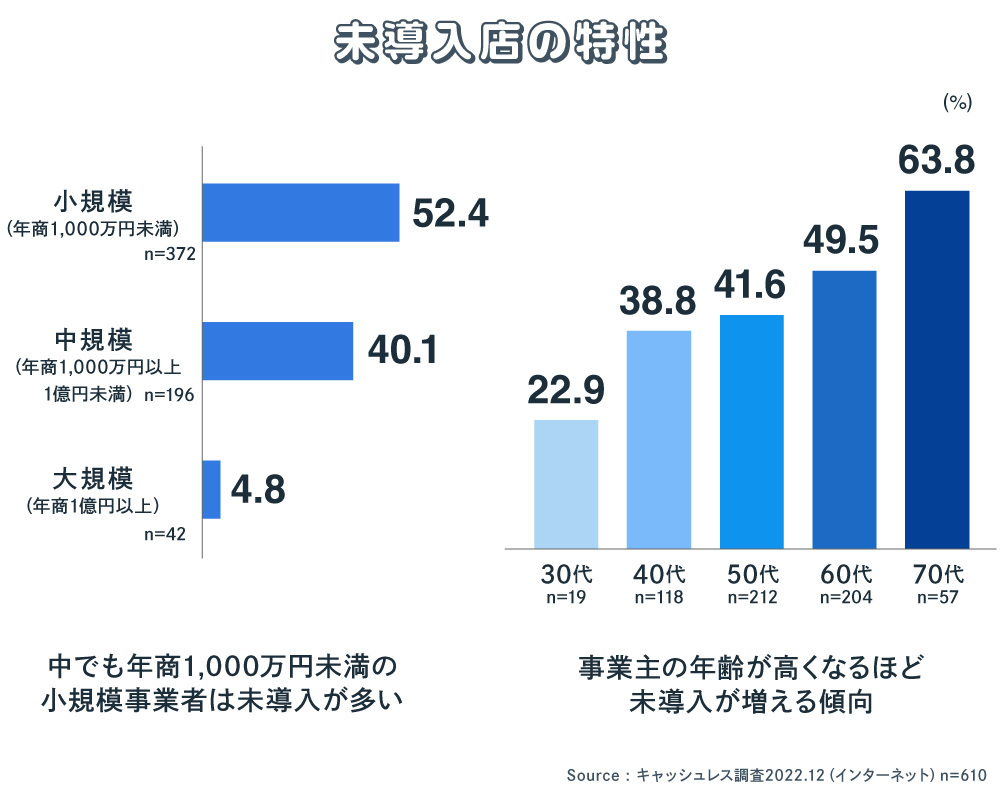
According to this survey, 45.2% of businesses had not yet adopted cashless payments. While this means cashless-unadopted stores now account for less than half of all businesses, it still indicates significant challenges remain for promoting cashless adoption among merchants. Finally, let's revisit and summarize approaches for reaching unadopted stores, based on the survey results.
First, the annual sales characteristics of non-adopting stores are evident. Among the survey respondents, medium-sized businesses with annual sales between ¥10 million and ¥100 million accounted for 32% of the total segment composition, yet 40.1% of them had not adopted cashless payments. This segment, possessing a certain level of annual sales scale, represents an easier target for payment service providers to approach.
Furthermore, small businesses with annual sales under ¥10 million represent the highest segment ratio at 61%. Among these, 52.4% have not adopted cashless payments. Given their high proportion, advancing cashless acceptance in this segment could significantly break down barriers hindering Japan's cashless push.
Approaching each small and micro business individually to encourage cashless adoption is quite labor-intensive. Therefore, a more effective approach might be to simultaneously and comprehensively educate small and micro businesses within specific areas, such as entire shopping districts.
Furthermore, a correlation was found between the age of the business owner and the store's cashless adoption rate. As the owner's age increases, the rate of non-adoption also tends to rise. From the perspective of increasing adoption rates, it may be a wise strategy to approach stores owned by younger business owners, who tend to be more flexible and open to digitalization.
Next time, we will explore the adoption benefits experienced by merchants who have already implemented cashless payments, examine changes in actual cashless usage patterns, and consider the challenges faced by non-adopting stores.
[Survey Overview]
Title: "Cashless Awareness Survey of Consumers"
Survey Method: Online survey
Survey Period: December 12-15, 2022
Survey Area: Nationwide
Survey Participants: 610 male and female store owners aged 20–79
Survey Sponsor: Dentsu Inc., Dentsu Cashless Project
Survey Company: Dentsu Macromill Insight, Inc.

Was this article helpful?
Share this article
Newsletter registration is here
We select and publish important news every day
For inquiries about this article
Back Numbers
Author

Yoshitomi Sairyo
Dentsu Inc.
BX Creative Center, Experience Design Department
Senior Planning Director
Head of the Dentsu Cashless Project. Joined Dentsu Inc. after working at a U.S.-based consulting firm and a European investment bank. Engaged in new business development, marketing and brand strategy, and PR for clients in finance (banks, securities, insurance, etc.), telecommunications, automotive, beverages, toiletries, and pharmaceuticals. Contributions include "Corporate Reputation" (Advertising) and "CSR and Corporate Reputation" (Nikkei Branding). Certified Member of the Securities Analysts Association of Japan.

