Note: This website was automatically translated, so some terms or nuances may not be completely accurate.
Remote work models surge to over 5 times pre-pandemic levels! Changes seen across 11 lifestyle types
Dentsu Inc. Media Innovation Lab published the " Information Media White Paper 2023 " on March 1st.
The lead feature, "What We Need to Know Now: The Past, Present, and Future of Media and Society," explains trends in the information media market and people's behaviors across the following four articles:
- Changes in Daily Life Before and After the Pandemic: Insights from Social Sequence Analysis
- "Japan's Advertising Expenditures" - Looking Back Over 75 Years
- Video Research Ltd.'s 60 Years of "TV Viewership Ratings" and the Future
- The Impact of Generative AI on the Media and Content Industry
This series introduces parts of the lead feature content. Part 1 focuses on "1. Changes in Daily Life Before and After the Pandemic: Insights from Social Sequence Analysis," examining how people's lifestyles changed due to the pandemic.
<Table of Contents>
▼Understanding Changes in Lifestyle Behavior Through "Social Sequence Analysis"
▼The 11 Clusters Revealed by Lifestyle and Media Usage Behavior
▼Examples of Different Behavioral Patterns by Cluster
▼Changes in People's Lifestyles Seen in Cluster Composition Ratios
Understanding Changes in Daily Life Through "Social Sequence Analysis"
As momentum builds toward normalizing social activities following the spread of COVID-19, grasping the full picture of people's lifestyle behaviors remains challenging. While a return to pre-pandemic life is being pursued, some individuals have adopted new lifestyles, such as remote work, which are becoming established.
To understand how people's behaviors changed during the pandemic, it is necessary to grasp their actions from both macro and micro perspectives and track changes over time. Furthermore, to gain a multidimensional understanding of diverse lifestyles and the processes of change, an approach that does not rely solely on metrics like "averages" is required.
Therefore, Dentsu Inc. Media Innovation Lab collaborated with Video Research Ltd.'s "Human Research Institute" to analyze consumer behavior using "Social Sequence Analysis" applied to data from their diary-style lifestyle survey "MCR/ex" ( survey overview here ).
This analysis aimed to categorize behavioral patterns within the flow of daily time. "MCR/ex" records daily activities in 15-minute intervals along a time axis for a specific week. This allows us to visualize how the share of daily activities performed by people changes over the course of a day, as shown in Figure 1.
A statistical analysis method for examining ordered data such as events or state changes. "Social" refers to society, and "sequence" means order. Developed as a technique for analyzing gene sequences, its application has expanded to social survey data analysis.
For more details on , see here:
・Media Behavior Data ×
This analysis examined the media usage and daily activities of men and women aged 12 to 69 living within a 50km radius of Tokyo, in the Kansai region, and in the Nagoya region at three points in time: June 2018, June 2020, and June 2022 (sample sizes: 7,764 in 2018, 7,948 in 2020, 2022: 7,575).
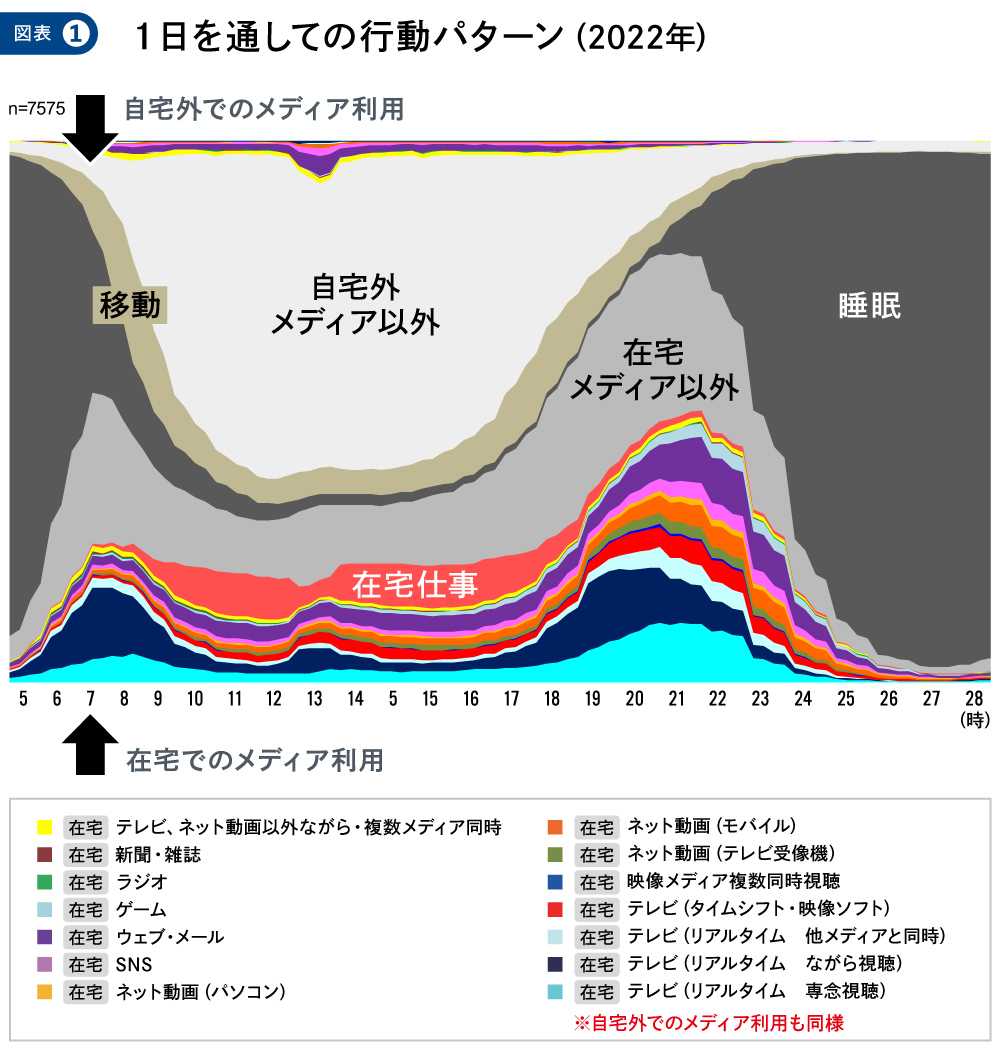
Figure 1 shows the daily activity patterns of all individuals on weekdays in 2022. It illustrates how much time is spent on activities like sleep, work at home (including part-time jobs), and media usage both inside and outside the home during different time periods. Contact rates for each media type are displayed as stacked bars. Contacts at home are shown at the bottom of the graph, while contacts outside the home are shown at the top, reversed. The shape reveals that media use primarily occurs at home, with patterns showing peaks in the morning, afternoon, and evening.
This social sequence analysis combined behavioral data recorded at 672 time points (7 days × 24 hours × 4 [15-minute intervals]) in "MCR/ex" with this analytical method, enabling the extraction of 11 distinct clusters characterized by different behavioral patterns.
It is already known that diverse lifestyles exist in society. What does this tell us? In fact, the greatest value of this analysis lies in its ability to visualize, based on data, the scale and nature of existing lifestyles by examining the flow of daily time. Furthermore, since this analysis covers behavioral data from three time points—2018, 2020, and 2022—it also allows us to understand the changes in daily life triggered by COVID-19 and the degree to which these changes have become established.
The 11 Clusters Revealed by Daily Activities and Media Usage
Figure 2 outlines the 11 extracted clusters. These 11 clusters can be broadly grouped into four categories based on their tendencies.
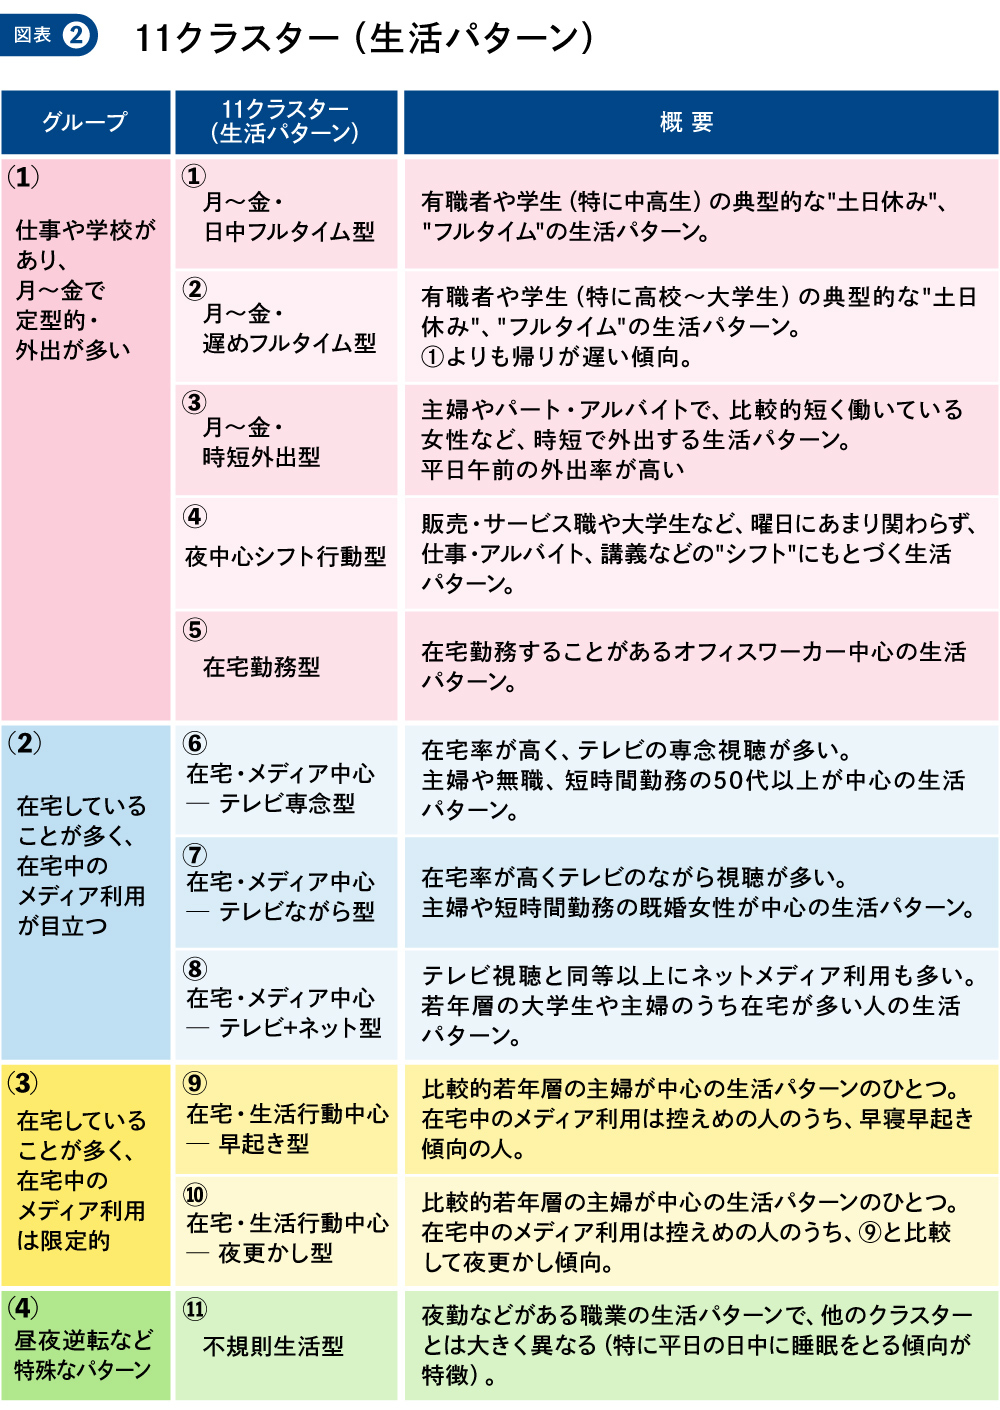
The largest group in terms of composition ratio in all three time points is "(1) Work or School Attendance, Routine Monday-Friday Outings." This group consists of five distinct clusters differing in tendencies such as the times of day they go out and the duration of their outings. The cluster "⑤ Remote Work Type," which will be introduced in detail later, also belongs to this group.
Those who are often at home during the day are divided into two groups based on their media engagement at home: "(2) Often at home, with prominent media use while at home" and "(3) Often at home, but limited media use while at home." Additionally, a very small number exhibit significantly different sleep patterns compared to other clusters due to factors like night shifts, forming the "(4) Special patterns such as reversed day-night cycles" group.
Examples of Different Behavioral Patterns by Cluster
Each cluster is characterized by its distinct behavioral patterns. Let's examine the 2022 profiles of two representative clusters in detail.
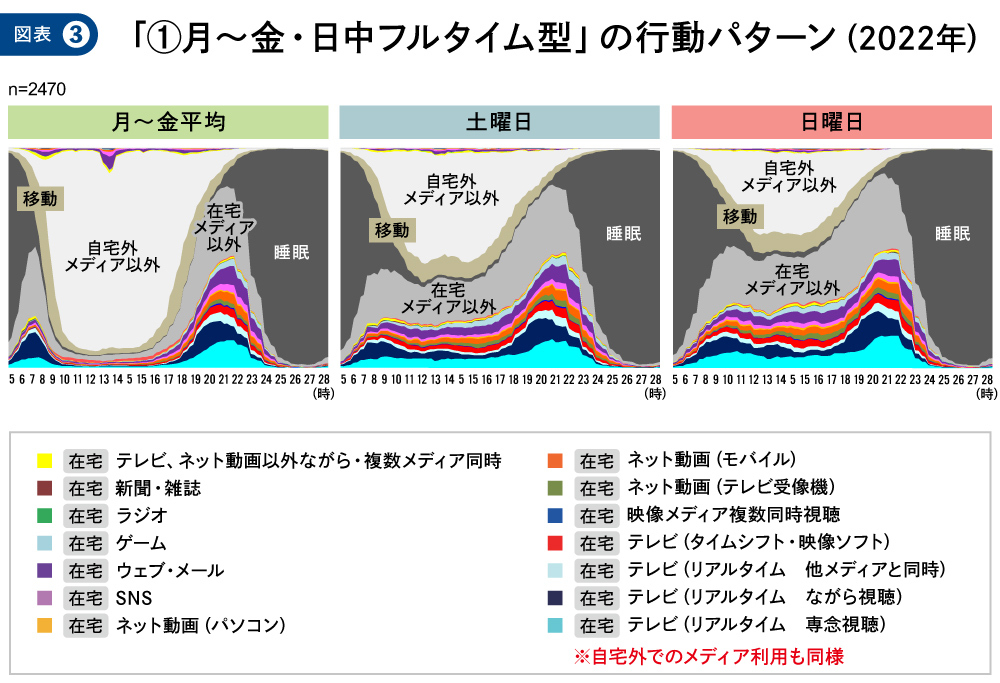
First, the largest cluster in scale: the "① Full-time Daytime Pattern (Mon-Fri)" (Figure 3). This represents the typical behavior pattern of employed individuals with weekends off and students, primarily middle and high school students. This group tends to be out during weekday daytime hours, frequently using the internet outside the home during times presumed to be commuting/commuting to school and lunch breaks. On weekends, they tend to wake up slightly later than on weekdays and often engage in various activities, including media use, at home.
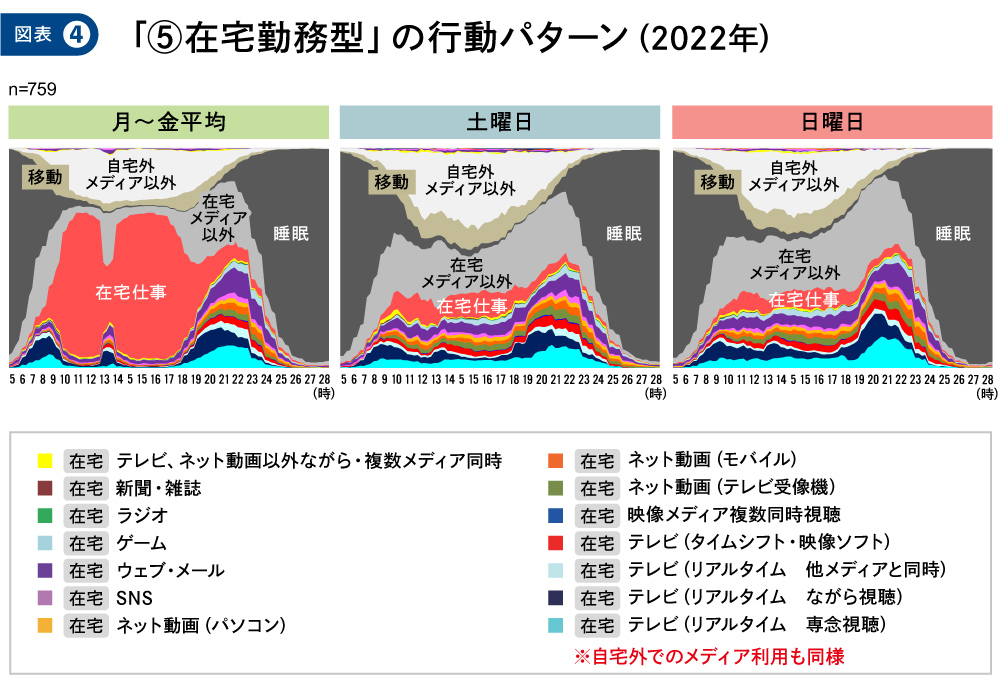
What about the "⑤ Work-from-Home" lifestyle pattern gaining attention during the pandemic (Figure 4)? A distinctive feature absent in other clusters is that "work at home" occupies most of their weekday daytime hours. Interestingly, they take a proper break around noon, engaging with various media. Furthermore, since they work from home on weekdays, they tend to have slightly more opportunities to go out on weekends than on weekdays.
Changes in People's Lifestyles Seen in Cluster Composition Ratios
Finally, let's take a bird's-eye view of the changes in the composition ratio of each cluster before and after the COVID-19 pandemic.
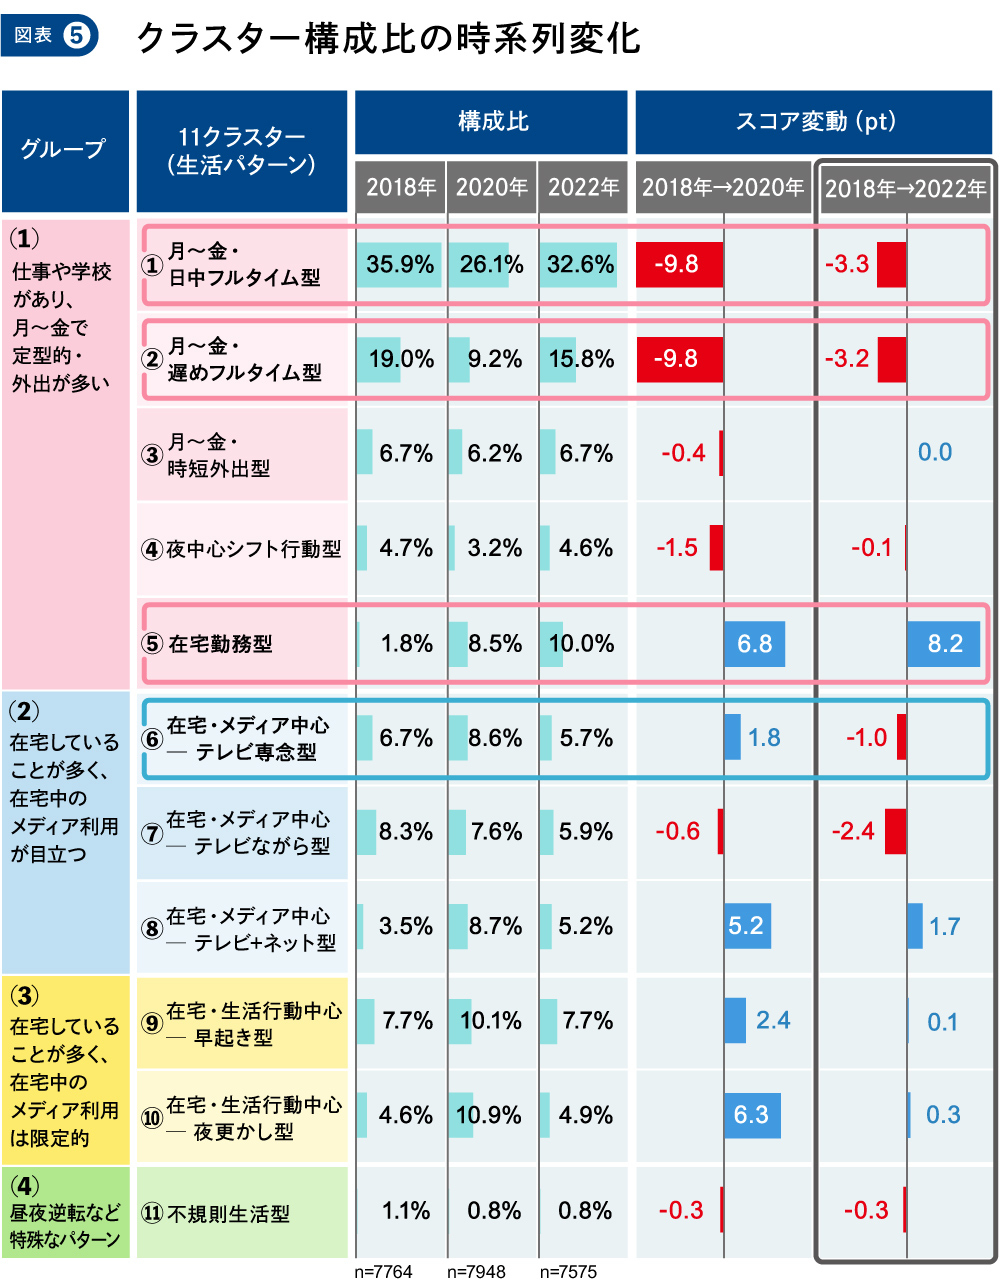
At the group level, the largest group, "(1) Work or school, typical Monday-Friday schedule with frequent outings," shows the most significant fluctuation in its overall share. Its share, which was 68.1% in 2018 (total of Clusters ①-⑤), dropped to 53.2% in 2020, then recovered to 69.7% in 2022.
However, the share of the two mainstream types within this group—"① Monday-Friday, Daytime Full-Time" and "② Monday-Friday, Late Full-Time"—decreased by approximately 3% each from 2018 to 2022. In contrast, the share of "⑤ Remote Work Type," which was only 1.8% in 2018, expanded significantly to 10.0% by 2022.
The expansion of "⑤ Remote Work" can largely be attributed to the influx of some individuals who previously worked full-time on-site (clusters ① and ②). While the decision to introduce and maintain remote work varies by company, this analysis indicates that the lifestyle of working from home has steadily become established since the pandemic began.
Changes are also visible in the composition of clusters centered on home-based lifestyles. For example, the share of "⑥ Home-Based/Media-Centric - TV-Focused Type," characterized by dedicated TV viewing, expanded in 2020 when the pandemic began but has since declined. This suggests that during the early pandemic period, demand for information and entertainment was directed toward television.
This time, we introduced the overview of 11 clusters and examined changes in people's lifestyles through cluster composition ratios ( ). Next time, we will capture changes in people's behaviors based on data regarding the allocation of time spent in daily life within each cluster.
[Survey Overview]
Survey Name: About MCR/ex
Survey Areas: Tokyo 50km radius, Kansai region, Nagoya region, Northern Kyushu region, Sapporo region, Sendai region, Hiroshima region
This paper analyzes data from three regions: Tokyo 50km radius, Kansai region, and Nagoya region
Survey Participants: Individuals aged 12 to 69 (area-random sampling)
Survey Period: June and December annually (Tokyo 50km radius only)
Survey Method: Electronic questionnaire survey
Survey Company: Video Research Ltd.

Was this article helpful?
Share this article
Newsletter registration is here
We select and publish important news every day
For inquiries about this article
Author

Mariko Morishita
Dentsu Inc.
Marketing Administration Center, Media Innovation Research Department (Dentsu Inc. Media Innovation Lab)
After working in the theater industry and research institutions, he joined Dentsu Inc. He conducts extensive research and studies on the impact of technological innovation on the information media market, focusing on audience trends. He also monitors developments in the broadcasting industry and related policies in Western countries.