Note: This website was automatically translated, so some terms or nuances may not be completely accurate.
Significant Differences in "Sleep" and "Outings"! How Did People's Daily Activity Time Change Before and After the Pandemic?
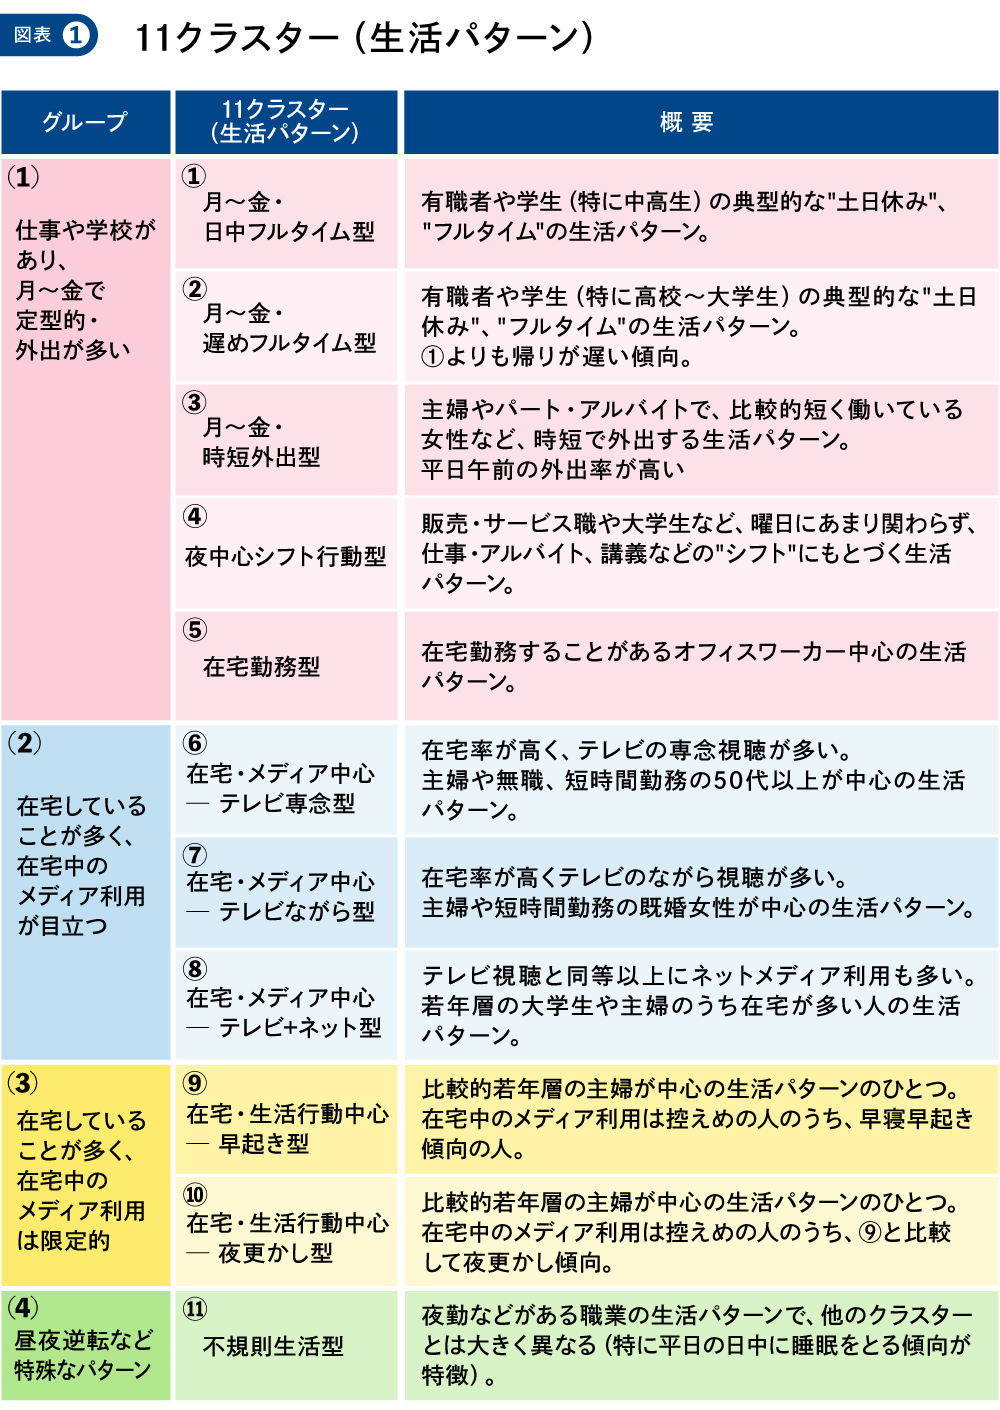
This series introduces parts of the opening feature from the " Information Media White Paper 2023" compiled by Dentsu Inc. Media Innovation Lab. Last time, we looked at the overview and changes in the composition ratios of the 11 clusters (lifestyle patterns) extracted through social sequence analysis using Video Research Ltd.'s "MCR/ex" lifestyle behavior data.
This time, we take a more micro perspective and introduce changes in people's lives before and after the pandemic through the distribution of time spent on daily activities within representative clusters.
What is Social Sequence Analysis?
A statistical analysis method for examining ordered data, such as events or changes in state. "Social" refers to "society," and "sequence" means "order." Developed as a technique for analyzing gene sequences, its application has expanded to social survey data analysis.
For more details on Social Sequence Analysis, see here:
・Media Behavior Data × Social Sequence Analysis:
What is "MCR/ex"?
A diary-style survey conducted by Video Research Ltd. over a specific week. It captures consumers' behaviors—from basic daily activities to media exposure—by day of the week along a time axis, in minimum 15-minute increments.
<Table of Contents>
▼Breaking Down Daily Activity Time to Understand Changes Before and After the Pandemic
▼Sleep Time Increased for Nearly All Clusters After the Pandemic
▼"⑤ Remote Work Type": Morning Commute Time Converted to Sleep Time Due to the Pandemic
▼Changes in Family and Surrounding Environment, Not Just the Individual, Also Impact Daily Activities
Understanding changes in daily activities before and after the pandemic by breaking down activity times
The 11 clusters were classified based on common lifestyle patterns across three time points: 2018, 2020, and 2022.
However, the time allocated to individual activities is not equal across all three time points. Understanding "how much time is allocated to what" within the limited hours of a day, "at what times of day" this allocation occurs, and further, "how this allocation changes over time" even within the same cluster, allows for a more detailed understanding of people's actual lifestyles.
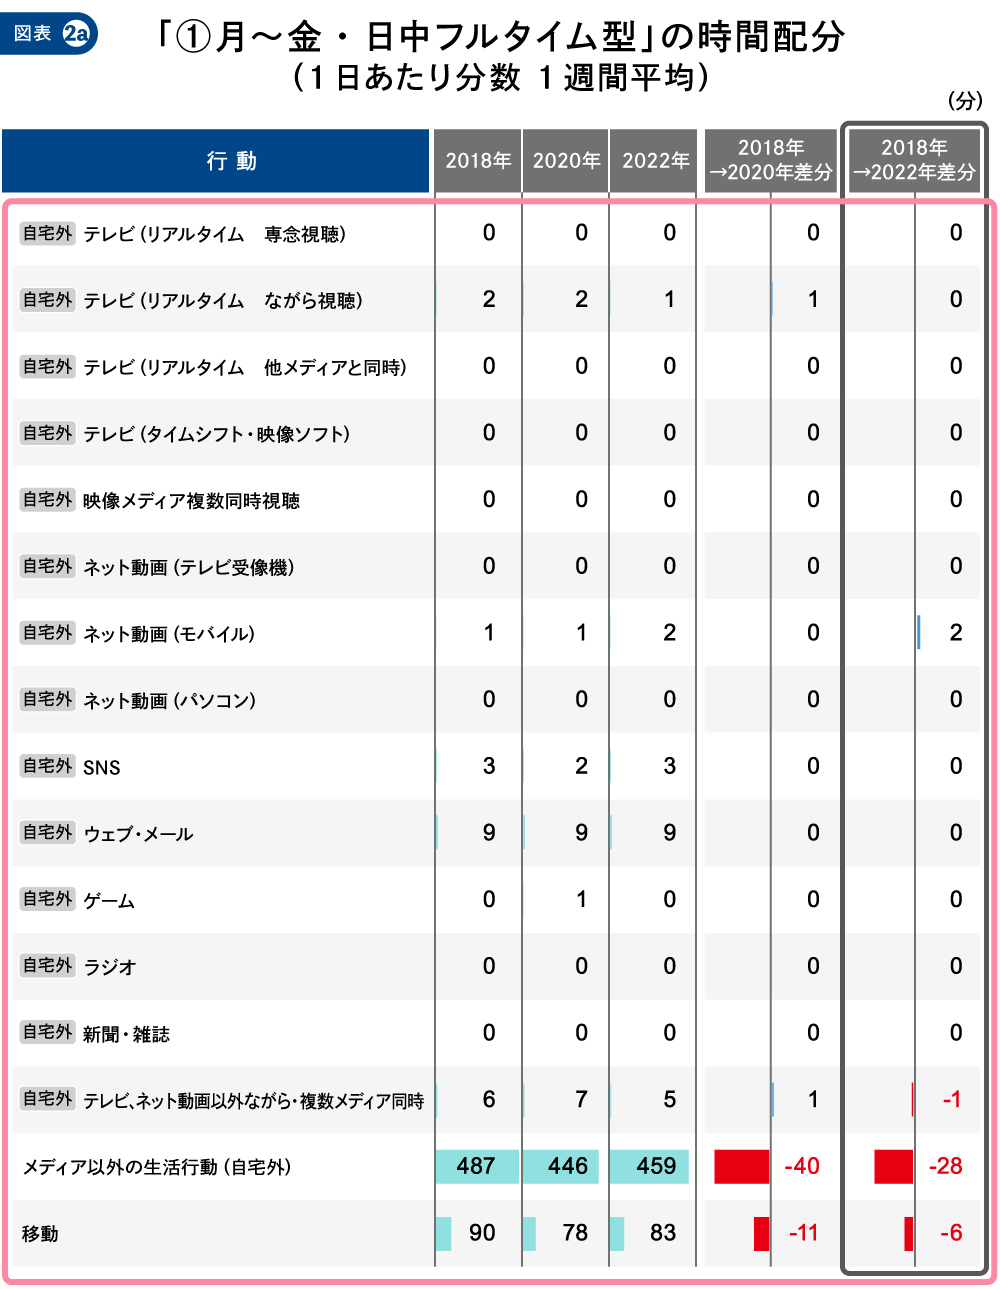
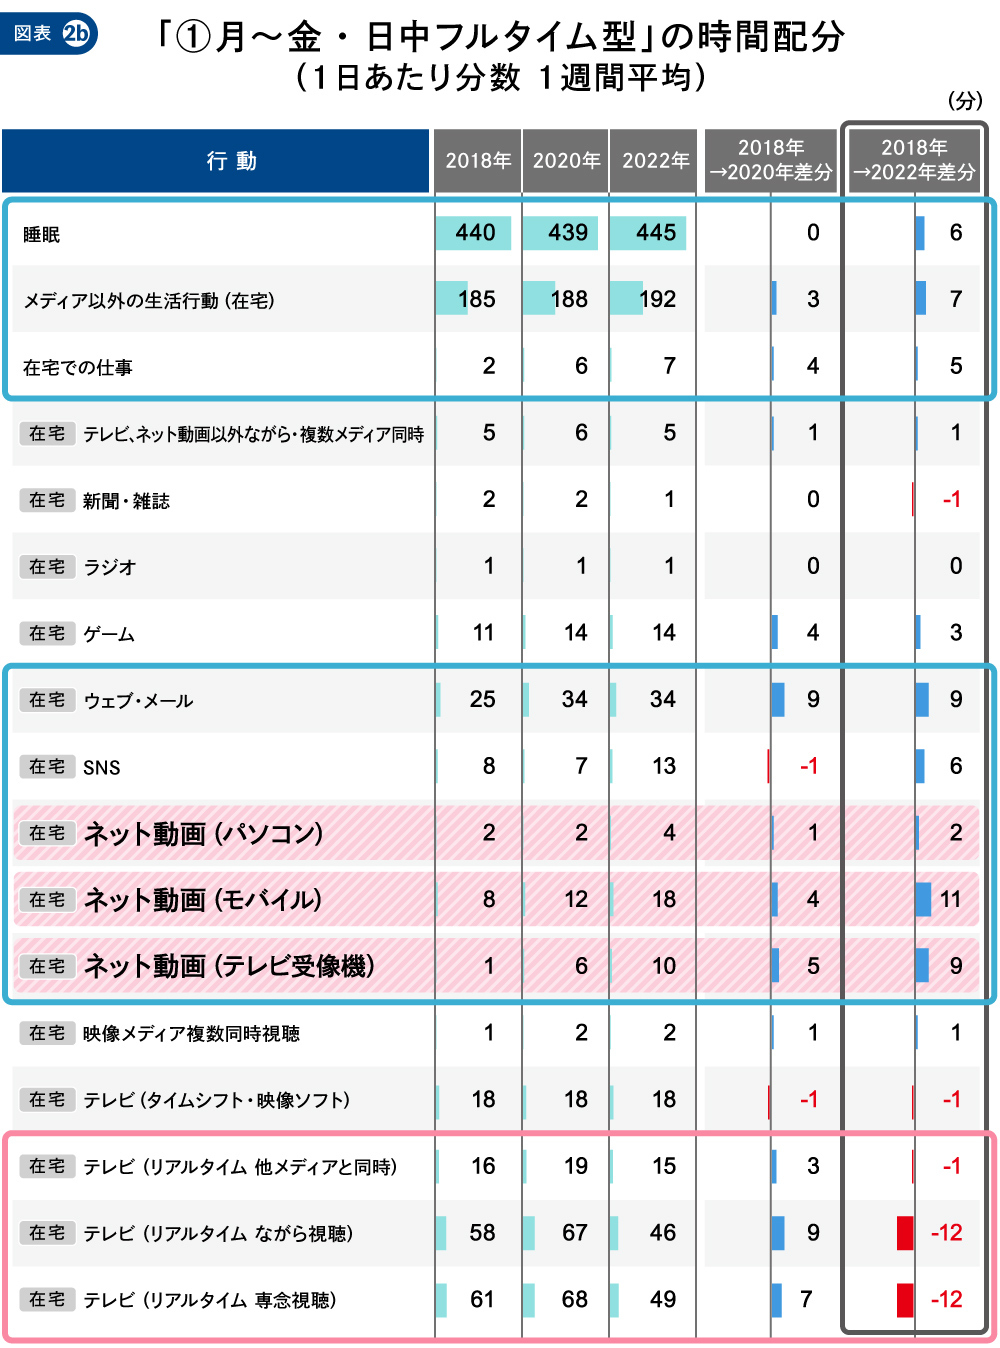
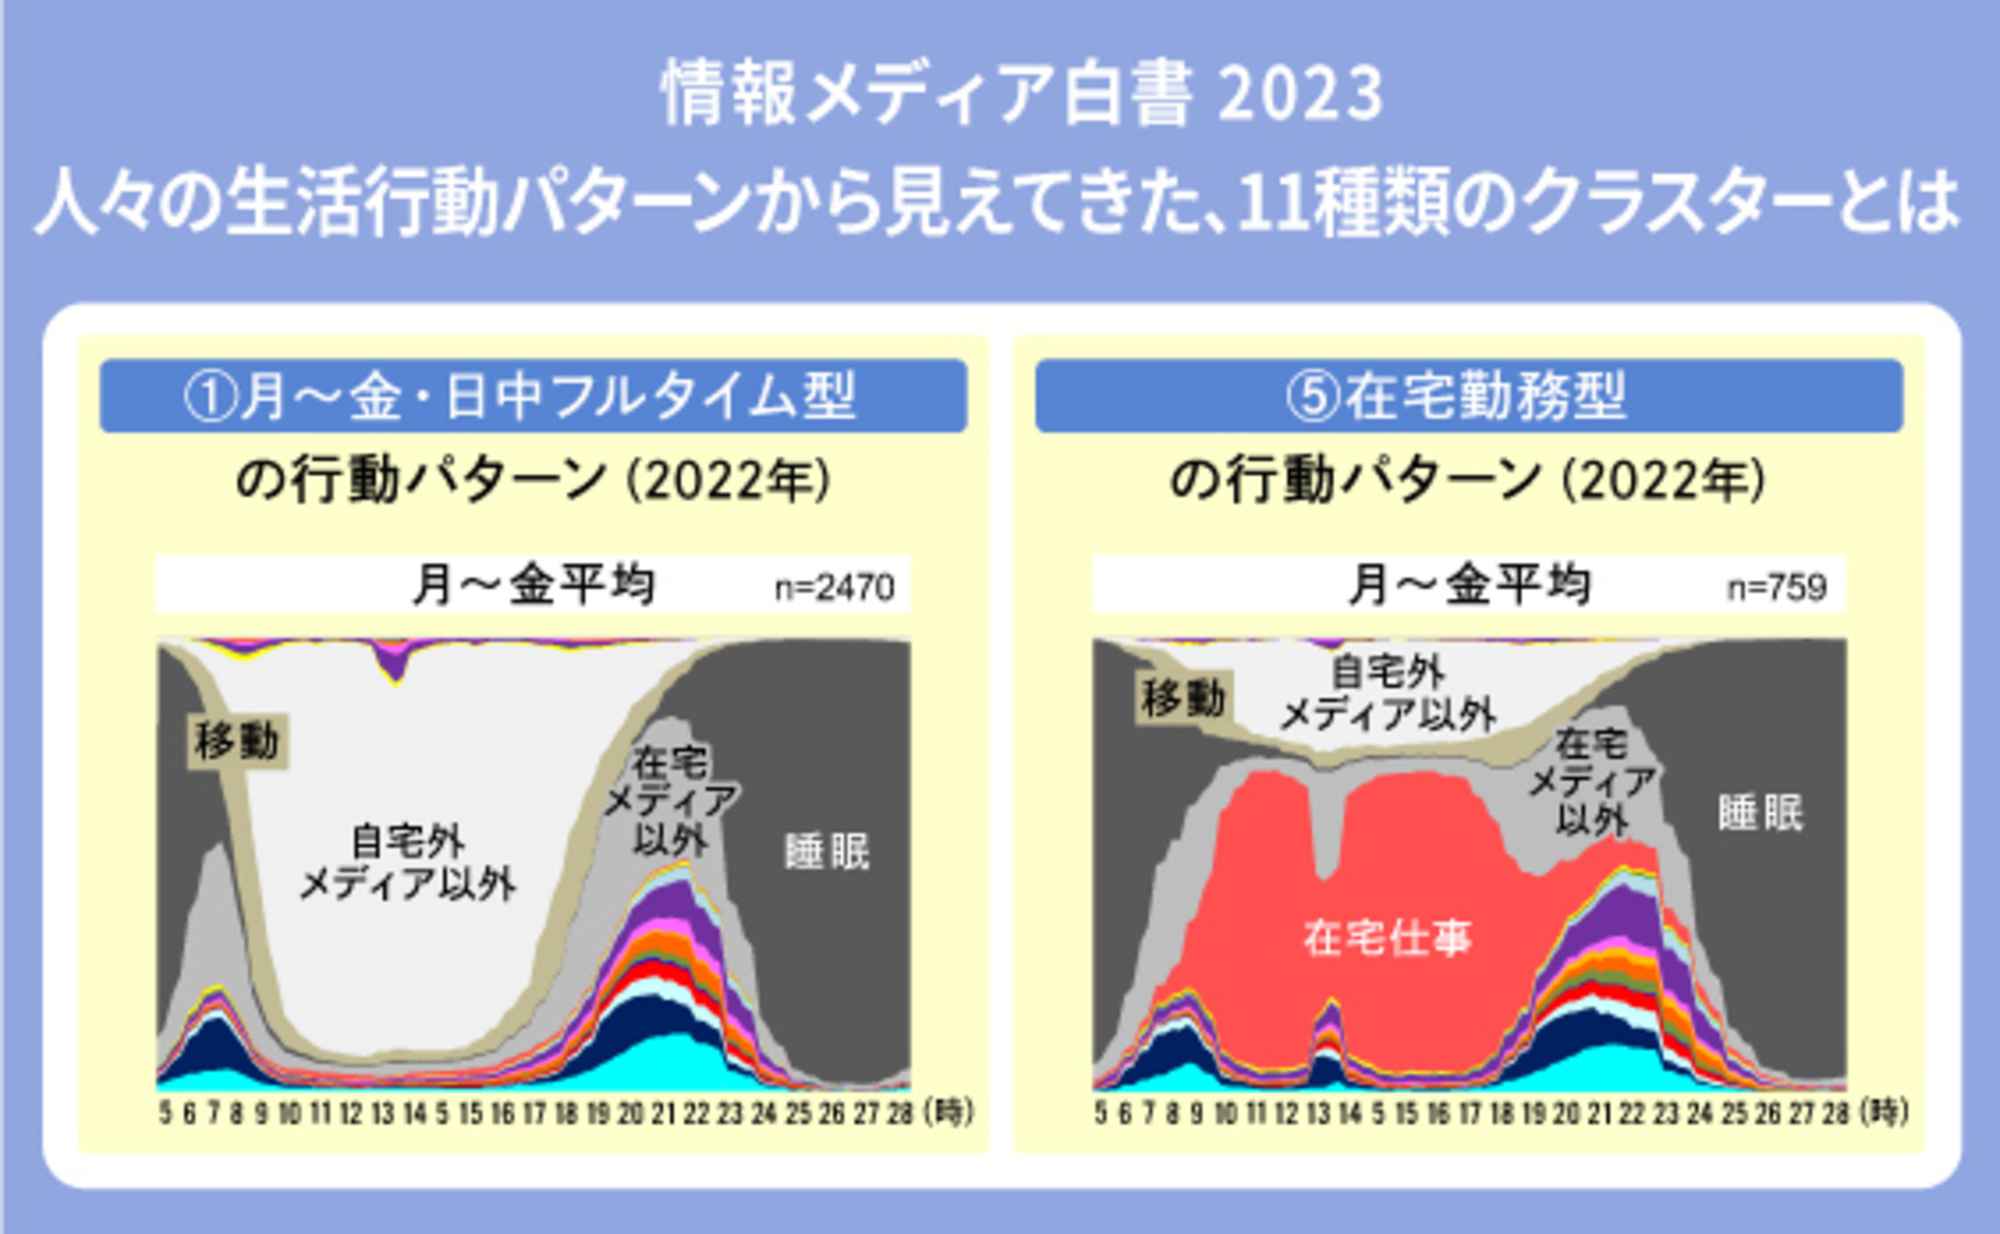
Here, let's examine how time spent on daily activities changed before and after the COVID-19 pandemic for the largest cluster, "① Full-time Daytime Weekday Type" (Chart 2a: Table showing activities outside the home / Chart 2b: Table showing sleep and activities while at home).
Subsequent analysis is based on data from three regions: the Tokyo 50km radius, the Kansai region, and the Nagoya region ( see survey overview here ).
*Fractions are rounded to the first decimal place, so differences may not match the numerical score changes.
This cluster is characterized by going out during weekday daytime hours for work or school. Nevertheless, affected by the COVID-19 pandemic, the daily time spent going out and commuting (weekly average/total of all values in the "2018→2022 Difference" column in Table 2a) decreased by 33 minutes when comparing 2018 and 2022. Furthermore, while real-time TV viewing at home temporarily increased in 2020, it decreased by 25 minutes in 2022 compared to 2018.
Conversely, activities that saw increased time between 2018 and 2022 include online media usage, non-media lifestyle activities and work at home, and sleep. Among online media, time spent watching "online videos" at home notably increased by 22 minutes.
Breaking it down by device, mobile internet video usage, which was 8 minutes in 2018, reached 18 minutes in 2022. Furthermore, internet video usage via television sets, which was only 1 minute in 2018, reached 10 minutes in 2022, showing substantial growth in both cases.
During the pandemic, as time spent at home increased and demand for various forms of entertainment grew, the use of online video services is said to have risen. Even within the lifestyle pattern of the representative cluster "① Full-time Daytime Model (Mon-Fri)" , it appears that watching online videos on large TV screens is rapidly gaining traction, in addition to the traditional smartphone viewing style.
Sleep time increased for nearly all clusters after the pandemic began
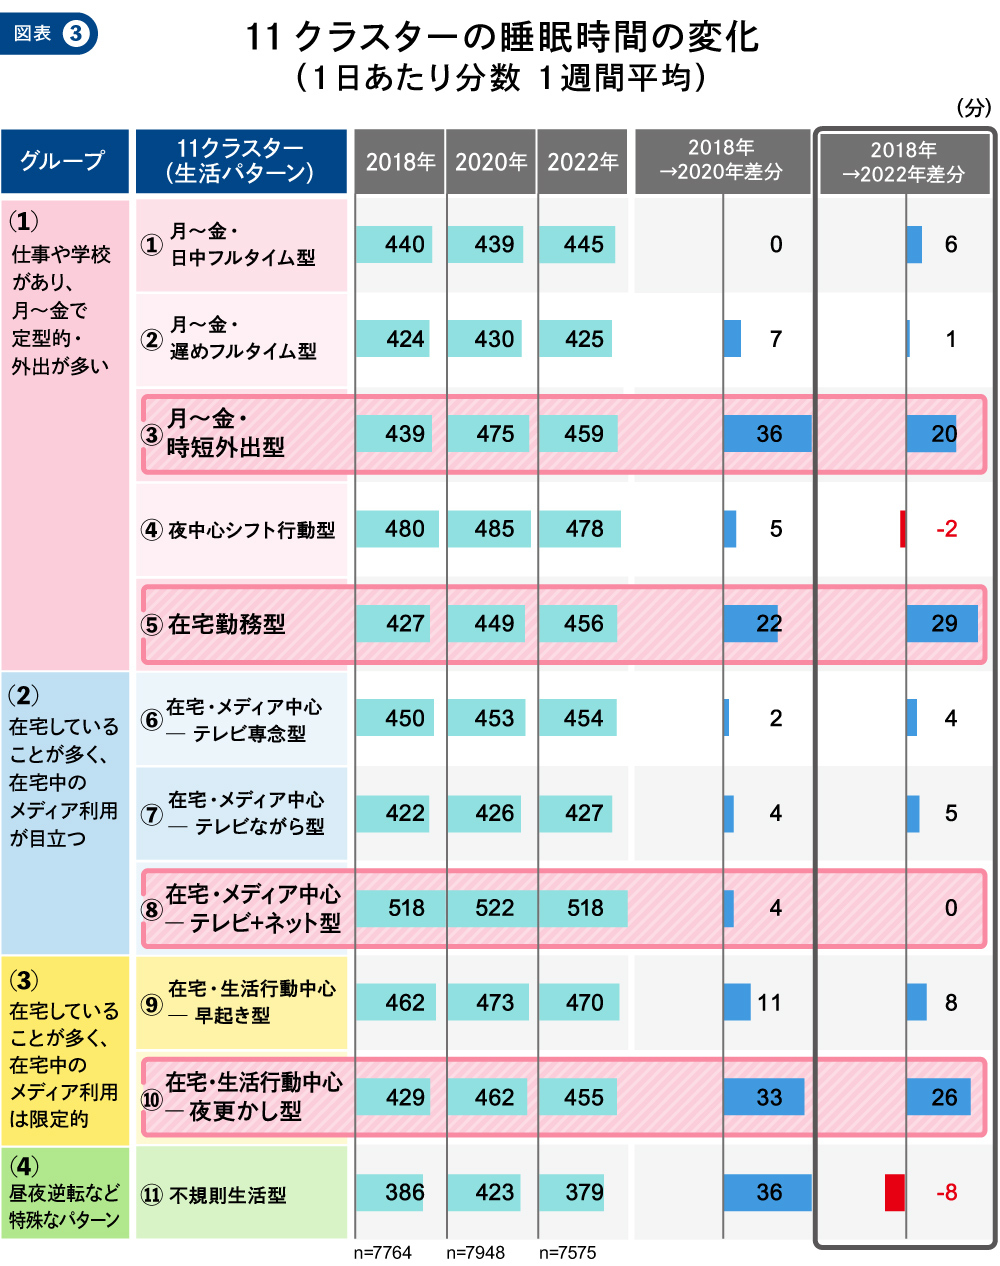
Sleep occupies a significant portion of daily life. It is a crucial behavioral element that brings rhythm to the flow of daily activities. Furthermore, amid heightened health awareness during the pandemic, the importance of sleep has gained widespread recognition. So, what characteristics can be observed in the sleep patterns of the 11 clusters? Figure 3 shows the average weekly sleep time per day for each cluster across the three time points.
*Fractions are rounded to the first decimal place, so differences may not match the numerical score variations.
The cluster with the longest sleep duration across all three time points is "⑧ Home-Based, Media-Centric - TV + Internet Type." This cluster represents a group that tends to have relatively more control over how they spend their time at home. They consume internet media as much or more than they watch TV and includes younger university students and housewives who spend a significant amount of time at home. While their sleep duration itself is long, the fluctuation in sleep time around the pandemic period was not particularly large. After increasing by 4 minutes in 2020, it returned to the 2018 level of 518 minutes in 2022.
Looking at sleep time trends by survey year, sleep time increased for nearly all clusters after the pandemic. Notably, sleep time for "③ Weekday Short Outings Type," "⑤ Remote Work Type," and "⑩ Home-Based Lifestyle - Late Night Type" increased by over 20 minutes from 2018 to 2022.
These clusters include many married women and office workers who work from home. Among these, the "⑤ Work-from-Home Type" cluster showed the largest increase in sleep duration from 2018 to 2022, at 29 minutes. What factors brought about this change?
The "⑤ Remote Work Type" saw morning commute time converted into sleep time due to the pandemic
Figure 4 shows the trend in the "sleep activity rate (weekly average)" throughout the day for "⑤ Remote Workers." The sleep activity rate indicates the proportion of people sleeping during that time period. Focusing on the morning hours, the sleep activity rate in 2020 and 2022 exceeded that of 2018. In 2018, 33.8% of people were still asleep at 7:00 AM, but this increased significantly to 49.1% in 2022. This indicates a trend toward later wake-up times.
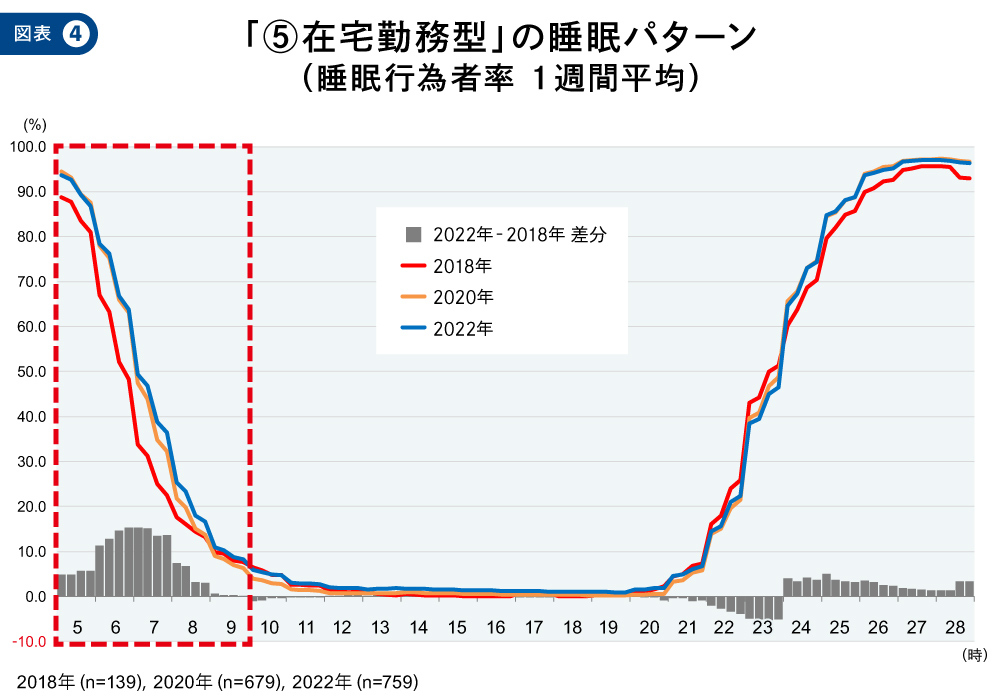
In 2018, the "⑤ Remote Work" category accounted for only 1.8% of the total. Considering the sharp increase in people shifting to primarily remote work due to the pandemic, this new group is likely responsible for driving the trend toward sleeping in. Many of these individuals are assumed to have commuted full-time before the pandemic. The elimination of the commute through remote work likely led them to start waking up later.
Changes in factors "other than the individual," such as family and surrounding environment, also influence daily behaviors
Over the past two installments, we've examined how people's lives have dynamically changed during the pandemic through social sequence analysis of lifestyle data.
This analysis covers three areas, and changes in daily patterns due to the introduction of remote work appear to be a particularly pronounced trend in large cities. While this point requires consideration, as of 2022, we observed a slight decrease in the pattern of leaving home on weekdays for full-time work or school, while the pattern of remote work has become established.
Furthermore, examining time allocation within each cluster revealed changes in fundamental daily activities like sleep, as well as shifts in engagement with media such as television and the internet, both before and after the pandemic.
It should be noted that numerous factors influence changes in people's behaviors throughout the daily rhythm. For example, individuals living with family members may find their lifestyle altered, even if their own circumstances remain unchanged, simply because family members adopted remote work during the pandemic. Moving forward, when considering the background of people's daily activities and media usage, it will be necessary to factor in not only their personal attributes and preferences but also the potential influence of changes in their surrounding environment.
[Survey Overview]
Survey Name: About MCR/ex
Survey Areas: Tokyo 50km radius, Kansai region, Nagoya region, Northern Kyushu region, Sapporo region, Sendai region, Hiroshima region
This paper analyzes data from three regions: Tokyo 50km radius, Kansai region, and Nagoya region
Survey Participants: Individuals aged 12 to 69 (area-random sampling)
Survey Period: June and December annually (Tokyo 50km radius only)
Survey Method: Electronic questionnaire survey
Survey Company: Video Research Ltd.

Was this article helpful?
Share this article
Newsletter registration is here
We select and publish important news every day
For inquiries about this article
Author

Mariko Morishita
Dentsu Inc.
Marketing Administration Center, Media Innovation Research Department (Dentsu Inc. Media Innovation Lab)
After working in the theater industry and research institutions, he joined Dentsu Inc. He conducts extensive research and studies on the impact of technological innovation on the information media market, focusing on audience trends. He also monitors developments in the broadcasting industry and related policies in Western countries.