Note: This website was automatically translated, so some terms or nuances may not be completely accurate.
Log Analysis for Deep Insights into Smartphone Users (2) ~ When and for how long are apps used? "Smartphone Biorythm"

Akira Amano

dentsu Media Innovation Lab
Dentsu Inc.
This column is a follow-up to " Insight Memo #44: Log Analysis for Deep Understanding of Smartphone Users (1) - Why Do Older Women Use Game Apps More Often? " published on May 12, 2015, which introduced log analysis of smartphone apps conducted by DENTSU SOKEN INC. Media Innovation Research Department.
Information behavior on smartphones is now largely app-centric, forming the mainstay of our daily communication. Furthermore, the economic scale surrounding smartphone apps has significantly expanded, making the importance of focusing on this field increasingly strong.
Considering these communication trends, DENTSU SOKEN INC. Media Innovation Research Department conducted log analysis of smartphone apps using the i-SSP Mobile panel provided by INTAGE. We will explain some of the research findings through three charts, each focusing on a different perspective.
(1) Peak usage times are daytime and nighttime. Which apps are most frequently used?

The recent proliferation of smartphones has placed people in a constantly connected environment, accelerating the fragmentation of information behavior. We now tailor our daily information activities to our individual needs, and the ability to freely control information input/output at our fingertips seems to be making the time units of information behavior increasingly shorter.
This indicates that traditional methods like surveys or interviews cannot capture detailed app usage patterns. To understand smartphone users' behavior, leveraging log data has become indispensable.
App usage can no longer be captured even at the minute level; it now demands resolution down to the second. This is precisely the kind of data only log analysis can provide.
With this background in mind, we first want to track smartphone users' app usage patterns along the timeline of a single day. Here, we conceptualize this daily behavioral pattern as a "smartphone biorhythm" and introduce a perspective for grasping the "ups and downs" of app usage.
Figure 1 illustrates which categories of apps are launched during each time slot, color-coded by category.
*For detailed breakdowns of apps within each category, please refer to the end of the document.
Looking at the overall picture, categories consistently used throughout the day (maintaining a thick belt) include "Browser/Portal," "Email," "Social Network," "Instant Messenger," "Tools," and "Games."
What people seek is information gathering, communication with others, entertainment to pass the time, and various convenient functions... These points align well with our daily experiences, don't they?
Next, note the specific times of day when people frequently launch apps.
The line graph represents the "Overall Launch Rate." The times with high rates—the "peaks" in the chart—are the 12 PM hour at 67.0%, followed by the 6 PM hour at 66.1%, and the 8 PM hour at 65.6%.
This reveals that the peak launch times align with the lunch break period for many people and the evening hours after school or work has wrapped up.
Let's dig deeper and examine whether certain apps are more likely to be used during specific time slots. While we identified peak launch times earlier, are there differences in the types of apps used during daytime versus evening hours?
Comparing the scores for the 8 PM time slot divided by the scores for the 12 PM time slot reveals high values: "Video Sharing" at 152.6%, "Video Streaming" at 126.4%, and "Healthcare/Fitness" at 134.0%. This indicates these apps are more frequently used in the evening.
Conversely, "News" is at 60.3%, "Education" at 24.9%, and "Finance/Business" at 66.8%, meaning these apps are more likely to be used during the day.
If we simplify slightly and sketch a user profile based on both, it might look like this: During the day, they actively gather information using news apps, and at night, they enjoy watching their favorite videos using streaming and sharing apps.
(2) Middle-aged and older women who enjoy long gaming sessions. How long do they use each app?

Next, based on Figure 2, let's examine the specific daily usage time for apps in each category.
First, we see that smartphone users overall (ages 15-69) spend about 2 hours (115 minutes) per day using smartphone apps.
Focusing on the younger age groups with the highest usage, men in their 20s (136 minutes) and women in their teens (148 minutes) show the longest usage times, confirming that these groups are driving smartphone usage.
Within this younger demographic, social networking and instant messaging apps command the longest usage times. While both apps primarily focus on "connecting with people," a comparison reveals that instant messengers are launched more frequently, while social networking apps accumulate longer total daily usage times.
From the perspective of usage time, categories like video sharing, instant messengers, social networking, music, and photos/videos are driving the overall length of total usage time.
Finally, an interesting point emerges in the gaming category. While there's a common perception that younger people play game apps more, log analysis actually reveals that middle-aged and older women spend significantly more time on them. Despite having shorter overall smartphone usage times, this demographic spends 26.5 minutes on gaming apps in their 40s and 30.1 minutes in their 50s – indeed longer than younger age groups.
This trend was also observed in the first report introduced at the beginning, suggesting it is indeed a consistent pattern. While the previous report focused on the high frequency of app launches, this research reveals that not only are launches frequent, but the actual time spent playing game apps is also longer.
(3) Two peaks in usage time distribution: "Up to 2 minutes" and "6–10 minutes"
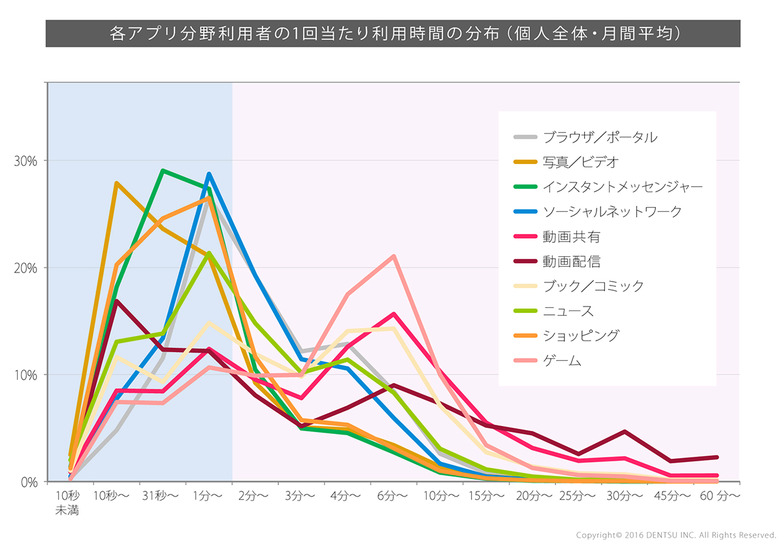
This final chart examines how the average usage time per session varies by app category.
Figure 3 visualizes how the average usage time per session varies across different app categories.
Comparing the average session duration by app category reveals a clear split: some categories concentrate usage within 2 minutes, while others spread usage between 6 and 10 minutes. Comparing the peaks in usage time distribution shows: - Photo/Video: 10–30 seconds - Instant Messengers: 31 seconds to under 1 minute - Social Networks, Browsers/Portals, News: 1 to under 2 minutes
Games and video sharing show peaks between 6 and 10 minutes. Video streaming, in particular, tends to show a greater dispersion toward longer durations.
What's noteworthy here isn't so much the length of each session, but rather the degree to which usage spans both short and long durations. This reveals the unique characteristics of how each app category is used.
Finally, by tracing back to the underlying aggregated data behind this chart, we can identify two insights.
One is that usage time distribution varies across generations—some categories show similarity, while others do not.
Categories showing potential similarities in usage across generations include "Social Networks," "Instant Messengers," "Photos/Videos," and "Browsers/Portals." While further qualitative research is needed for deeper analysis, comparing user segments from a usage time perspective can yield valuable insights.
The second insight is that for content consumption categories like "Games," "Books/Comics," and "Video Streaming," female users tend to have longer usage time per session.
While gaming was touched upon in Figure 2, this also represents a perspective worth exploring further.
We have now examined three key points through three charts.
We see results that align with our intuition, as well as those that challenge it. While this analysis described insights from keywords like "smartphone biorhythm" and usage duration in specific app categories, I want to emphasize one final point: beyond these individual discoveries, the perspective of extracting patterns visible only through the accumulation of logs is equally crucial.
It is precisely the awareness of these "invisible patterns" revealed by accumulating people's behavioral histories (log data) that provides marketers and researchers seeking target insights with significant hints for forming new hypotheses about users' information behaviors.
[Main Breakdown by App Category]
1. Games... Disney Tsum Tsum, Puzzle & Dragons, LINE Poko Poko, Neko Atsume (etc.)
2. Tools…Phone book, Clock, Schedule memo, Calculator, Siri (etc.)
3. Finance/Business... Rakuten Edy, Mobile Wallet Web Plugin (etc.)
4. Transportation/Navigation… Google Maps, Yahoo! Transit Guide, Eki Supaatto (etc.)
5. Weather... Yahoo! Weather, Weathernews Touch, LINE Weather (etc.)
6. Travel... ANA, Rak uten Travel, Jalan (etc.)
7. Sports... SPONAVI Professional Baseball Live 2015, Rakuten GORA Golf Course Reservations (etc.)
8. Healthcare/Fitness…Pedometer, Lunaruna Lite, Apple Health (etc.)
9. Lifestyle…Cookpad, McDonald's Japan, Docomo Coupons (etc.)
10. Shopping…Rakuten Ichiba, Yahoo! Auctions!, Amazon App (etc.)
11. Education… Handy Timetable, Studyplus, Lesson Management+ (etc.)
12. Entertainment…G-Guide TV Schedule・GEO・radiko.jp (etc.)
13. Music…Apple Music, LINE MUSIC, Google Play Music (etc.)
14. Books/Comics…comico, LINE Manga, iBooks, Shonen Jump+ (etc.)
15. News…SmartNews, Yahoo! News, Gunosy, LINE NEWS (etc.)
16. Video Streaming…One Seg, dTV, DMM Video, GYAO!, Hulu (etc.)
17. Video Sharing …YouTube, niconico, TwitCasting, Vine (etc.)
18. Social Networks …Facebook, Twitter, Instagram, Ameba, Google+ (etc.)
19. Instant Messengers…LINE, Facebook Messenger, KakaoTalk, Viber (etc.)
20. Photo/Video… Album, Camera, aillis (formerly LINE camera), etc.
21. Browser/Portal…Browser・Google (Search)・Chrome Browser・Yahoo! JAPAN・Safari (etc.)
22. Email…sp mode mail, Gmail, Yahoo! Mail (etc.)
23. Calling…Phone, FaceTime, Rakuten Denwa, Hangouts, 050 plus (etc.)
※ "16. Video Streaming" refers to professionally produced video content intended for distribution,
while "17. Video Sharing" refers to services where users themselves create, publish, and share video content.
※ "18. Social Networks" primarily refers to services enabling communication with an unspecified number of users in an open environment,
while "19. Instant Messenger" refers to services primarily used for communication between individuals or within groups in a closed environment.
【Survey Overview】
Data Used:
i-SSP Mobile Panel (nationwide, ages 15-69) usage logs from July 1 to 31, 2015
Target OS: ① iOS (iPhone) ② Android
Valid sample size N=10,806 (weighted to reflect OS usage share by gender and age group based on external survey data)
Number of Apps Included in Analysis:
Number of apps meeting aggregation criteria: iOS: 501, Android: 551
*"i-SSP (Intage Single Source Panel)" is provided by Intage Inc.
Was this article helpful?
Share this article
Newsletter registration is here
We select and publish important news every day
For inquiries about this article
Back Numbers
Author
Akira Amano
She holds a Master of Arts (M.A.) from the Graduate School of Interdisciplinary Information Studies at the University of Tokyo. She specializes in research and development, as well as consulting, regarding the use of social media for marketing and trends among younger demographics.His latest book is *Business of the New Generation Is Born from Smartphones: Social Media Marketing in the Era of Short Videos* (2022, Sekai Bunka Sha). Other works include *The Psychology of Sharing: Seven Perspectives on Decoding the Social Media Information Environment* (2017, Senden Kaigi) and *A History of Social Media: The Future of a Society Connected by ‘Likes’* (2019, East Shinsho).He has co-authored numerous publications, including the “Information Media White Paper,” “Advertising White Paper,” and “Media Literacy: Cultivating Critical Thinking.” He frequently serves as a commentator on economic programs and as a speaker at various events. He has been a part-time lecturer at Meiji Gakuin University since 2023. He left Dentsu Inc. at the end of March 2026.
dentsu Media Innovation Lab
Dentsu Inc.
Launched in October 2017, leveraging Dentsu Inc.'s longstanding media and audience research expertise. Conducts research and disseminates insights to capture shifts in people's diverse information behaviors and understand the broader media landscape. Provides proposals and consulting on the communication approaches companies need within this context.