Note: This website was automatically translated, so some terms or nuances may not be completely accurate.
Mobile Internet Use at Home Increases! The Pandemic Highlights Information Media Needs
Dentsu Inc. Media Innovation Lab published the " Information Media White Paper 2021 " (Diamond Inc.) in March.
The year 2020 saw our daily lives and social activities significantly impacted by the novel coronavirus. The information media industry and people's media consumption behaviors were also forced to change. In response to this situation, the "Information Media White Paper 2021" features the following special sections:
■Feature I: The Information Media Industry During the Pandemic
・Part 1: Changes in Daily Life and Media Consumption During the Pandemic
・Part 2: Complete Record: Monthly Table 2020/2–12 – The Pandemic and Movements in Each Information Media Industry
This series will introduce the essence of Part 1, accompanied by data and charts. In the first installment, we will examine how people's daily behaviors and media consumption patterns changed during the pandemic.
Significant Increase in Time Spent at Home During the Pandemic
Here, we use data from the MCR/ex survey(※1) covering the first half of 2020 within a 50km radius of Tokyo to unravel the patterns of daily activities and media consumption during the pandemic.
The survey was conducted from June 1 to 7, 2020. Although the state of emergency was lifted on May 25, the Tokyo Alert was activated on June 2 due to a surge in new infections, coinciding with a period when residents in the greater Tokyo area were urged to limit outings.
※1 = MCR/ex survey
A diary-style survey conducted by Video Research Ltd. over a specific week. It captures consumers' activities—including basic daily routines and media consumption—by day of the week and time period, in minimum 15-minute increments.
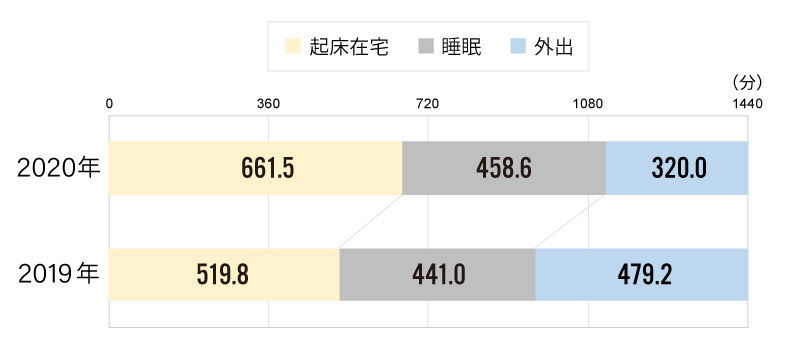
Figure 1 shows the time spent at home after waking, sleeping, and going out per day (weekly average) for the entire individual population (ages 12-69). Compared to 2019, time spent going out decreased by 2 hours and 39 minutes in 2020, while time spent at home after waking increased by 2 hours and 22 minutes. Sleep time also increased slightly, a trend particularly noticeable among younger age groups.
[Figure 1] Daily Time Spent Awake at Home, Sleeping, and Outdoors (Weekly Average / Ages 12–69)
Most media saw increased usage, including TV and the internet
As time spent at home increased, how did people engage with media? Figure 2 shows the average daily media exposure time (weekly average) for all individuals. While simultaneous exposure to multiple media is possible, the total exposure time across all media in 2020 increased by over one hour compared to 2019, reaching a total of 6 hours and 10 minutes.
[Figure 2] Daily Media Contact Time at Home (Weekly Average / Ages 12-69)
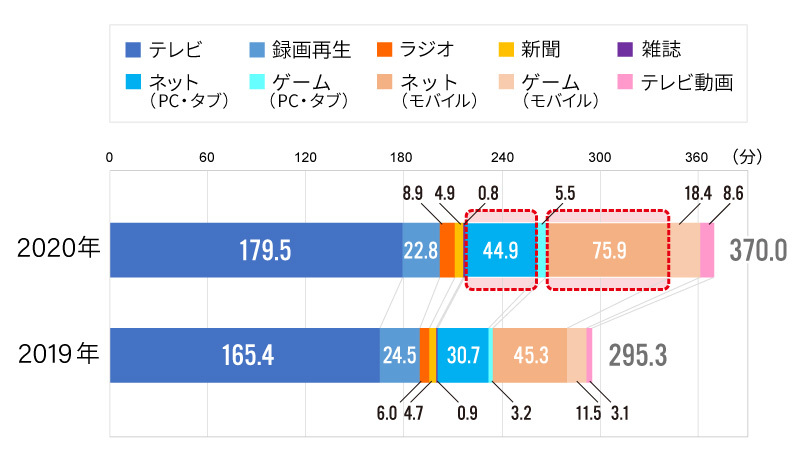
Looking at the breakdown, contact time for most media increased compared to 2019. Particularly noticeable is the time spent using the internet via mobile (highlighted in red) and via PC/tablet.
Even before the pandemic, "mobile internet at home" had the longest usage time (※2). This trend continued in 2020 as time spent at home increased, with mobile internet usage time surging dramatically.
※2
The main battlefield for the internet is "at home" and " via smartphone"
While real-time TV viewing time increased, recorded playback showed a slight decrease. One factor is likely the increase in time spent at home.
Also noteworthy is the more than doubling of online video viewing on TV sets (TV video), from 3.1 minutes the previous year to 8.6 minutes. It appears TV sets are steadily expanding their role as a platform for online video consumption.
Note the high rate of mobile internet use at home!
So, how are media used throughout the day? Figure 3 shows the trends in activity rates (awake at home, sleeping, commuting, going out) and media contact rates (per 60-minute interval) for the entire population over a 24-hour period starting at 5:00 AM (weekly average).
The downward-sloping line graph at the top of the chart shows media contact rates while out. In 2020, mobile internet usage around noon stands out slightly. Compared to 2019, the large dip in the yellow-shaded "awake at home" rate during the daytime has disappeared, suggesting many people remained at home.
[Figure 3] Daily Activity Rates and Media Contact Rates (Weekly Average / Ages 12-69)
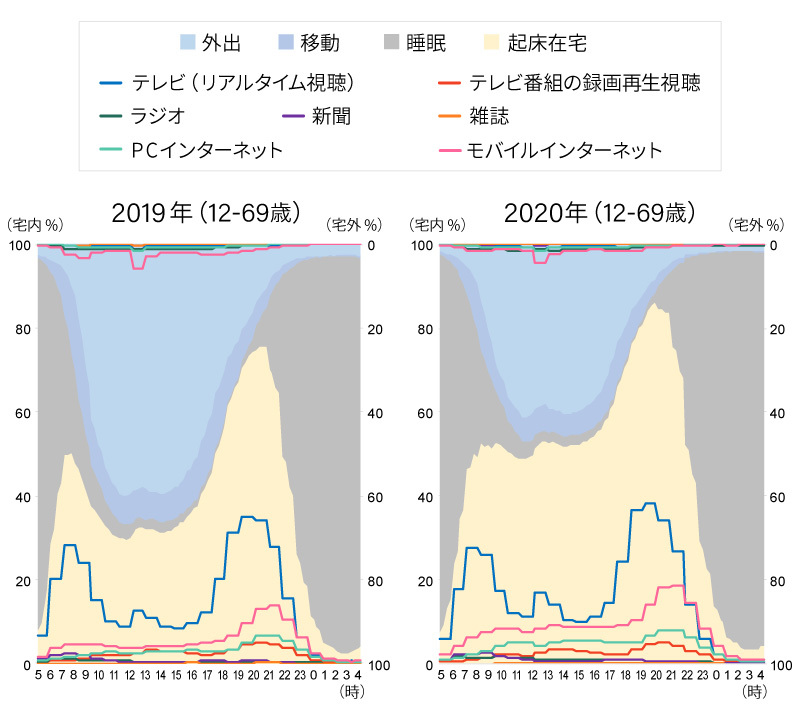
While the rate of being awake and at home remained high throughout the day, television continued to be used more than other media during nearly all daytime hours in 2020. However, the most distinctive feature of 2020 compared to 2019 is that the rate of internet access via mobile devices remained high throughout the day, peaking in the evening.
High School Students' Notable Affinity with Mobile Internet
Finally, Figure 4 shows the daily routine (weekly average) of high school students. In June 2020, when the survey was conducted, remote classes and school closures meant over 60% of high school students were awake and at home during the day. This generation experienced particularly significant lifestyle changes during the pandemic. Consequently, previously unseen media engagement behaviors emerged within the home.
[Figure 4] Daily Activity Rates and Media Contact Rates (Weekly Average / High School Students)
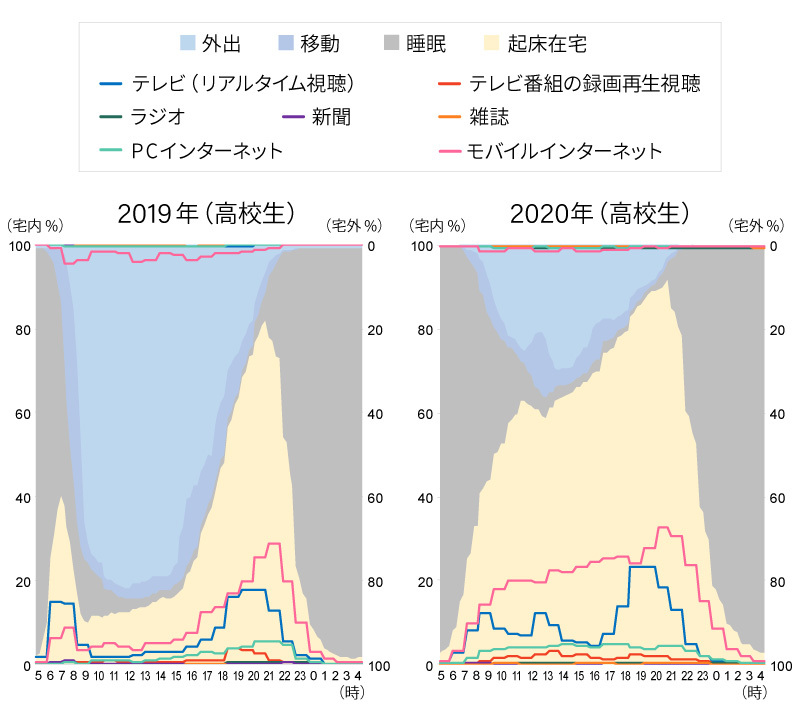
For example, a previously unseen peak in television viewing has emerged around noon, indicating that watching TV during lunch has become part of their daily routine.
Meanwhile, internet access via mobile devices remains consistently high throughout the day, a highly distinctive pattern. While high school students already have a high affinity for mobile internet, in 2020 they accessed mobile internet at levels equal to or exceeding television during all time slots.
Note that internet contact includes web browsing, online video, SNS, and email. As time spent at home increased during the pandemic, it appears they are accessing the internet using the most readily available mobile devices.
This indicates that as time allocated for media consumption increases, the use of media in the most suitable style for each individual—such as via mobile—will accelerate beyond previous trends to satisfy the demand for information and entertainment.
The lifestyle changes brought by the pandemic have inadvertently highlighted the demand for information media. Next time, we will consider the future relationship between media and audiences, taking into account the unique circumstances of the pandemic.
[Survey Overview]
Survey Name: MCR/ex
Conducted: Annually in June and December
Survey Method: Electronic questionnaire survey
Survey Areas: Tokyo 50km radius, Kansai region, Nagoya region, Northern Kyushu region, Sapporo region, Sendai region, Hiroshima region
Survey Participants: Individuals aged 12 to 69 (area-based random sampling)
Survey Company: Video Research Ltd.
Was this article helpful?
Share this article
Newsletter registration is here
We select and publish important news every day
For inquiries about this article
Author

Mariko Morishita
Dentsu Inc.
Marketing Administration Center, Media Innovation Research Department (Dentsu Inc. Media Innovation Lab)
After working in the theater industry and research institutions, he joined Dentsu Inc. He conducts extensive research and studies on the impact of technological innovation on the information media market, focusing on audience trends. He also monitors developments in the broadcasting industry and related policies in Western countries.